Review
. 2017 Mar;22(3):213-237.
doi: 10.1177/2472555216682725. Epub 2017 Jan 6.

Biologically Relevant Heterogeneity: Metrics and Practical Insights

Affiliations
Review

Biologically Relevant Heterogeneity: Metrics and Practical Insights

Albert Gough et al. SLAS Discov. 2017 Mar.

Abstract

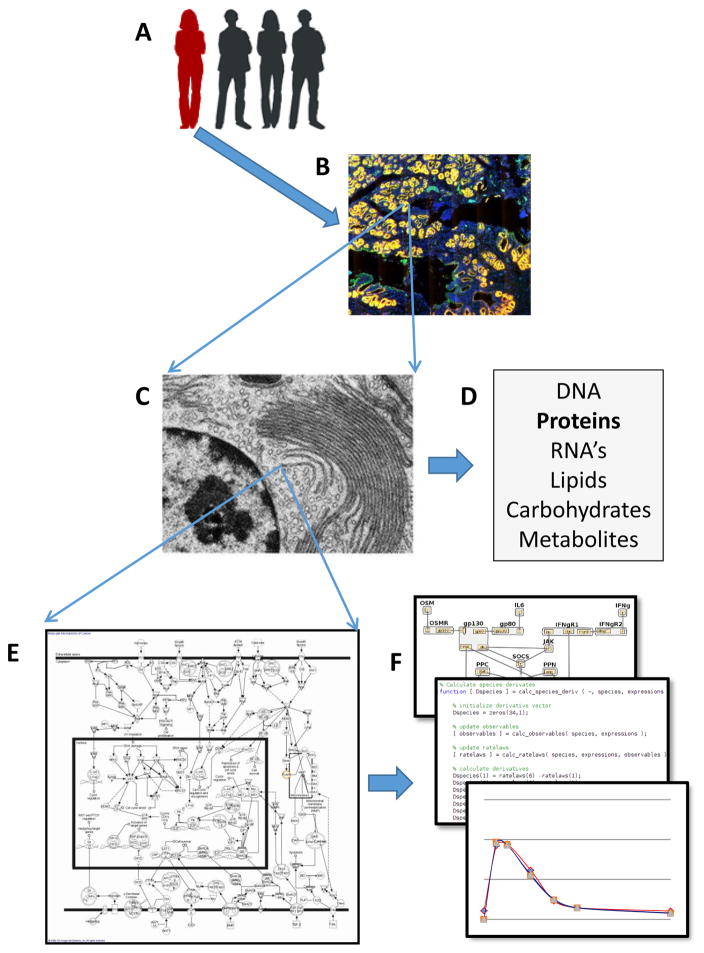
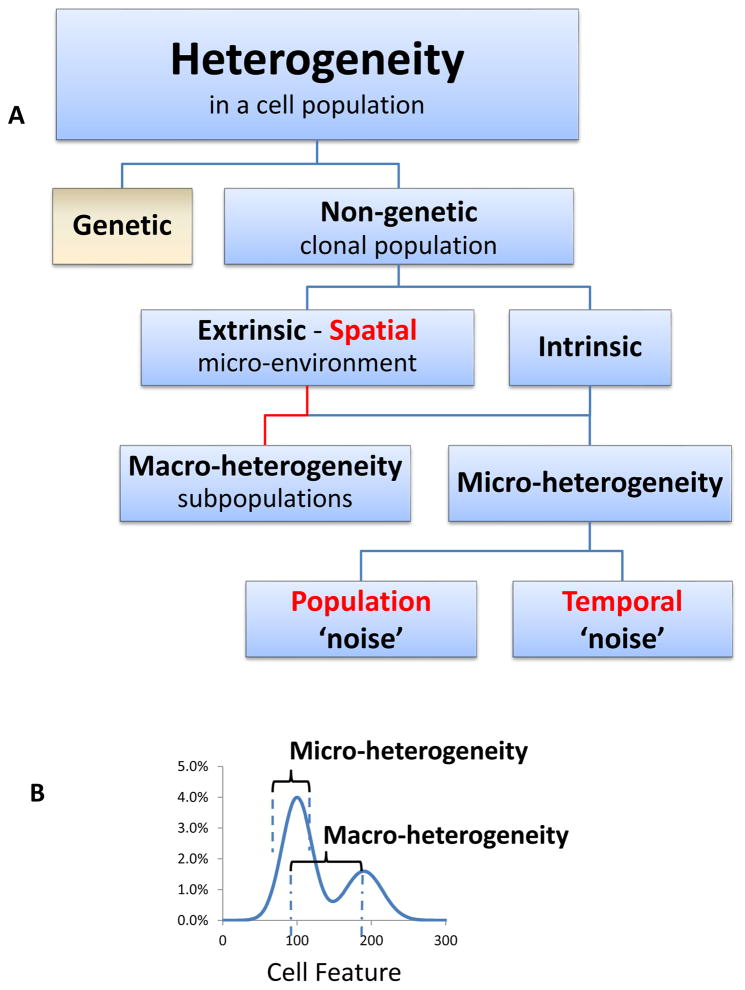
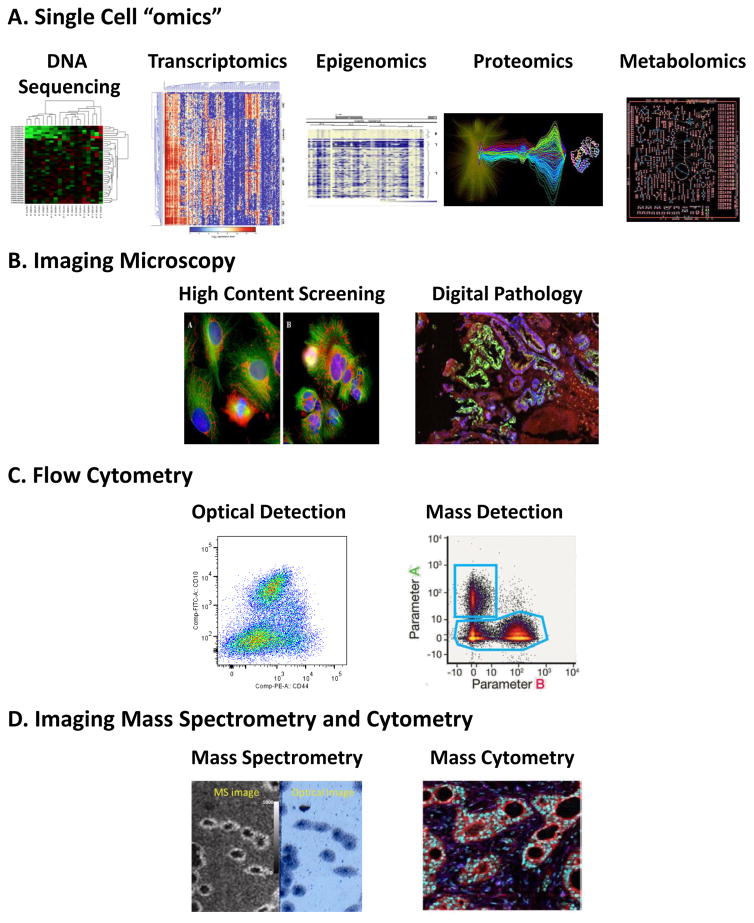
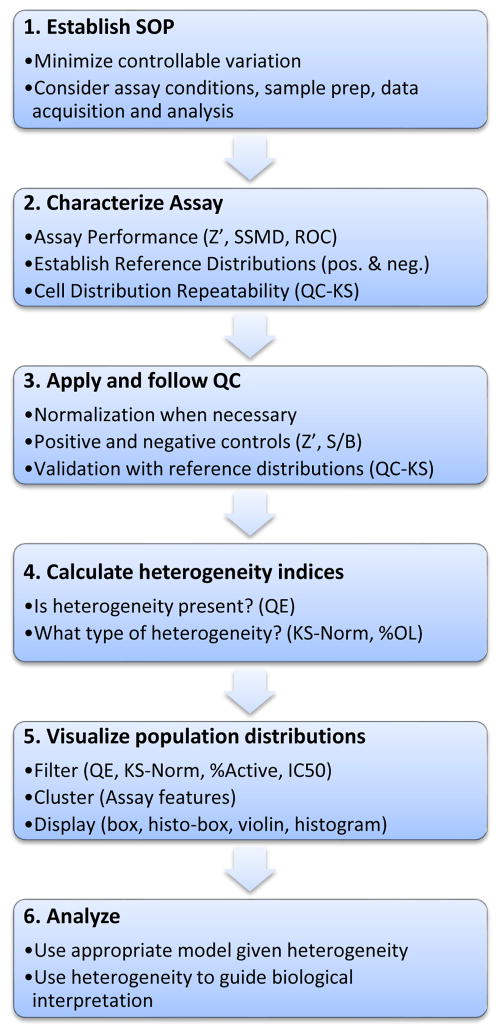
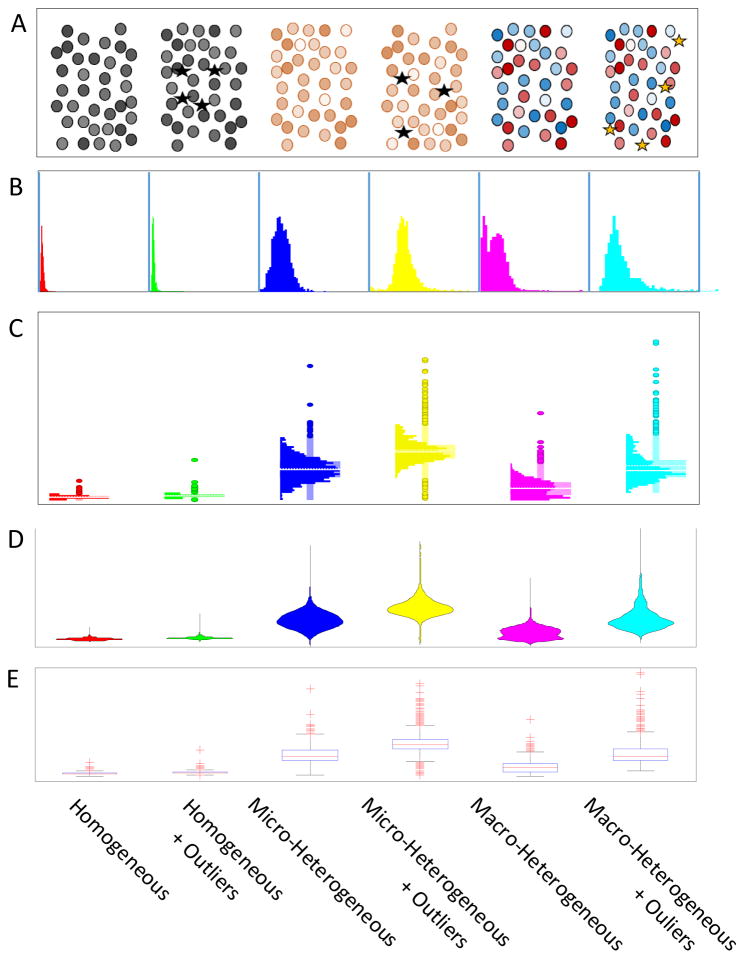
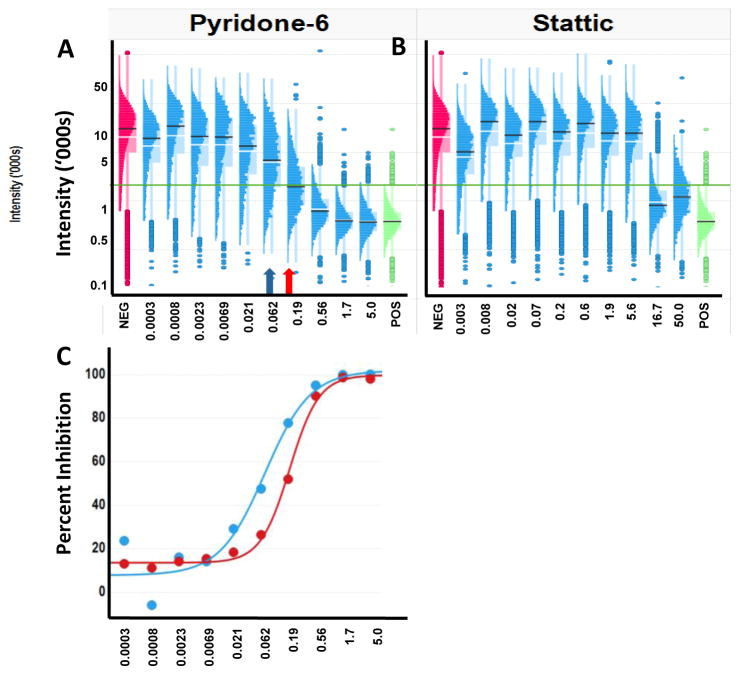
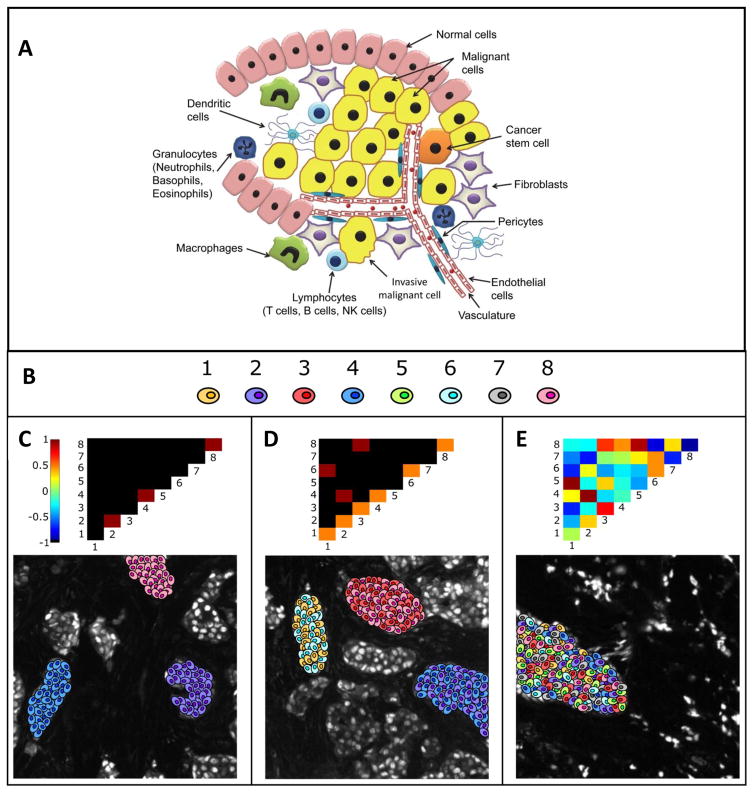
Heterogeneity is a fundamental property of biological systems at all scales that must be addressed in a wide range of biomedical applications, including basic biomedical research, drug discovery, diagnostics, and the implementation of precision medicine. There are a number of published approaches to characterizing heterogeneity in cells in vitro and in tissue sections. However, there are no generally accepted approaches for the detection and quantitation of heterogeneity that can be applied in a relatively high-throughput workflow. This review and perspective emphasizes the experimental methods that capture multiplexed cell-level data, as well as the need for standard metrics of the spatial, temporal, and population components of heterogeneity. A recommendation is made for the adoption of a set of three heterogeneity indices that can be implemented in any high-throughput workflow to optimize the decision-making process. In addition, a pairwise mutual information method is suggested as an approach to characterizing the spatial features of heterogeneity, especially in tissue-based imaging. Furthermore, metrics for temporal heterogeneity are in the early stages of development. Example studies indicate that the analysis of functional phenotypic heterogeneity can be exploited to guide decisions in the interpretation of biomedical experiments, drug discovery, diagnostics, and the design of optimal therapeutic strategies for individual patients.

Keywords: cellular models; computational pathology; drug discovery; flow cytometry; heterogeneity; high-content screening; organs-on-chips; precision medicine; quantitative systems pharmacology; systems biology.


Figures

Figure 1
Figure 1. The multiple scales of biological heterogeneity detected in a population of organisms, as well as within organs, tissues, cells, molecules, pathways and networks
A. Individuals in a population exhibit heterogeneity in a variety of genomic and phenotypic measures. Heterogeneity can be detected B. between and within organs and tissues, C. between cells in terms of expression levels, genomics and functions, and within cells in terms of D. cellular constituents. E. Combinations of molecules interact in time and space within and between cells as part of biological pathways that result in normal and abnormal cellular functions. F. Computational or mathematical models of “systems” including cellular pathways, organ, multi-organ and organism can be generated and used to predict responses that must incorporate heterogeneity of components in the models.
Figure 2
Figure 2
Classification of the types of heterogeneity that can be exhibited by a population of cells (adapted from Huang ). A. Heterogeneity can be the result of genetic variations, and/or non-genetic factors even in a clonal population. Non-genetic heterogeneity, also called phenotypic heterogeneity, can be driven by extrinsic factors, such as the microenvironment in a tissue that can influence for example, the protein expression levels in surrounding cells. Extrinsic factors drive Spatial heterogeneity often exhibited as macro-heterogeneity. Intrinsic heterogeneity can be detected even in a uniform environment and has been classified as macro-or micro-heterogeneity depending on the characteristics of the distribution. B. Macro-heterogeneity refers to variations in one or more cellular traits that results in discrete phenotypes or sub-populations of cells, and can be driven by both extrinsic and intrinsic factors. Micro-heterogeneity refers to random variations within a single phenotype that can include population ‘noise’ resulting from variations in regulatory networks, for example, or temporal ‘noise’ such as variation in protein synthesis over time. Highlighted in red are three important measurable components of the distribution of a cell feature.
Figure 3
Figure 3
Heterogeneity in populations of cells can be quantified by a variety of methods that permit cell-by-cell measurements. A. Single cell genomics, epigenomics, proteomics and metabolomics (reprinted with permission from Spagnolo et al.), and/or transcriptomics (from Saadatpour et al.) to study heterogeneity use either ground up tissue samples or single cells and can provide a comprehensive analysis of heterogeneity for a large number of cells. B. High Content Screening and Digital Pathology employs multiple fluorescent probes to capture a broad range of information including expression levels and subcellular localization of molecules within and across individual cells. C. Optical (from Hines et al.) and mass cytometry (from Spitzer and Nolan) can provide information on expression levels of several molecules simultaneously as well as some morphological information in large populations but do not report spatial heterogeneity. D. Mass Spectrometry readouts expand the range of molecules that can be simultaneously detected in flow cytometry (mass cytometry) and can be used to image tissues and cells in imaging Mass Cytometry (from Giesen et al.) and Imaging Mass Spectrometry (from Zavalin et al.).
Figure 4
Figure 4. A workflow for quantitation of heterogeneity
The quantitative analysis of biological heterogeneity requires assay validation and quality control similar to a screen, but with the addition of quality control methods and metrics for ensuring the reproducibility of the population distributions. After establishing the assay SOP (1), one approach is to establish a reference distribution while characterizing assay performance (2). The reference distribution is used throughout the project (3) to track the population distributions in the control wells. Once the consistency of the assay has been established, heterogeneity metrics can be applied to dissect the heterogeneity (4), and interactive analysis and visualization tools used to examine filtered or clustered distributions (5). Selected distributions can then be analyzed with various models and used to guide interpretations or drive the next experiments (6).
Figure 5
Figure 5
Visualization of patterns of heterogeneity in population samples. Patterns are described based on six general classes of heterogeneity on the horizontal axis. A. Depiction of the various types of heterogeneity among cells as they might appear in an image. B. Histograms with outliers depicted as individual points based on a standard box plot (“Histo-box plot”). C. Traditional histograms. D. “Violin plots”, essentially double sided histograms. E. A standard box plot.
Figure 6
Figure 6. The shape of a dose-response curve can be influenced by the underlying distributions of measurements at each dose
The distinctive transitions in the populations which may indicate different biological processes. A. Histo-box plots of Pyridone-6 inhibition of IL-6 activated STAT3 shows a gradual inhibition with increasing concentration indicating differential sensitivity of the cells. The mean (white bar) and median (black bar) are shown on the distributions. The negative control (red) and the positive control (green) are shown for reference. The green horizontal line is the 3 standard deviations above the mean of the positive control representing the cut-off between cells with and without activated STAT3. The blue arrow indicates the conventional IC50, while the red arrow indicates the concentration at which 50% of the cells are inhibited. B. Histo-box plots of the inhibition by Stattic shows a much steeper inhibition, indicating a more uniform population response, even though the cells at each dose show a variable sensitivity. C. Dose-response curves for Pyridone-6 inhibition calculated based on the population average (blue) or the percent of cells that were inhibited (red).
Fig. 7
Fig. 7. Canonical pointwise mutual information (PMI) maps depicting various forms of spatial ITH
A. Illustration of the heterogeneity in a tumor. B. Cartoon representation of 8 different cellular phenotypes based on high-dimensional biomarker intensity patterns acquired via pattern recognition algorithms C. A PMI map with strong diagonal entries and weak off-diagonal entries describes a globally heterogeneous but locally homogeneous tumor. In this example, the PMI map highlights locally homogeneous tumor microdomains containing cells of only one type each, phenotypes 2, 4, and 8 respectively. D. On the contrary, a PMI map with strong off-diagonal entries describes a tumor that is locally heterogeneous. In this example, locally heterogeneous tumor microdomains exist, as portrayed by the off-diagonal entries. One domain contains phenotypes 1 and 5, another contains phenotypes 2 and 4, and yet another containing phenotypes 3 and 8. E. PMI maps can also portray anti-associations (e.g., if phenotype 1 never occurs spatially near phenotype 3). The ensemble of associations and anti-associations of varying intensities along or off the diagonal represent the true complexity of tumor images in a format that can be summarized and interrogated. In this example, changing the distance threshold used in the PMI calculations have minor effects on the results. While Increasing the distance tends to promote positive associations and decreasing the distance tends to increase negative associations, the effects are not significant and the overall conclusions regarding the heterogeneity remain the same. Figures B–E reprinted with permission from Spagnolo et al.

References

    1. Huang S. Non-genetic heterogeneity of cells in development: more than just noise. Development. 2009;136:3853–3862. - PMC - PubMed
    1. Gingold JA, Coakley ES, Su J, et al. Distribution Analyzer, a methodology for identifying and clustering outlier conditions from single-cell distributions, and its application to a Nanog reporter RNAi screen. BMC Bioinformatics. 2015;16:225. - PMC - PubMed
    1. Krieger T, Simons BD. Dynamic stem cell heterogeneity. Development. 2015;142:1396–1406. - PubMed
    1. Gough AH, Chen N, Shun TY, et al. Identifying and Quantifying Heterogeneity in High Content Analysis: Application of Heterogeneity Indices to Drug Discovery. PLoS One. 2014;9:e102678. - PMC - PubMed
    1. Gough A, Lezon T, Faeder JR, et al. High-Content Analysis with Cellular and Tissue Systems Biology: a Bridge between Cancer Cell Biology and Tissue-Based Diagnostics. In: Mendelsohn J, Howley PM, Israel MA, et al., editors. The molecular basis of cancer. 4. Chapter 25. Saunders/Elsevier; Philadelphia, PA: 2015. pp. 369–392.

Publication types

MeSH terms