. 2017 Feb 23;12(2):e0172446.
doi: 10.1371/journal.pone.0172446. eCollection 2017.

Differential regulation of C5a receptor 1 in innate immune cells during the allergic asthma effector phase

Affiliations

Differential regulation of C5a receptor 1 in innate immune cells during the allergic asthma effector phase

Fanny Ender et al. PLoS One. .

Abstract

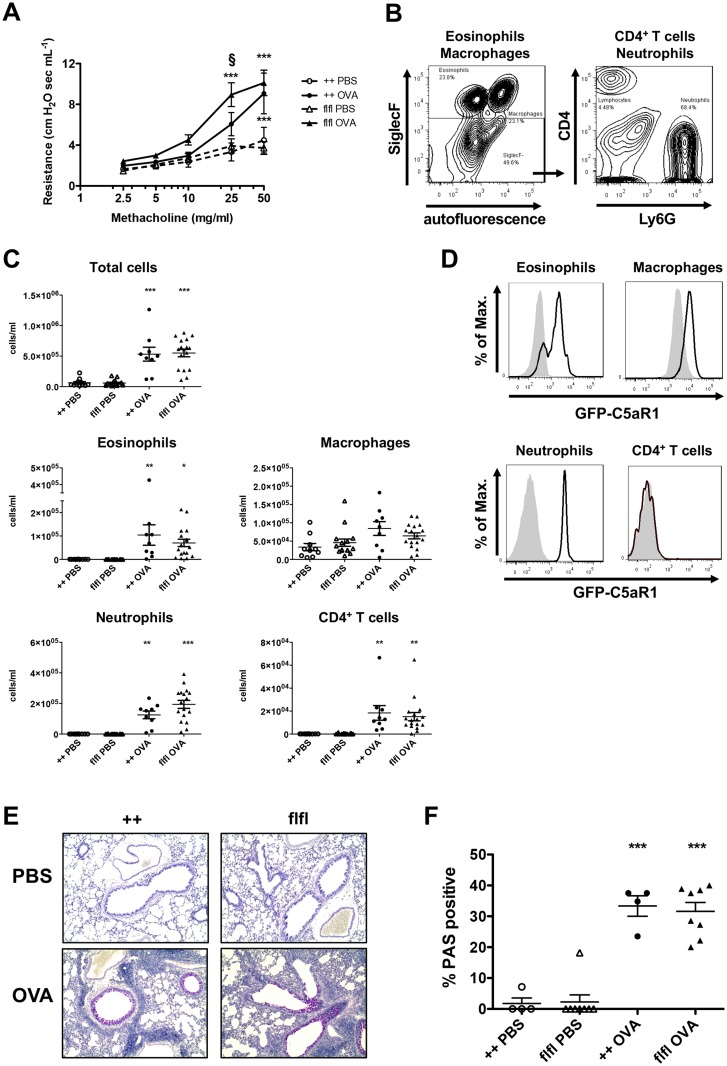
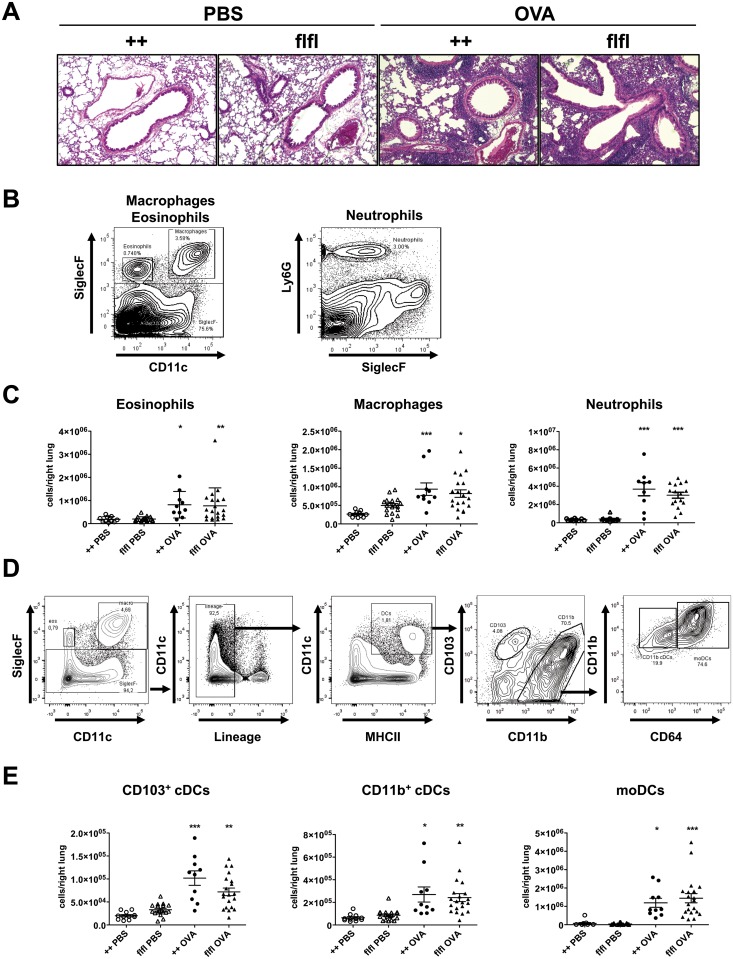
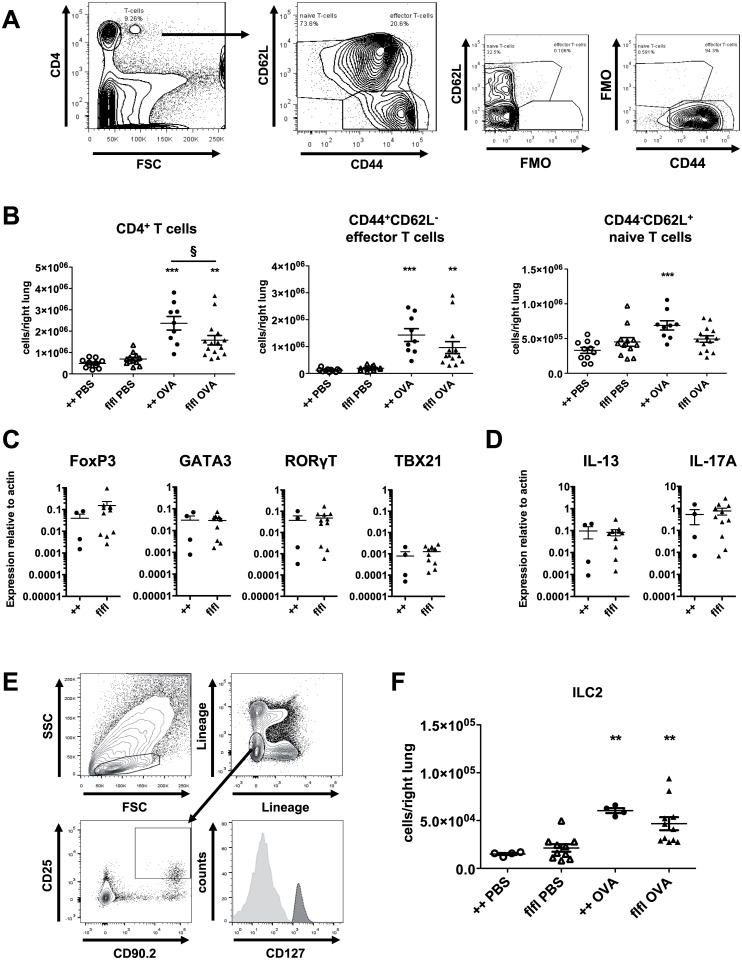
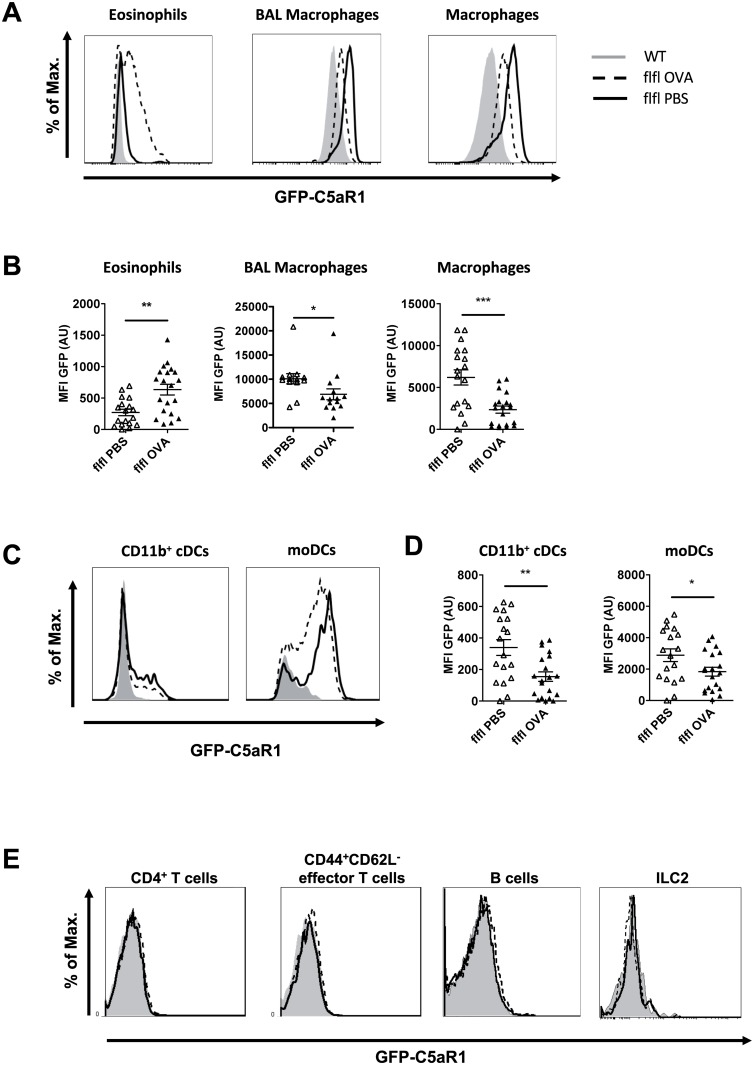
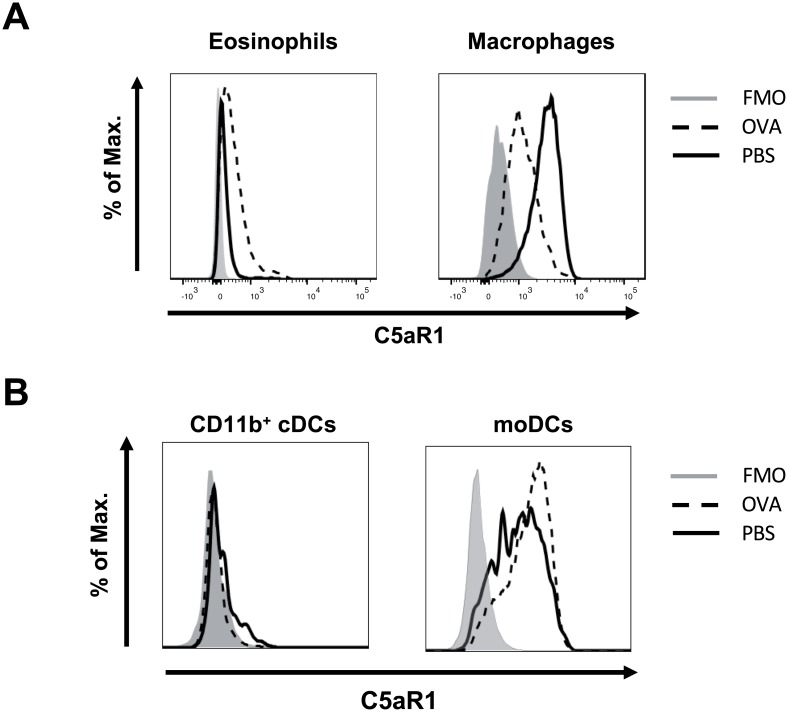
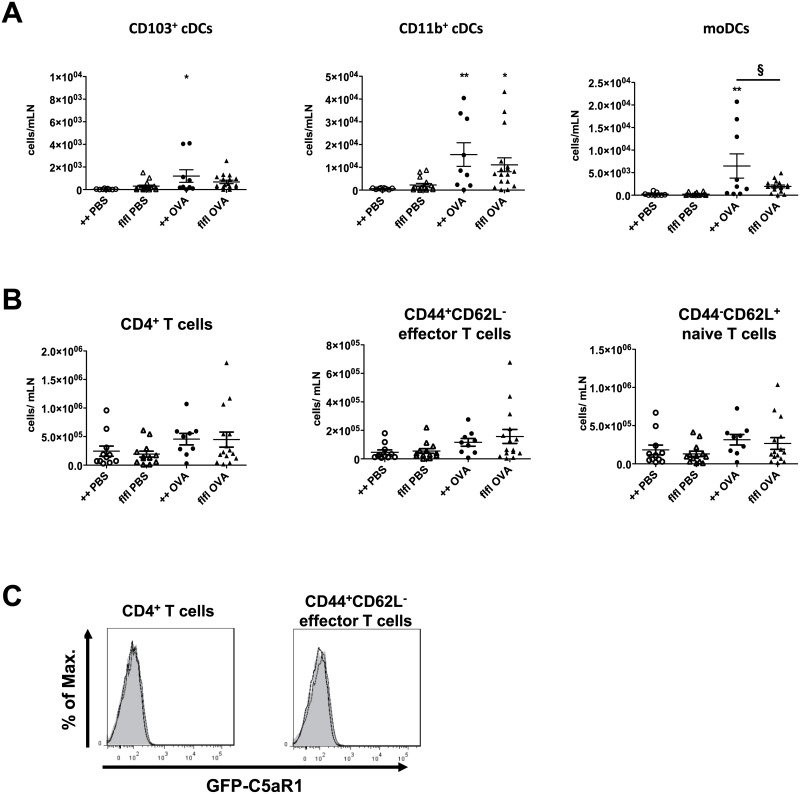
C5a drives airway constriction and inflammation during the effector phase of allergic asthma, mainly through the activation of C5a receptor 1 (C5aR1). Yet, C5aR1 expression on myeloid and lymphoid cells during the allergic effector phase is ill-defined. Recently, we generated and characterized a floxed green fluorescent protein (GFP)-C5aR1 knock-in mouse. Here, we used this reporter strain to monitor C5aR1 expression in airway, pulmonary and lymph node cells during the effector phase of OVA-driven allergic asthma. C5aR1 reporter and wildtype mice developed a similar allergic phenotype with comparable airway resistance, mucus production, eosinophilic/neutrophilic airway inflammation and Th2/Th17 cytokine production. During the allergic effector phase, C5aR1 expression increased in lung tissue eosinophils but decreased in airway and pulmonary macrophages as well as in pulmonary CD11b+ conventional dendritic cells (cDCs) and monocyte-derived DCs (moDCs). Surprisingly, expression in neutrophils was not affected. Of note, moDCs but not CD11b+ cDCs from mediastinal lymph nodes (mLN) expressed less C5aR1 than DCs residing in the lung after OVA challenge. Finally, neither CD103+ cDCs nor cells of the lymphoid lineage such as Th2 or Th17-differentiated CD4+ T cells, B cells or type 2 innate lymphoid cells (ILC2) expressed C5aR1 under allergic conditions. Our findings demonstrate a complex regulation pattern of C5aR1 in the airways, lung tissue and mLN of mice, suggesting that the C5a/C5aR1 axis controls airway constriction and inflammation through activation of myeloid cells in all three compartments in an experimental model of allergic asthma.


Conflict of interest statement

Competing Interests: The authors have declared that no competing interests exist.

Figures

Fig 1
Fig 1. WT and GFP-C5aR1flox/flox mice develop a similar allergic asthma phenotype.
(A) AHR in response to i.t. administration of methacholine measured as airway resistance. Shown are dose response curves in PBS-treated controls or OVA-immunized mice from WT (++) or GFP-C5aR1flox/flox (flfl) strains. Values shown are the mean ± SEM; n = 9–16 per group. (B) Gating strategy for the BAL fluid cell analysis. Cells were identified by flow cytometry using different markers to identify macrophages (SiglecF+autofluorescence+), eosinophils (SiglecF+autofluorescence-) neutrophils (SiglecF-Ly6G+CD4-), and T cells (SiglecF-Ly6G-CD4+). (C) Total and differential cell counts in BAL fluid of PBS-treated or OVA-immunized WT or GFP-C5aR1flox/flox animals. Values shown are the mean ± SEM; n = 9–17 per group. (D) GFP/C5aR1 expression in eosinophils, macrophages, neutrophils and CD4+ T cells from BAL fluid of GFP-C5aR1 reporter mice in response to OVA; grey histogram: WT controls. (E) Histological examination of mucus production in the airways of PBS-treated or OVA-immunized WT or GFP-C5aR1flox/flox animals. Sections were stained with PAS for mucus production (original magnification x 200). (F) Frequency of PAS-positive bronchi in PBS-treated or OVA-immunized WT or GFP-C5aR1flox/flox animals. Mucus producing airways are plotted relative to all analysed airways. Values shown are the mean ± SEM; n = 4–8 per group. * indicates significant differences between the PBS and OVA treatment groups; § indicates significant differences between OVA-treated WT and GFP-C5aR1flox/flox mice. * or § p < 0.05, ** p < 0.01, *** p <0.001.
Fig 2
Fig 2. WT and GFP-C5aR1flox/flox mice show a strong and similar pulmonary recruitment of inflammatory cells during the allergic effector phase.
(A) Histological examination of airway inflammation. Sections were stained with H&E (original magnification x 200). The pictures are representative of 5 histological sections per treatment group. (B) Gating strategies used to identify eosinophils (SiglecF+CD11c-), macrophages (SiglecF+CD11c+) or neutrophils (Ly6G+SiglecF-) in lung tissue. (C) Differential cell counts of PBS-treated or OVA-immunized WT or GFP-C5aR1flox/flox animals. Values shown are the mean ± SEM; n = 9–17 per group. (D) Gating strategy to identify DC subsets in lung tissue. Data shown represent the pulmonary cell composition of OVA-treated mice. Cells were first gated on SiglecF- cells. Then lineage negative cells were excluded. Subsequently DCs were identified as CD11c+MHCII+ cells. These cells were further subdivided into CD103+CD11b or CD103CD11b+cDCs. Within the latter population, we identified CD11b+CD64- cDCs and CD11b+CD64+moDCs. (E) DC counts in lung cell suspensions of PBS-treated or OVA-immunized WT or GFP-C5aR1flox/flox animals. Values shown are the mean ± SEM; n = 7–18 per group. * indicates significant differences between PBS or OVA-treated groups. * p < 0.05, ** p < 0.01, *** p <0.001.
Fig 3
Fig 3. CD4+ T cell and ILC2 accumulation as well as CD4+ T cell differentiation in WT and GFP-C5aR1flox/flox mice in the allergic effector phase.
(A) Gating strategy to identify CD4+ T cells. T cells were subdivided into naive (CD44-CD62L+) and effector (CD44-CD62L+) T cells. (B) Recruitment of different T cell populations into the lungs of PBS-treated or OVA-immunized WT or GFP-C5aR1flox/flox animals. Values shown are the mean ± SEM; n = 9–15 per group. (C) Expression of FoxP3 (Tregs), GATA3 (Th2), RORγT (Th17), and TBX21 (Th1) transcripts in sorted CD44+CD62L- T cells. The abundance of transcripts was evaluated after reverse transcription by real-time PCR. Values shown are the mean abundance of target mRNA as compared to actin analyzed by Mann-Whitney test (n = 4–11). (D) Comparison of IL-13 and IL-17A mRNA expression levels in WT and GFP-C5aR1flox/flox mice in sorted CD44+CD62L- T cells as determined by real-time PCR. Values shown are the mean abundance of target mRNA as compared to actin analyzed by Mann-Whitney test (n = 4–11). (E) Gating strategy used to identify ILC2 in lung tissue (Lin-CD25+CD90.2+CD127+). (F) ILC2 cell numbers in lung tissue of PBS-treated or OVA-immunized WT or GFP-C5aR1flox/flox animals. Values shown are the mean ± SEM; n = 4–11 per group. * indicates significant differences between PBS or OVA-treated groups; § indicates significant differences between WT and GFP-C5aR1flox/flox OVA-treated groups. § p < 0.05, ** p < 0.01, *** p <0.001.
Fig 4
Fig 4. GFP-C5aR1 expression in innate and adaptive immune cells recruited into the lungs in response to OVA challenge.
(A) Histograms showing the expression levels of GFP, used as surrogate marker for C5aR1 expression, in lung eosinophils, BAL-derived alveolar and lung macrophages in PBS-treated or OVA-challenged WT and GFP-C5aR1flox/flox animals. (B) The corresponding graphs show the relative mean fluorescence intensity (MFI) of the GFP signal in the indicated cell types. Values shown are the mean ± SEM; n = 8–18 per group. (C) Histograms showing the expression levels of GFP in CD11b+ cDCs and moDCs in PBS-treated or OVA-challenged WT or GFP-C5aR1flox/flox animals. (D) The corresponding graphs show the mean fluorescence intensity (MFI) of the GFP signal in the indicated cell types. Values shown are the mean ± SEM; n = 13–16 per group. (E) Histograms showing the expression levels of GFP in lung CD4+ T cells, CD44+CD62L- effector T cells, CD19+B220+ B cells and ILC2. Histograms are representative of 8–11 animals per group. Grey histogram: GFP signal of WT cells; solid line: GFP signal in cells from PBS-treated GFP-C5aR1flox/flox mice; dashed line: GFP signal in cells from OVA-immunized GFP-C5aR1flox/flox mice.
Fig 5
Fig 5. C5aR1 surface expression in innate and adaptive immune cells recruited into the lungs in response to OVA challenge.
(A) Histograms showing the surface expression levels of C5aR1 in lung eosinophils, and lung macrophages in PBS-treated or OVA-challenged GFP-C5aR1flox/flox animals using C5aR1-specific mAb 20/70. (B) Histograms showing the expression levels of GFP in CD11b+ cDCs and moDC of PBS-treated or OVA-challenged GFP-C5aR1flox/flox animals. The histograms are representative of three independent experiments.
Fig 6
Fig 6. DC and CD4+ T cell accumulation and their C5aR1 expression in mLN of WT and GFP-C5aR1flox/flox mice in the allergic effector phase.
(A) Cell counts of cDC and moDC subsets in mLN of WT or GFP-C5aR1flox/flox mice in response to PBS treatment or OVA immunization; n = 7–15 per group. CD11b+ cDC data were analyzed by ANOVA on ranks (n = 7–15). (B) Counts of different CD4+ T cell subsets in mLN of PBS-treated or OVA-challenged WT or GFP-C5aR1flox/flox animals. Values shown are the mean ± SEM; n = 7–15 per group. * indicates significant differences between PBS and OVA treatment groups; § indicates significant differences between WT and GFP-C5aR1flox/flox OVA-treated groups. * or § p < 0.05; ** p < 0.001. (C) GFP signal in CD4+ or CD4+CD44+CD62L- effector T cells from OVA-challenged WT (grey histogram) or GFP-C5aR1flox/flox animals (black line).

Similar articles

Cited by

References

    1. Alfven T, Braun-Fahrlander C, Brunekreef B, von Mutius E, Riedler J, Scheynius A, et al. Allergic diseases and atopic sensitization in children related to farming and anthroposophic lifestyle—the PARSIFAL study. Allergy. 2006;61:414–421. 10.1111/j.1398-9995.2005.00939.x - DOI - PubMed
    1. Maruo K, Akaike T, Ono T, Okamoto T, Maeda H. Generation of anaphylatoxins through proteolytic processing of C3 and C5 by house dust mite protease. J Allergy Clin Immunol. 1997;100:253–260. - PubMed
    1. Kohl J, Baelder R, Lewkowich IP, Pandey MK, Hawlisch H, Wang L, et al. A regulatory role for the C5a anaphylatoxin in type 2 immunity in asthma. J Clin Invest. 2006;116:783–796. 10.1172/JCI26582 - DOI - PMC - PubMed
    1. Krug N, Tschernig T, Erpenbeck VJ, Hohlfeld JM, Kohl J. Complement factors C3a and C5a are increased in bronchoalveolar lavage fluid after segmental allergen provocation in subjects with asthma. Am J Respir Crit Care Med. 2001;164:1841–1843. 10.1164/ajrccm.164.10.2010096 - DOI - PubMed
    1. Schmudde I, Laumonnier Y, Kohl J. Anaphylatoxins coordinate innate and adaptive immune responses in allergic asthma. Semin Immunol. 2013;25:2–11. 10.1016/j.smim.2013.04.009 - DOI - PubMed

MeSH terms