. 2017 Feb 23;13(2):e1006184.
doi: 10.1371/journal.ppat.1006184. eCollection 2017 Feb.

Analysis of the T Cell Response to Zika Virus and Identification of a Novel CD8+ T Cell Epitope in Immunocompetent Mice

Affiliations

Analysis of the T Cell Response to Zika Virus and Identification of a Novel CD8+ T Cell Epitope in Immunocompetent Mice

Ryan D Pardy et al. PLoS Pathog. .

Abstract

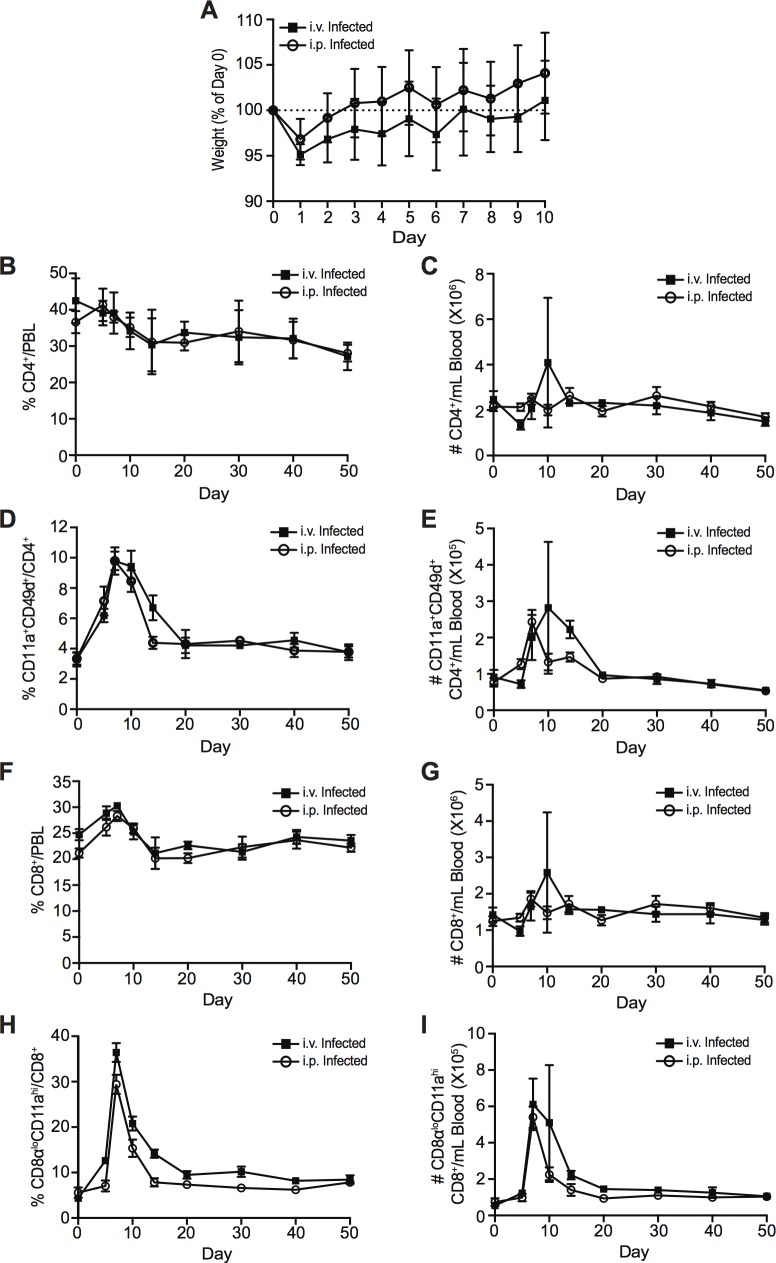
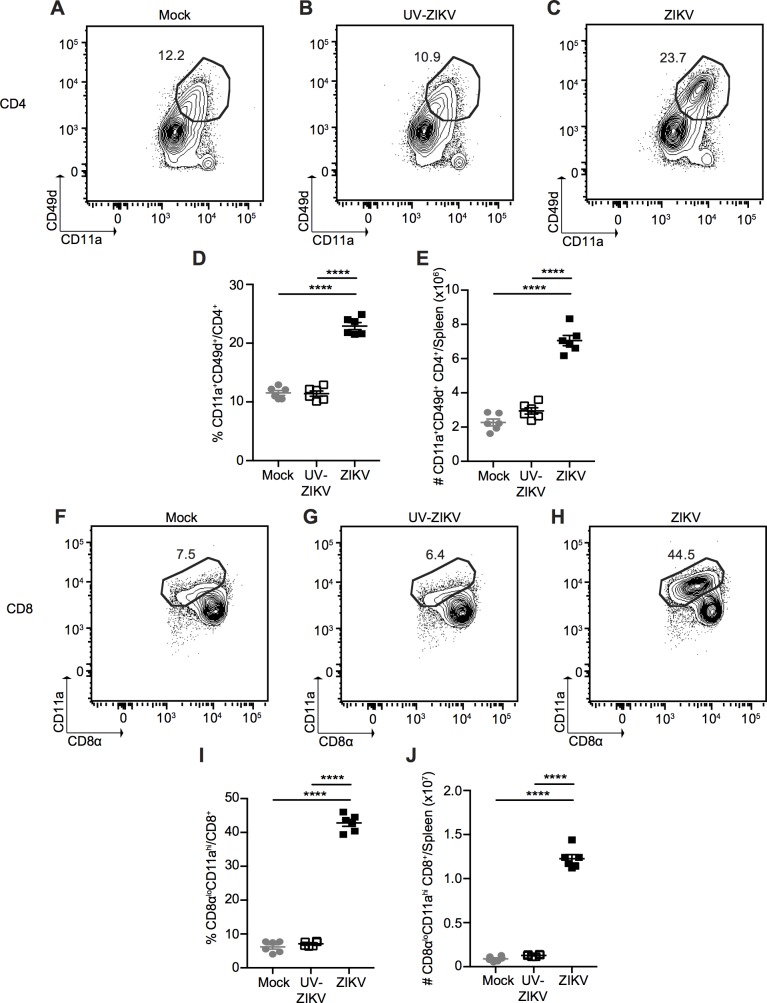
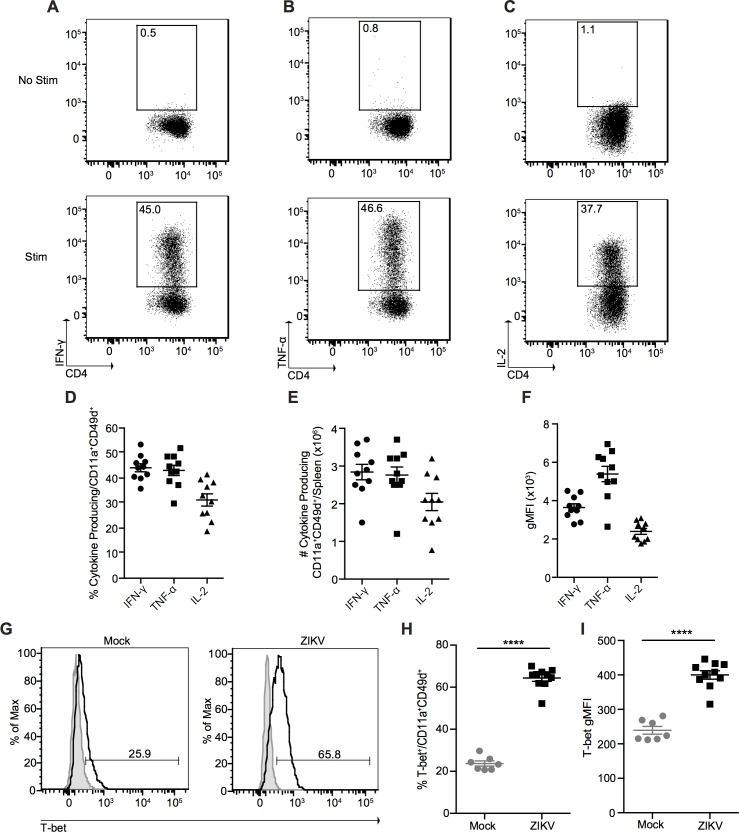
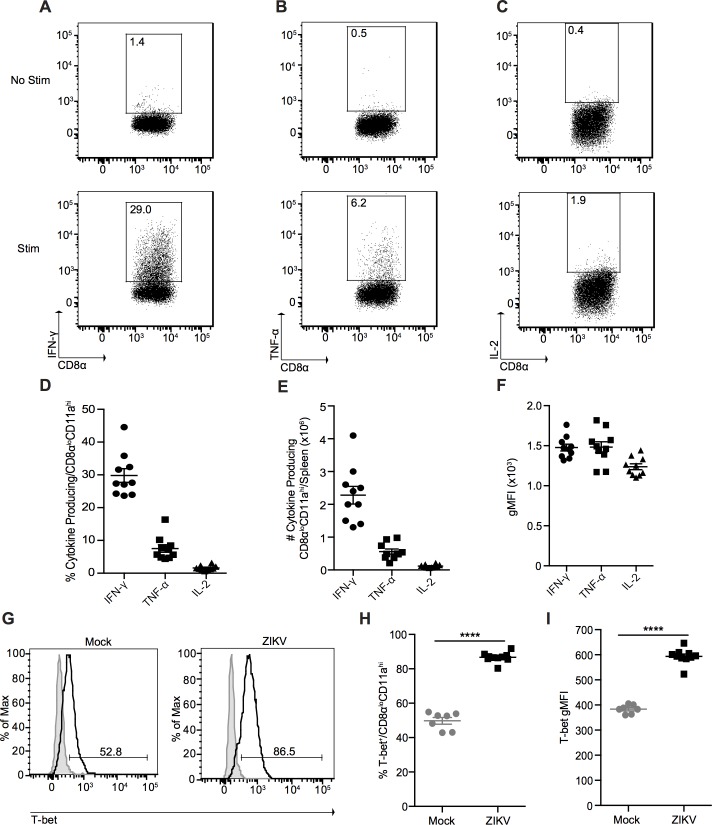
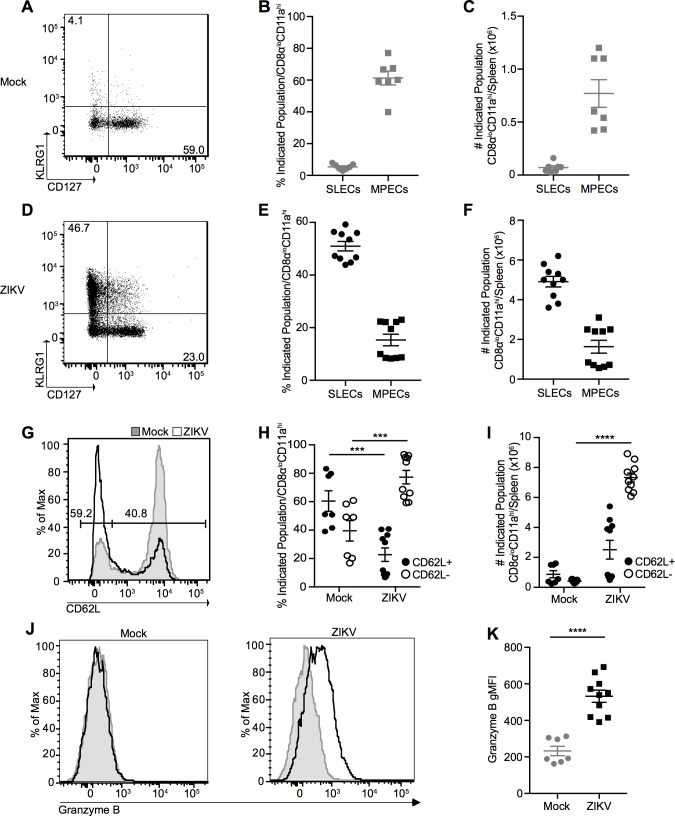
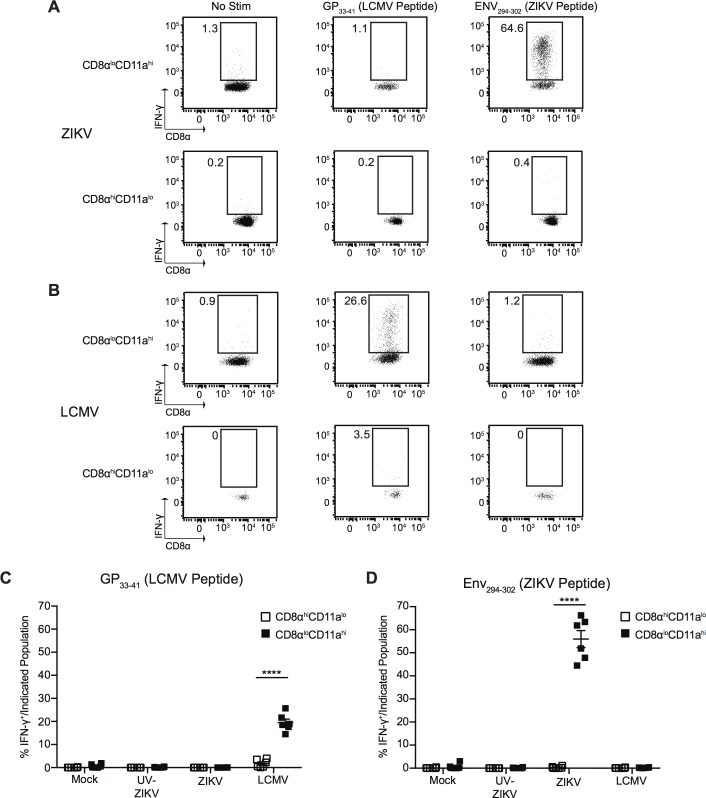
Zika virus (ZIKV) is an emerging arbovirus of the Flaviviridae family. Although ZIKV infection is typically mild and self-limiting in healthy adults, infection has been associated with neurological symptoms such as Guillain-Barré syndrome, and a causal link has been established between fetal microcephaly and ZIKV infection during pregnancy. These risks, and the magnitude of the ongoing ZIKV pandemic, have created an urgent need for the development of animal models to study the immune response to ZIKV infection. Previous animal models have primarily focused on pathogenesis in immunocompromised mice. In this study, we provide a model of ZIKV infection in wild-type immunocompetent C57BL/6 mice, and have provided an analysis of the immune response to infection. We evaluated the activation of several innate immune cell types, and studied the kinetics, phenotype, and functionality of T cell responses to ZIKV infection. Our results demonstrate that ZIKV infection is mild in wild-type immunocompetent C57BL/6 mice, resulting in minimal morbidity. Our data establish that at the peak of the adaptive response, antigen-experienced CD4+ T cells polarize to a Th1 phenotype, and antigen-experienced CD8+ T cells exhibit an activated effector phenotype, producing both effector cytokines and cytolytic molecules. Furthermore, we have identified a novel ZIKV CD8+ T cell epitope in the envelope protein that is recognized by the majority of responding cells. Our model provides an important reference point that will help dissect the impact of polymorphisms in the circulating ZIKV strains on the immune response and ZIKV pathogenesis. In addition, the identification of a ZIKV epitope will allow for the design of tetramers to study epitope-specific T cell responses, and will have important implications for the design and development of ZIKV vaccine strategies.


Conflict of interest statement

The authors have declared that no competing interests exist.

Figures

Fig 1
Fig 1. Kinetics of the T cell response following i.v. or i.p. ZIKV infection.
(A) Weights of i.v.- and i.p.-infected mice presented as a percentage of day 0 weight. Percentage and number of total CD4+ T cells (B-C), CD11a+CD49d+ antigen-experienced CD4+ T cells (D-E), total CD8+ T cells (F-G), and CD8αloCD11ahi antigen-experienced CD8+ T cells (H-I) at baseline (day 0) and on indicated dpi in the peripheral blood of C57BL/6 mice infected i.p. (open circles) or i.v. (closed squares) with 106 PFU of ZIKV. Error bars represent mean ± SEM. Data has been pooled from two independent experiments, n = 3–4 mice per group per experiment.
Fig 2
Fig 2. ZIKV infection kinetics.
(A) Viral RNA was quantified in the spleens of C57BL/6 mice infected i.v. with 106 PFU of ZIKV at 6, 12, 24, 48 and 72 h post-infection using qRT-PCR analysis. (B) Viral RNA was quantified in the spleens of C57BL/6 mice infected i.v. with 106 PFU of ZIKV or an equivalent dose of UV-inactivated virus at 12 h post-infection using qRT-PCR analysis. Data are presented as plaque forming unit (PFU) equivalents per gram of tissue after normalization to a standard curve (S2 Fig). The dotted line indicates limit of detection based on the average number of PFU equivalents per gram of tissue from the spleens of mock-infected mice at 48 h post-infection (A) or 12 h post-infection (B). Error bars represent mean ± SEM. Data are pooled from two independent experiments, n = 3 mice per group per experiment.
Fig 3
Fig 3. ZIKV induces innate immune cell activation.
Representative histograms and geometric mean fluorescence intensity (gMFI) of CD40 (A-B), CD80 (C-D), and CD86 (E-F) on splenic dendritic cells (DCs) at 2 dpi with 106 PFU of ZIKV i.v. (open histograms with solid line), an equivalent dose of UV-inactivated ZIKV (open histograms with dashed line) or mock infection (shaded histograms). Histograms represent DCs gated as CD3- CD19- NK1.1- MHC-II+ CD11c+ cells. Representative histogram (G), percentage (H), and number (I) of CD69+ NK1.1+CD3- natural killer cells from the spleens of ZIKV- (open histogram with solid line), UV-inactivated ZIKV- (open histogram with dashed line) and mock-infected (shaded histogram) mice 2 dpi. Number on histogram indicates percentage of CD69+ cells from ZIKV-infected mouse. (J) Mice were infected with 106 PFU of ZIKV or an equivalent dose of UV-inactivated virus, spleens were harvested 12 h post-infection and total RNA was extracted. IFN-α and IFN-β mRNA expression was assessed by qRT-PCR, normalized to TATA-binding protein mRNA expression, and expressed as fold change over mRNA expression in mock-infected mice. Error bars represent mean ± SEM. Data in (A-I) are pooled from two independent experiments, n = 3 mice per group per experiment. Data in (J) are pooled from three independent experiments, n = 3 mice per group per experiment. Data in (B, D, F, H and I) were analyzed by one-way ANOVA with Tukey’s post-test of multiple comparisons. ****p<0.0001.
Fig 4
Fig 4. ZIKV induces CD4+ and CD8+ T cell activation at the peak of the T cell response.
Representative plots of CD11a+CD49d+ antigen-experienced CD4+ T cells from spleens of mock- (A), UV-inactivated ZIKV- (B) and ZIKV-infected (C) mice 7 dpi. Percentage (D) and number (E) of CD11a+CD49d+ antigen-experienced CD4+ T cells from spleens of mock-, UV-inactivated ZIKV- and ZIKV-infected mice 7 dpi. Representative plots of CD8αloCD11ahi antigen-experienced CD8+ T cells from the spleens of mock- (F), UV-inactivated ZIKV- (G) and ZIKV-infected (H) mice 7 dpi. Percentage (I) and number (J) of CD8αloCD11ahi antigen-experienced CD8+ T cells from the spleens of mock-, UV-inactivated ZIKV- and ZIKV-infected mice 7 dpi. Error bars represent mean ± SEM. Data are pooled from two independent experiments, n = 3 mice per group per experiment. Data in (D, E, I and J) were analyzed by one-way ANOVA with Tukey’s post-test of multiple comparisons. ****p<0.0001.
Fig 5
Fig 5. ZIKV infection induces a Th1 CD4+ T cell response.
Representative plots of IFN-γ (A), TNF-α (B), and IL-2 (C) production from splenic CD11a+CD49d+ CD4+ T cells from ZIKV-infected mice 7 dpi. Total splenocytes were incubated in media alone in the presence of Brefeldin A (top) or stimulated with PMA and ionomycin in the presence of Brefeldin A for 3 h at 37°C (bottom). Percentage (D), number (E), and gMFI (F) of cytokine-producing CD11a+CD49d+ CD4+ T cells from the spleens of ZIKV-infected mice 7 dpi. (G) Representative histograms of T-bet expression in splenic CD11a+CD49d+ CD4+ T cells from mock- and ZIKV-infected mice 7 dpi. Shaded histograms represent isotype control. Percentage (H) and gMFI (I) of T-bet expression in splenic CD11a+CD49d+ CD4+ T cells from mock- and ZIKV-infected mice 7 dpi. Error bars represent mean ± SEM. Data are pooled from two independent experiments, n = 3–5 mice per group per experiment. Data in (H and I) were analyzed with a two-tailed, unpaired Student’s t test. ****p<0.0001.
Fig 6
Fig 6. ZIKV infection induces a prototypical effector CD8+ T cell response in immunocompetent mice.
Representative plots of IFN-γ (A), TNF-α (B), and IL-2 (C) production from splenic CD8αloCD11ahi CD8+ T cells from ZIKV-infected mice 7 dpi. Total splenocytes were incubated in media alone in the presence of Brefeldin A (top) or stimulated with PMA and ionomycin in the presence of Brefeldin A for 3 h at 37°C (bottom). Percentage (D), number (E), and gMFI (F) of cytokine-producing CD8αloCD11ahi CD8+ T cells from the spleens of ZIKV-infected mice 7 dpi. (G) Representative histograms of T-bet expression in splenic CD8αloCD11ahi CD8+ T cells from mock- and ZIKV-infected mice 7 dpi. Shaded histograms represent isotype control. Percentage (H) and gMFI (I) of T-bet expression in splenic CD8αloCD11ahi CD8+ T cells from mock- and ZIKV-infected mice 7 dpi. Error bars represent mean ± SEM. Data are pooled from two independent experiments, n = 3–5 mice per group per experiment. Data in (H and I) were analyzed with a two-tailed, unpaired Student’s t test. ****p<0.0001.
Fig 7
Fig 7. Antigen-experienced CD8+ T cells present with an activated phenotype at the peak of the T cell response.
(A) Representative plot of CD127 and KLRG1 expression on CD8αloCD11ahi CD8+ T cells from spleens of mock-infected mice 7 dpi. Percent (B) and number (C) of CD127loKLRG1hi short-lived effector cells (SLECs) and CD127hiKLRG1lo memory precursor effector cells (MPECs) on CD8αloCD11ahi CD8+ T cells from mock-infected mice. (D) Representative plot of CD127 and KLRG1 expression on CD8αloCD11ahi CD8+ T cells from spleens of ZIKV-infected mice 7 dpi. Percent (E) and number (F) of SLECs and MPECs on CD8αloCD11ahi CD8+ T cells from ZIKV-infected mice. Representative histogram (G), percentage (H), and number (I) of CD62L+ and CD62L- CD8αloCD11ahi CD8+ T cells from spleens of mock- (shaded histogram) and ZIKV-infected (open histogram) mice 7 dpi. Numbers on histogram indicate percentage of CD62L- (left gate) and CD62L+ (right gate) cells from ZIKV-infected sample. (J) Representative histograms of granzyme B expression in CD8αloCD11ahi CD8+ T cells from spleens of mock- (left) and ZIKV-infected (right) mice 7 dpi. Shaded histograms represent isotype control. (K) gMFI of granzyme B expression. Error bars represent mean ± SEM. Data are pooled from two independent experiments, n = 3–5 mice per group per experiment. Data in (H, I and K) were analyzed with a two-tailed, unpaired Student’s t test. ***p<0.0005; ****p<0.0001.
Fig 8
Fig 8. CD8+ T cells respond to an epitope within the ZIKV Envelope protein.
(A) Representative plots of IFN-γ production from antigen-experienced CD8αloCD11ahi CD8+ T cells (top row) and naïve CD8αhiCD11alo CD8+ T cells (bottom row) from the spleens of ZIKV-infected mice 7 dpi. Total splenocytes were incubated for 5.5 h at 37°C with media alone or 200nM of the indicated peptide in the presence of Brefeldin A. (B) Representative plots of IFN-γ production from antigen-experienced CD8αloCD11ahi CD8+ T cells (top row) and naïve CD8αhiCD11alo CD8+ T cells (bottom row) from the spleens LCMV-infected mice 7 dpi. Total splenocytes were incubated for 5.5 h at 37°C with media alone or 200nM of the indicated peptide in the presence of Brefeldin A. (C-D) Percentage of IFN-γ+ antigen-experienced CD8αloCD11ahi or naïve CD8αhiCD11alo CD8+ T cells from mock-, UV-inactivated ZIKV-, ZIKV- or LCMV-infected mice 7 dpi after restimulation with media alone or 200nM of GP33-41 (LCMV peptide) (C) or Env294-302 (ZIKV peptide) (D) for 5.5 h at 37°C in the presence of Brefeldin A. Error bars represent mean ± SEM. Data are pooled from two independent experiments, n = 3 mice per group per experiment. Data in (C and D) were analyzed with a two-tailed, paired Student’s t test. ****p<0.0001.

Similar articles

Cited by

References

    1. Dick GW, Kitchen SF, Haddow AJ. Zika virus. I. Isolations and serological specificity. Trans R Soc Trop Med Hyg. 1952;46(5):509–20. - PubMed
    1. Dick GW. Zika virus. II. Pathogenicity and physical properties. Trans R Soc Trop Med Hyg. 1952;46(5):521–34. - PubMed
    1. Simpson DI. Zika Virus Infection in Man. Trans R Soc Trop Med Hyg. 1964;58:335–8. - PubMed
    1. Chang C, Ortiz K, Ansari A, Gershwin ME. The Zika outbreak of the 21st century. J Autoimmun. 2016;68:1–13. 10.1016/j.jaut.2016.02.006 - DOI - PMC - PubMed
    1. Rajah MM, Pardy RD, Condotta SA, Richer MJ, Sagan SM. Zika Virus: Emergence, Phylogenetics, Challenges and Opportunities. ACS Infect Dis. 2016. 10.1021/acsinfecdis.6b00161 . - DOI - PubMed

Publication types

Substances