

Genes encoding two Theileria parva antigens recognized by CD8+ T-cells exhibit sequence diversity in South Sudanese cattle populations but the majority of alleles are similar to the Muguga component of the live vaccine cocktail
- PMID: 28231338
- PMCID: PMC5322890
- DOI: 10.1371/journal.pone.0171426
Genes encoding two Theileria parva antigens recognized by CD8+ T-cells exhibit sequence diversity in South Sudanese cattle populations but the majority of alleles are similar to the Muguga component of the live vaccine cocktail
Abstract
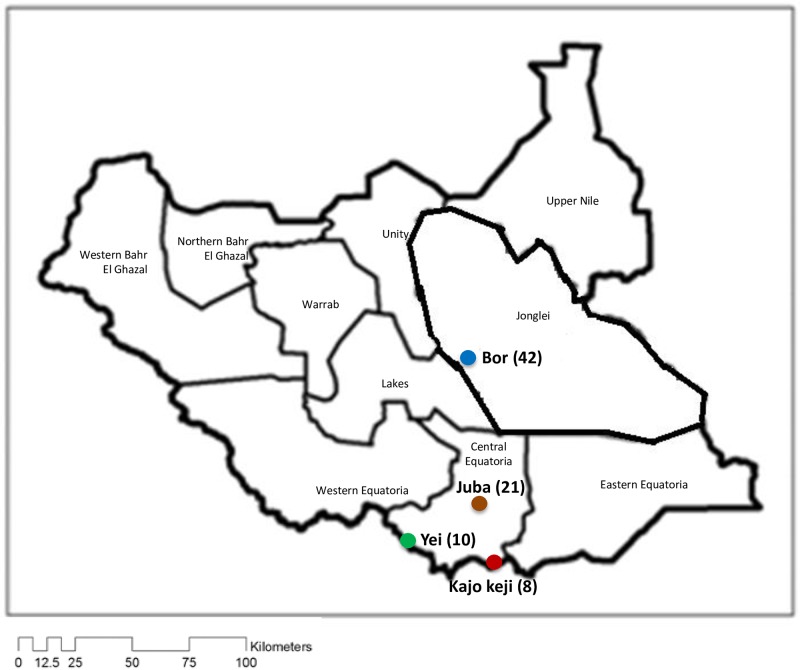
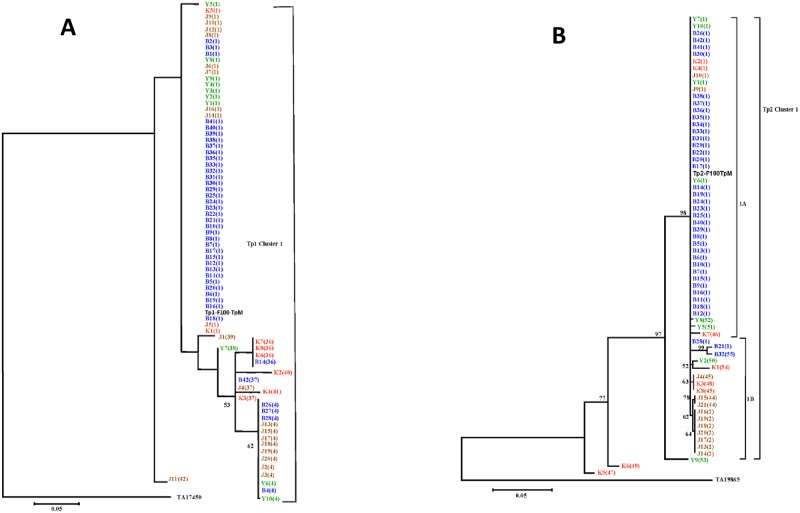
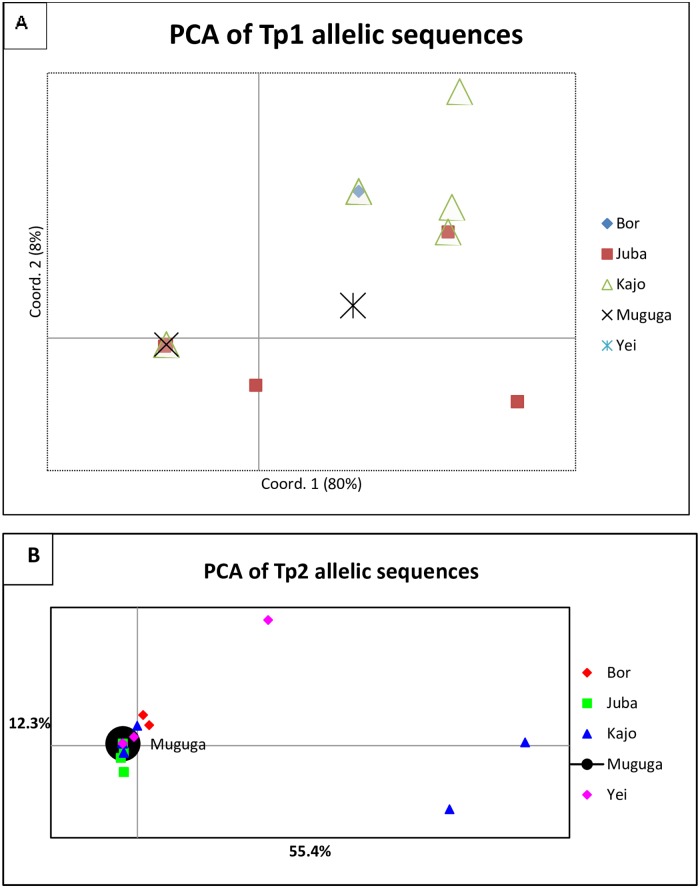
East Coast fever (ECF), caused by Theileria parva infection, is a frequently fatal disease of cattle in eastern, central and southern Africa, and an emerging disease in South Sudan. Immunization using the infection and treatment method (ITM) is increasingly being used for control in countries affected by ECF, but not yet in South Sudan. It has been reported that CD8+ T-cell lymphocytes specific for parasitized cells play a central role in the immunity induced by ITM and a number of T. parva antigens recognized by parasite-specific CD8+ T-cells have been identified. In this study we determined the sequence diversity among two of these antigens, Tp1 and Tp2, which are under evaluation as candidates for inclusion in a sub-unit vaccine. T. parva samples (n = 81) obtained from cattle in four geographical regions of South Sudan were studied for sequence polymorphism in partial sequences of the Tp1 and Tp2 genes. Eight positions (1.97%) in Tp1 and 78 positions (15.48%) in Tp2 were shown to be polymorphic, giving rise to four and 14 antigen variants in Tp1 and Tp2, respectively. The overall nucleotide diversity in the Tp1 and Tp2 genes was π = 1.65% and π = 4.76%, respectively. The parasites were sampled from regions approximately 300 km apart, but there was limited evidence for genetic differentiation between populations. Analyses of the sequences revealed limited numbers of amino acid polymorphisms both overall and in residues within the mapped CD8+ T-cell epitopes. Although novel epitopes were identified in the samples from South Sudan, a large number of the samples harboured several epitopes in both antigens that were similar to those in the T. parva Muguga reference stock, which is a key component in the widely used live vaccine cocktail.
Conflict of interest statement
Figures

Similar articles
-
Sequence diversity of cytotoxic T cell antigens and satellite marker analysis of Theileria parva informs the immunization against East Coast fever in Rwanda.Parasit Vectors. 2020 Sep 7;13(1):452. doi: 10.1186/s13071-020-04322-9. Parasit Vectors. 2020. PMID: 32894166 Free PMC article.
-
Diversity of two Theileria parva CD8+ antigens in cattle and buffalo-derived parasites in Tanzania.Ticks Tick Borne Dis. 2019 Aug;10(5):1003-1017. doi: 10.1016/j.ttbdis.2019.05.007. Epub 2019 May 22. Ticks Tick Borne Dis. 2019. PMID: 31151920
-
Antigen gene and variable number tandem repeat (VNTR) diversity in Theileria parva parasites from Ankole cattle in south-western Uganda: Evidence for conservation in antigen gene sequences combined with extensive polymorphism at VNTR loci.Transbound Emerg Dis. 2020 Mar;67 Suppl 1:99-107. doi: 10.1111/tbed.13311. Transbound Emerg Dis. 2020. PMID: 32174038
-
A review of recent research on Theileria parva: Implications for the infection and treatment vaccination method for control of East Coast fever.Transbound Emerg Dis. 2020 Mar;67 Suppl 1:56-67. doi: 10.1111/tbed.13325. Transbound Emerg Dis. 2020. PMID: 32174044 Review.
-
Understanding the basis of parasite strain-restricted immunity to Theileria parva.Annu Rev Anim Biosci. 2015;3:397-418. doi: 10.1146/annurev-animal-022513-114152. Epub 2014 Nov 12. Annu Rev Anim Biosci. 2015. PMID: 25422856 Review.
Cited by
-
Geospatial and modelling analyses reveal diverse tick and tick-associated microbes in the East African Community.Infect Dis Poverty. 2025 May 22;14(1):39. doi: 10.1186/s40249-025-01310-y. Infect Dis Poverty. 2025. PMID: 40405314 Free PMC article. Review.
-
Sequence Diversity of Tp1 and Tp2 Antigens and Population Genetic Analysis of Theileria parva in Unvaccinated Cattle in Zambia's Chongwe and Chisamba Districts.Pathogens. 2022 Jan 19;11(2):114. doi: 10.3390/pathogens11020114. Pathogens. 2022. PMID: 35215058 Free PMC article.
-
Sequence diversity of cytotoxic T cell antigens and satellite marker analysis of Theileria parva informs the immunization against East Coast fever in Rwanda.Parasit Vectors. 2020 Sep 7;13(1):452. doi: 10.1186/s13071-020-04322-9. Parasit Vectors. 2020. PMID: 32894166 Free PMC article.
-
Genetic and antigenic variation of the bovine tick-borne pathogen Theileria parva in the Great Lakes region of Central Africa.Parasit Vectors. 2019 Dec 16;12(1):588. doi: 10.1186/s13071-019-3848-2. Parasit Vectors. 2019. PMID: 31842995 Free PMC article.
-
Genetic Diversity and Sequence Polymorphism of Two Genes Encoding Theileria parva Antigens Recognized by CD8+ T Cells among Vaccinated and Unvaccinated Cattle in Malawi.Pathogens. 2020 Apr 30;9(5):334. doi: 10.3390/pathogens9050334. Pathogens. 2020. PMID: 32365795 Free PMC article.
References
-
- Anonymous (1983) Tick and tick-borne disease control. The Sudan: studies on important tick-borne diseases of cattle. Final report, AG: CP/SUD/024/DEN, Rome.
-
- Marcellino WL, Salih DA, Jull II, El Hussein AM (2011) Economic impact of East Coast fever in central equatorial state of south Sudan. Int Res J Agric Sci Soil Sci 1: 218–220.
-
- Julla II (1994) Studies on the epidemiology of theileriosis in Equatorial Region of the Sudan with emphasis on East Coast fever. PhD thesis, University of Khartoum, Sudan, p115.
-
- Hoogstraal H (1956) African Ixodoidea. I. Ticks of the Sudan (with specialreference to Equatoria Province and with preliminary reviews of thegeneraBoophilus, Margaropus, and Hyalomma). Department of Navy, Bureau of medicine and surgery; Washington, D.C., U.S.A: p1101.
-
- Morzaria SP, Tatchell RJ, Minor R, Pederson V, Julla II, Rahim A, et al. (1981) Preliminary studies on theepidemiology of theileriosis in Eastern Equatoria Province of theSudan In: Irvin AD, Cunningham MP, Young AS (eds) Advances inthe control of Theileriosis. Martinus Njihoff, The Hague, pp 83–85.
MeSH terms
Substances
LinkOut - more resources
Full Text Sources
Other Literature Sources
Research Materials
Miscellaneous
