

Ex vivo visualization of human ciliated epithelium and quantitative analysis of induced flow dynamics by using optical coherence tomography
- PMID: 28231402
- PMCID: PMC5367930
- DOI: 10.1002/lsm.22653
Ex vivo visualization of human ciliated epithelium and quantitative analysis of induced flow dynamics by using optical coherence tomography
Abstract
Background and objective: Cilia-driven mucociliary clearance is an important self-defense mechanism of great clinical importance in pulmonary research. Conventional light microscopy possesses the capability to visualize individual cilia and its beating pattern but lacks the throughput to assess the global ciliary activities and flow dynamics. Optical coherence tomography (OCT), which provides depth-resolved cross-sectional images, was recently introduced to this area.
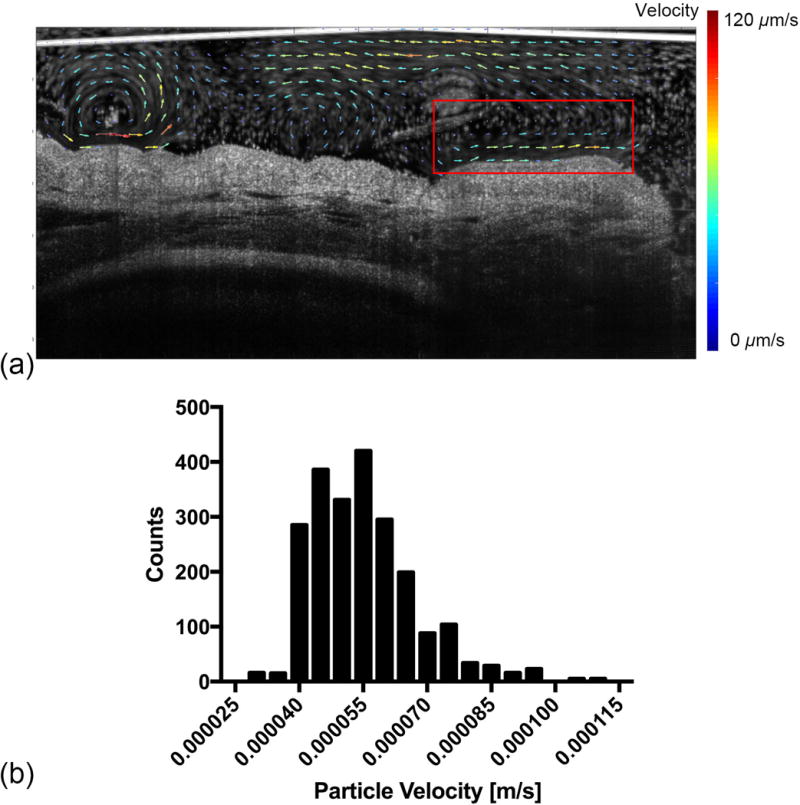
Materials and methods: Fourteen de-identified human tracheobronchial tissues are directly imaged by two OCT systems: one system centered at 1,300 nm with 6.5 μm axial resolution and 15 μm lateral resolution, and the other centered at 800 nm with 2.72 μm axial resolution and 5.52 μm lateral resolution. Speckle variance images are obtained in both cross-sectional and volumetric modes. After imaging, sample blocks are sliced along the registered OCT imaging plane and processed with hematoxylin and eosin (H&E) stain for comparison. Quantitative flow analysis is performed by tracking the path-lines of microspheres in a fixed cross-section. Both the flow rate and flow direction are characterized.
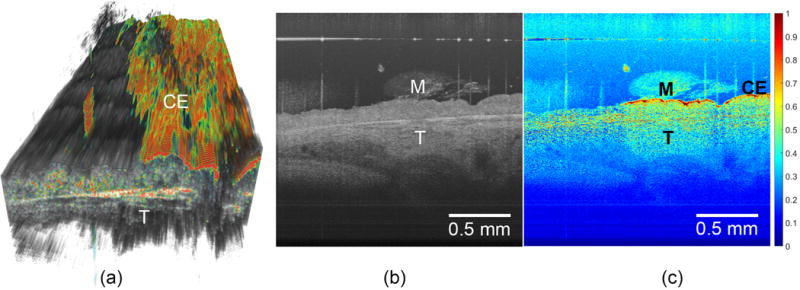
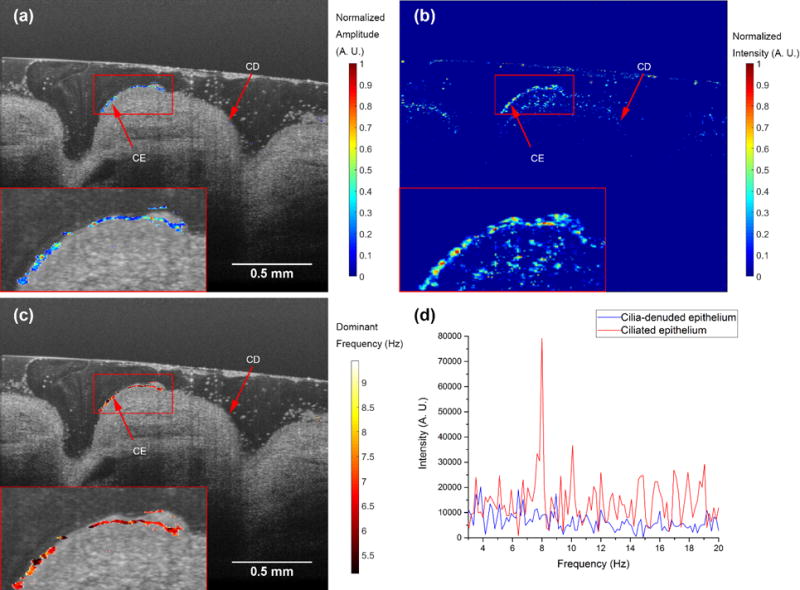
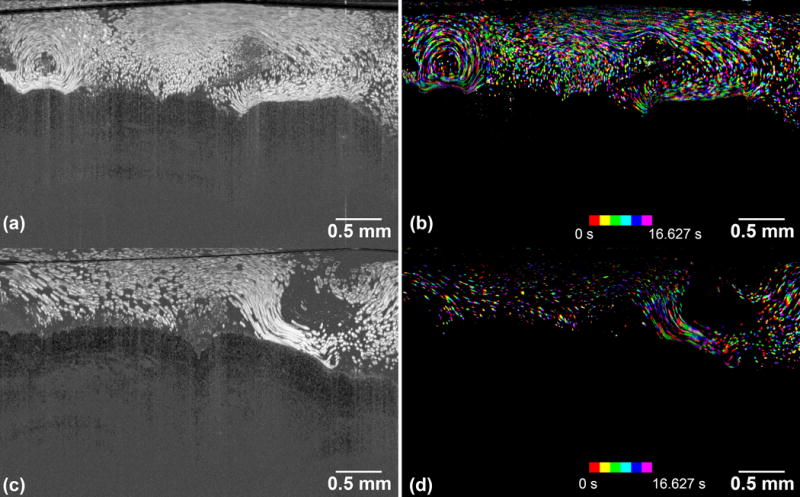
Results: The speckle variance images successfully segment the ciliated epithelial tissue from its cilia-denuded counterpart, and the results are validated by corresponding H&E stained sections. A further temporal frequency analysis is performed to extract the ciliary beat frequency (CBF) at cilia cites. By adding polyester microspheres as contrast agents, we demonstrate ex vivo imaging of the flow induced by cilia activities of human tracheobronchial samples.
Conclusion: This manuscript presents an ex vivo study on human tracheobronchial ciliated epithelium and its induced mucous flow by using OCT. Within OCT images, intact ciliated epithelium is effectively distinguished from cilia-denuded counterpart, which serves as a negative control, by examining the speckle variance images. The cilia beat frequency is extracted by temporal frequency analysis. The flow rate, flow direction, and particle throughput are obtained through particle tracking. The availability of these quantitative parameters provides us with a powerful tool that will be useful for studying the physiology, pathophysiology and the effectiveness of therapies on epithelial cilia function, as well as serve as a diagnostic tool for diseases associated with ciliary dysmotility. Lasers Surg. Med. 49:270-279, 2017. © 2017 Wiley Periodicals, Inc.
Keywords: flow dynamics; human tracheobronchial tissue; motile cilia; mucociliary clearance; optical coherence tomography; speckle variance.
© 2017 Wiley Periodicals, Inc.
Conflict of interest statement
Conflict of Interest Disclosures: All authors have completed and submitted the ICMJE Form for Disclosure of Potential Conflicts of Interest and none were reported.
Figures


Similar articles
-
Measurement of ciliary beat frequency using Doppler optical coherence tomography.Int Forum Allergy Rhinol. 2015 Nov;5(11):1048-54. doi: 10.1002/alr.21582. Epub 2015 Jul 2. Int Forum Allergy Rhinol. 2015. PMID: 26136399 Free PMC article.
-
Visualization and tissue classification of human breast cancer images using ultrahigh-resolution OCT.Lasers Surg Med. 2017 Mar;49(3):258-269. doi: 10.1002/lsm.22654. Epub 2017 Mar 6. Lasers Surg Med. 2017. PMID: 28264146 Free PMC article.
-
Visualization and quantification of injury to the ciliated epithelium using quantitative flow imaging and speckle variance optical coherence tomography.Sci Rep. 2017 Nov 8;7(1):15115. doi: 10.1038/s41598-017-14670-9. Sci Rep. 2017. PMID: 29118359 Free PMC article.
-
Ultrahigh-resolution optical coherence tomography.J Biomed Opt. 2004 Jan-Feb;9(1):47-74. doi: 10.1117/1.1629679. J Biomed Opt. 2004. PMID: 14715057 Review.
-
Optical Imaging of Cilia in the Head and Neck.J Clin Med. 2025 Mar 18;14(6):2059. doi: 10.3390/jcm14062059. J Clin Med. 2025. PMID: 40142867 Free PMC article. Review.
Cited by
-
Experimental and numerical investigation of wavelength and resolution dependency of dynamic optical coherence tomography signals.Biomed Opt Express. 2025 Jul 7;16(8):3084-3104. doi: 10.1364/BOE.564030. eCollection 2025 Aug 1. Biomed Opt Express. 2025. PMID: 40809984 Free PMC article.
-
Visualizing flow in an intact CSF network using optical coherence tomography: implications for human congenital hydrocephalus.Sci Rep. 2019 Apr 17;9(1):6196. doi: 10.1038/s41598-019-42549-4. Sci Rep. 2019. PMID: 30996265 Free PMC article.
-
In vivo volumetric depth-resolved imaging of cilia metachronal waves using dynamic optical coherence tomography.Optica. 2023 Nov 20;10(11):1439-1451. doi: 10.1364/optica.499927. Epub 2023 Nov 2. Optica. 2023. PMID: 38665775 Free PMC article.
-
Neural-network based high-speed volumetric dynamic optical coherence tomography.Biomed Opt Express. 2024 Apr 19;15(5):3216-3239. doi: 10.1364/BOE.519964. eCollection 2024 May 1. Biomed Opt Express. 2024. PMID: 38855683 Free PMC article.
-
Label-free intratissue activity imaging of alveolar organoids with dynamic optical coherence tomography.Biomed Opt Express. 2023 Apr 27;14(5):2333-2351. doi: 10.1364/BOE.488097. eCollection 2023 May 1. Biomed Opt Express. 2023. PMID: 37206117 Free PMC article.
References
-
- Baker K, Beales PL. Making sense of cilia in disease: The human ciliopathies. American Journal of Medical Genetics Part C: Seminars in Medical Genetics. 2009;151C(4):281–295. - PubMed
-
- Camner P, Mossberg B, Afzelius BA. Measurements of tracheobronchial clearance in patients with immotile-cilia syndrome and its value in differential diagnosis. Eur J Respir Dis Suppl. 1983;127:57–63. - PubMed
Publication types
MeSH terms
Grants and funding
LinkOut - more resources
Full Text Sources
Other Literature Sources
