. 2017 Feb 22;93(4):882-896.e5.
doi: 10.1016/j.neuron.2017.01.019.

Parkinson Sac Domain Mutation in Synaptojanin 1 Impairs Clathrin Uncoating at Synapses and Triggers Dystrophic Changes in Dopaminergic Axons

Affiliations

Parkinson Sac Domain Mutation in Synaptojanin 1 Impairs Clathrin Uncoating at Synapses and Triggers Dystrophic Changes in Dopaminergic Axons

Mian Cao et al. Neuron. .

Abstract

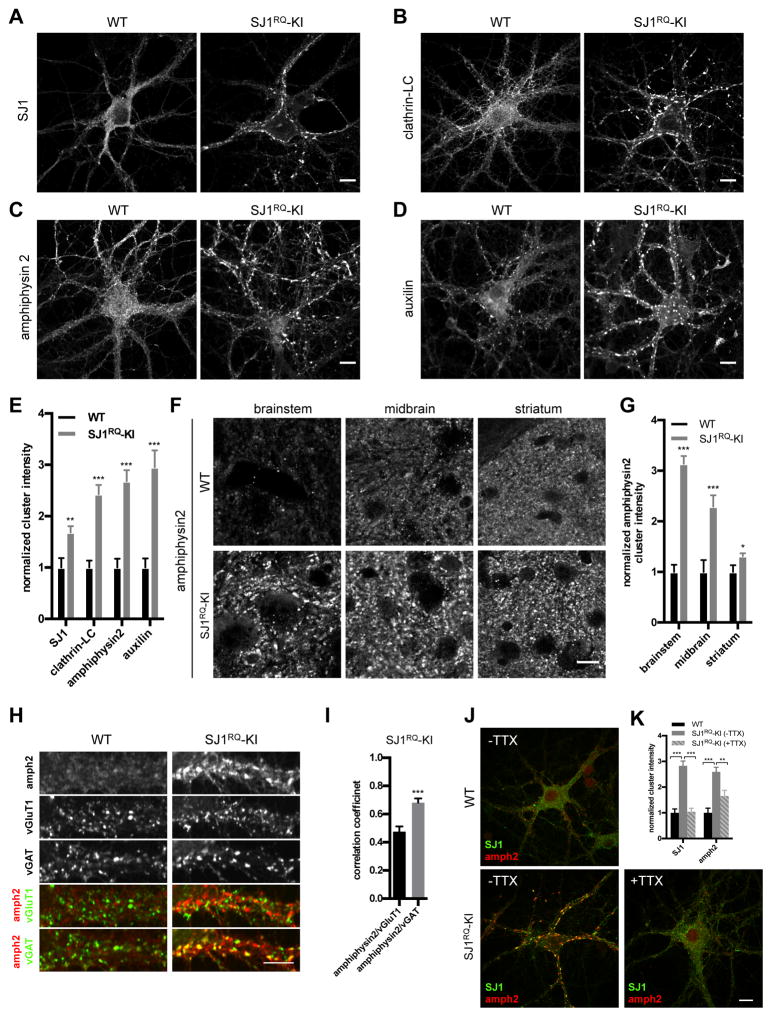
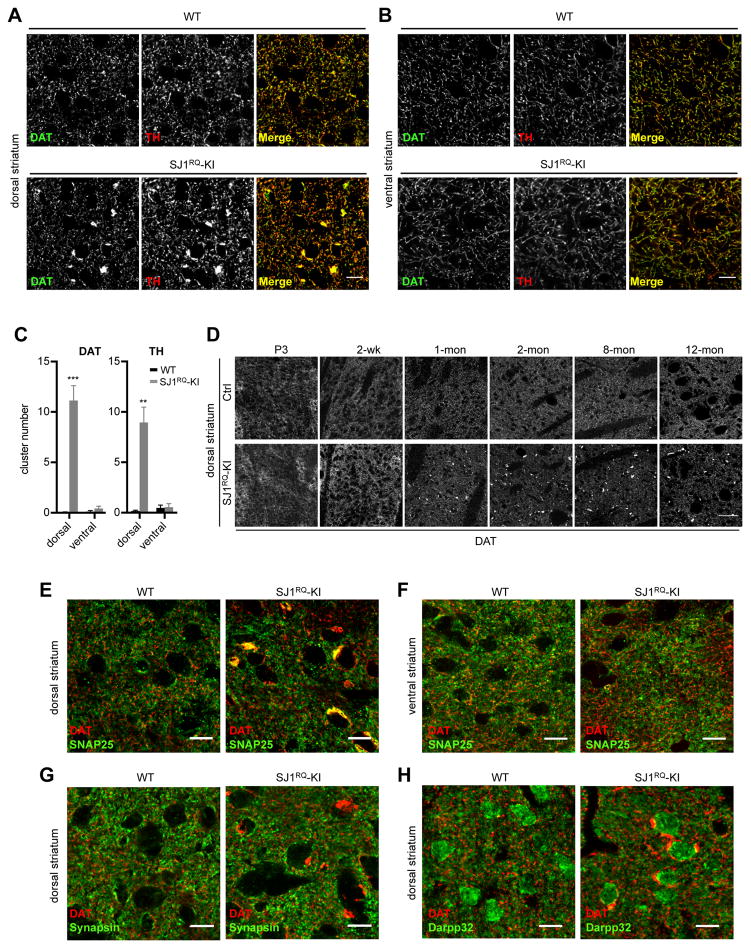
Synaptojanin 1 (SJ1) is a major presynaptic phosphatase that couples synaptic vesicle endocytosis to the dephosphorylation of PI(4,5)P2, a reaction needed for the shedding of endocytic factors from their membranes. While the role of SJ1's 5-phosphatase module in this process is well recognized, the contribution of its Sac phosphatase domain, whose preferred substrate is PI4P, remains unclear. Recently a homozygous mutation in its Sac domain was identified in early-onset parkinsonism patients. We show that mice carrying this mutation developed neurological manifestations similar to those of human patients. Synapses of these mice displayed endocytic defects and a striking accumulation of clathrin-coated intermediates, strongly implicating Sac domain's activity in endocytic protein dynamics. Mutant brains had elevated auxilin (PARK19) and parkin (PARK2) levels. Moreover, dystrophic axonal terminal changes were selectively observed in dopaminergic axons in the dorsal striatum. These results strengthen evidence for a link between synaptic endocytic dysfunction and Parkinson's disease.

Keywords: LRRK2; PARK19; PARK2; PARK20; PI(4,5)P2; Parkin; auxilin; neurodegeneration; nigrostriatal pathway; synaptic vesicle endocytosis; synaptojanin 1.


Figures

Figure 1
Figure 1. Neurological defects in SJ1RQ-KI mice
(A) 3-week old SJ1-RQ knock-in homozygous (SJ1RQ-KI) mouse and heterozygous littermate controls (+/KI). (B) Survival curves of SJ1RQ-KI and wild-type (WT) control mice (n=37). (C) Hindlimb clasping (HLC) phenotype in 16-week old SJ1RQ-KI mouse. (D) Quantification of the time spent in clasping during 30 s of tail suspension (n=7). (E) Quantification of the number of clasping during 30 s of tail suspension (n=7). (F) Performance on accelerated rotarod of SJ1RQ-KI mice (n=7) in 5 consecutive trials. (G) Number of missteps (footslips) in the balance beam test (20mm width) (n=7). (H) Time to fall from a suspended grid (n=7). Data are represented as mean ± SEM. *P<0.05, **P<0.01, ***P<0.001. See also Figure S1 and Movie S1–S5 for additional data.
Figure 2
Figure 2. Modified levels of several endocytic proteins in brains of SJ1RQ-KI mice
(A) Western blot analysis of a variety of endocytic proteins, including SJ1 itself and of parkin in WT and SJ1RQ-KI brains. (B) Quantification of expression levels of the proteins shown in (A) from at least three independent pairs of samples. Note upregulation of several endocytic proteins and of parkin. Protein levels were normalized to the level of actin. Data are represented as mean ± SEM. *P<0.05, **P<0.01 See also Figure S1 for additional data.
Figure 3
Figure 3. Clustering of SJ1 and other endocytic proteins at SJ1RQ-KI synapses as revealed by immunofluorescence
(A–D) Representative images of immunoreactivity for SJ1, clathrin light chain (LC), amphiphysin 2 and auxilin in DIV18 cortical neuronal cultures from WT and SJ1RQ-KI newborn mice. Scale bar: 10μm (E) Quantification of the synaptic clustering of endocytic proteins shown in A–D. Data are represented as mean ± SEM. **P<0.01, ***P<0.001. (SJ1: WT n=30, SJ1RQ-KI n=30; clathrin-LC: WT n=21; SJ1RQ-KI n=21; amphiphysin2: WT n=35; SJ1RQ-KI n=32; auxilin: WT n=26; SJ1RQ-KI n=21). (F) Enhanced clustering of amphiphysin 2 in different regions of frozen brain sections from 8-month old SJ1RQ-KI mice compared to littermate WT controls. Scale bar: 10μm (G) Quantification of amphiphysin 2 clustering shown in F. Data are represented as mean ± SEM. *P<0.05, ***P<0.001. (brainstem: WT n=20, SJ1RQ-KI n=20; midbrain: WT n=15, SJ1RQ-KI n=15; striatum: WT n=19, SJ1RQ-KI n=25). 9(H) Triple staining of amphiphysin 2, vGluT1 (excitatory presynaptic marker) and vGAT (inhibitory presynaptic marker) in DIV19 WT and SJ1RQ-KI cortical neurons. The merged images of amphiphysin 2 with vGluT1, or with vGAT, are shown separately, revealing greater colocalization of amphiphysin 2 with vGAT than vGluT1 in SJ1RQ-KI neurons. Scale bar: 10μm (I) Correlation coefficient analysis showing that amphiphysin 2 co-localizes better with vGAT than with vGluT1 in SJ1RQ-KI (n=15). Data are represented as mean ± SEM. ***P<0.001. (J) Double staining of SJ1 and amphiphysin 2 in DIV20 WT control (without TTX) and SJ1RQ-KI cortical neuronal cultures without or with 1μM TTX treatment overnight. Scale bar: 10μm (K) Quantification of SJ1 and amphiphysin 2 clustering shown in J. Data are represented as mean ± SEM. **P<0.01, ***P<0.001. (WT (−TTX) n=20, SJ1RQ-KI (−TTX) n=30, SJ1RQ-KI (+TTX) n=29). See also Figure S2 for additional data.
Figure 4
Figure 4. Accumulation of CCVs at SJ1RQ-KI synapses
(A–B) EM ultrastructure of nerve terminals from two different brain regions as indicated of WT and SJ1RQ-KI mice. Note in mutant nerve terminals the abundant presence of CCVs (red arrowheads and insets), which are observed only rarely in WT nerve terminals (no obvious ones in the images shown). Synaptic vesicle number is greatly reduced in mutant synapses where they form only very small clusters (white asterisks). Scale bar: 500nm (inset: 100nm) (C–D) Quantification of the number of synaptic vesicles (SVs) and CCVs per synaptic area in deep cerebellar nuclei (C) (WT n=45, SJ1RQ-KI n=39) and dorsal striatum (D) (WT n=43, SJ1RQ-KI n=54) of WT and SJ1RQ-KI mouse brains. Each dot represents one synapse. Data are represented as mean ± SEM. ***P<0.001. See also Figure S3 for additional data.
Figure 5
Figure 5. Synaptic vesicle endocytosis after electrical stimulation is slowed in SJ1RQ-KI neurons
(A) Representative normalized traces of vGluT1-pHluorin in cortical neurons stimulated with 50 or 300 AP (10 Hz) indicate slower endocytosis in SJ1RQ-KI compared to WT. (B) Endocytosis time constants after stimulation. Mean time constants ± SEM (sec): WT (50 AP) 5.2±0.3, SJ1RQ-KI (50 action potentials, AP) 12.6±1.3, WT (300 AP) 7.2±0.5, SJ1RQ-KI (300 AP) 22.3±4.5. n=18 cells per condition and genotype, one data point for the 300 AP stimulus in the SJ1RQ-KI (τ= 85 s) was excluded from the graphic (for clarity) but included in the mean value and statistical significance calculation. (C) Endocytosis during electrical activity in SJ1RQ-KI neurons is similar to WT. Average difference in vGluT1-pHluorin signal before and after bafilomycin treatment at each time point during 300 AP-stimulation was plotted to represent ongoing endocytosis. All vGluT1-pHluorin values are normalized to the total pool determined from neutralization with NH4Cl. n=13–14 per genotype. (D) Endocytic rate during 300 AP (10 Hz) is not significantly different in WT and SJ1RQ-KI neurons. Mean fraction of total vGluT1-pHluorin (%NH4Cl) endocytosed per second: WT 0.07±0.008 and SJ1RQ-KI 0.06±0.009. n=15 cells per genotype. (E) Exocytic time constants do not differ in SJ1RQ-KI and WT, and were determined from the rising phase of vGluT1-pHluorin signal in bafilomycin-treated neurons stimulated with 300 AP. Mean exocytic time constants (sec): WT 14.1±2.0 and SJ1RQ-KI 16.9±1.8. n=15 cells per genotype. (F) Representative vGluT1-pHluorin traces of WT and SJ1RQ-KI stimulated with a single AP reveal a similar exocytic response (% of total vGluT1-pHluorin pool). (G) Average exocytic response to a single AP normalized to the total vGluT1-pHluorin pool. Mean response (% NH4Cl): WT 1.3±0.2 and SJ1RQ-KI 1.0±0.2. n=5–7 cells per genotype. The box and whisker plot shows the median (line), 25th–75th percentile (box), and min-max (whisker). Error bars are SEM. **** P<0.00001.
Figure 6
Figure 6. Dystrophic changes of DAergic axons in dorsal striatum of SJ1RQ-KI mice
(A–B) Double immunofluorescence for the dopamine transporter (DAT, green) and tyrosine hydroxylase (TH, red), two markers of DAergic axons, in dorsal (A) and ventral (B) striatum derived from 8-month old WT and SJ1RQ-KI mice. Focal accumulations of these two proteins are present selectively in dorsal part of striatum in SJ1RQ-KI brain. Scale bar: 10μm (C) Quantification of the results shown in A and B. The number of large DAT and TH immunoreactive clusters (>5 μm2) in 200×200 μm regions of interest (ROIs) was quantified. 5 random ROIs in the dorsal and ventral striatum were used for each mouse. (DAT: dorsal n=7, ventral n=6. TH: dorsal n=5, ventral n=4). Data are represented as mean ± SEM. **P<0.01, ***P<0.001. (D) Representative images of DAT immunofluorescence in dorsal striatum of WT and SJ1RQ-KI brains at different ages (P3: postnatal day 3). Note that the clusters are not present until one month after birth. Scale bar: 50μm (E–F) Double immunofluorescence staining of the dorsal (E) and ventral (F) striatum of WT and SJ1RQ-KI mice for DAT and for the plasma membrane protein, SNAP25. The selective accumulation of this ubiquitous neuronal plasma membrane SNARE protein at sites which are also positive for DAT positive clusters reveals a selective abnormality of DAergic nigrostriatal axons. Scale bar: 10μm (G) Double immunofluorescence for DAT and for synapsin (synaptic vesicle marker) in the dorsal striatum of control and SJ1RQ-KI brains. Scale bar: 10μm (H) Double immunofluorescence staining of the dorsal striatum for DAT and for DARPP32, a cytosolic marker of striatal medium spiny neurons, demonstrating that clusters of DAT-positive immunoreactivity are often observed close to the soma of such neurons. Scale bar: 10μm See also Figure S4–S6 for additional data.
Figure 7
Figure 7. Ultrastructural analysis of the accumulations of markers of DAergic axons in SJ1RQ-KI dorsal striata
(A) Anti-TH immunogold (15nm gold particles) labeling of ultrathin frozen sections of WT and SJ1RQ-KI dorsal striata. Immunogold particles were detected in a subset of neuronal processes in the striata of both genotypes, indicating specific labeling for DAergic axons. (B) Immunogold labeling of ultrathin frozen sections of SJ1RQ-KI dorsal striata with anti-TH or control (anti-GFP) rabbit antibodies. Gold labeling of an onion-like multilayered membrane structure is observed with the anti-TH antibodies (right), while a multilayered membrane structure indicated by white arrows (left) is not labeled by control antibodies. (C) Two examples of multilayered membrane structures visualized by conventional EM in the dorsal striatum of SJ1RQ-KI mice. CB = cell bodies of medium spiny neurons. (D) Multilayered membrane structures (outlined in yellow) present in a 100×100×5μm volume of WT and SJ1RQ-KI dorsal striata as assessed by SBEM analysis. 3D rendering of the outer surface of these structures is shown against a micrograph of the last image of the SBEM series. (E) Large clusters of DAT immunoreactivity present in a 100×100×5μm volume of WT and SJ1RQ-KI dorsal striata as visualized by 3D reconstruction of confocal Z-stack images. Note the similar overall abundance of large DAT-positive structures (E) and multilayered membrane structures observed in D. See also Figure S7 and Movie S6 for additional data.

Comment in

Similar articles

Cited by

References

    1. Aransay A, Rodriguez-Lopez C, Garcia-Amado M, Clasca F, Prensa L. Long-range projection neurons of the mouse ventral tegmental area: a single-cell axon tracing analysis. Frontiers in neuroanatomy. 2015;9:59. - PMC - PubMed
    1. Armbruster M, Messa M, Ferguson SM, De Camilli P, Ryan TA. Dynamin phosphorylation controls optimization of endocytosis for brief action potential bursts. eLife. 2013;2:e00845. - PMC - PubMed
    1. Arranz AM, Delbroek L, Van Kolen K, Guimaraes MR, Mandemakers W, Daneels G, Matta S, Calafate S, Shaban H, Baatsen P, et al. LRRK2 functions in synaptic vesicle endocytosis through a kinase-dependent mechanism. Journal of cell science. 2015;128:541–552. - PubMed
    1. Beilina A, Rudenko IN, Kaganovich A, Civiero L, Chau H, Kalia SK, Kalia LV, Lobbestael E, Chia R, Ndukwe K, et al. Unbiased screen for interactors of leucine-rich repeat kinase 2 supports a common pathway for sporadic and familial Parkinson disease. Proceedings of the National Academy of Sciences of the United States of America. 2014;111:2626–2631. - PMC - PubMed
    1. Boassa D, Berlanga ML, Yang MA, Terada M, Hu J, Bushong EA, Hwang M, Masliah E, George JM, Ellisman MH. Mapping the subcellular distribution of alpha-synuclein in neurons using genetically encoded probes for correlated light and electron microscopy: implications for Parkinson’s disease pathogenesis. The Journal of neuroscience: the official journal of the Society for Neuroscience. 2013;33:2605–2615. - PMC - PubMed