Regulating dynamic signaling between hematopoietic stem cells and niche cells via a hydrogel matrix
- PMID: 28231508
- PMCID: PMC5444543
- DOI: 10.1016/j.biomaterials.2017.02.013
Regulating dynamic signaling between hematopoietic stem cells and niche cells via a hydrogel matrix
Abstract
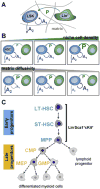
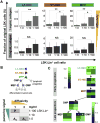
Hematopoietic stem cells (HSC) reside in unique bone marrow niches and are influenced by signals from surrounding cells, the extracellular matrix (ECM), ECM-bound or diffusible biomolecules. Here we describe the use of a three-dimensional hydrogel to alter the balance of HSC-generated autocrine feedback and paracrine signals generated by co-cultured niche-associated cells. We report shifts in HSC proliferation rate and fate specification in the presence of lineage positive (Lin+) niche cells. Hydrogels promoting autocrine feedback enhanced expansion of early hematopoietic progenitors while paracrine signals from Lin+ cells increased myeloid differentiation. We report thresholds where autocrine vs. paracrine cues alter HSC fate transitions, and were able to selectively abrogate the effects of matrix diffusivity and niche cell co-culture via the use of inhibitory cocktails of autocrine or paracrine signals. Together, these results suggest diffusive biotransport in three-dimensional biomaterials are a critical design element for the development of a synthetic stem cell niche.
Keywords: Autocrine; Hematopoietic; Hydrogel diffusivity; Paracrine; Signaling.
Copyright © 2017 Elsevier Ltd. All rights reserved.
Figures


Similar articles
-
Connecting secretome to hematopoietic stem cell phenotype shifts in an engineered bone marrow niche.Integr Biol (Camb). 2020 Jul 10;12(7):175-187. doi: 10.1093/intbio/zyaa013. Integr Biol (Camb). 2020. PMID: 32556172 Free PMC article.
-
Soluble Signals and Remodeling in a Synthetic Gelatin-Based Hematopoietic Stem Cell Niche.Adv Healthc Mater. 2019 Oct;8(20):e1900751. doi: 10.1002/adhm.201900751. Epub 2019 Sep 18. Adv Healthc Mater. 2019. PMID: 31532901 Free PMC article.
-
Marrow-inspired matrix cues rapidly affect early fate decisions of hematopoietic stem and progenitor cells.Sci Adv. 2017 Jan 6;3(1):e1600455. doi: 10.1126/sciadv.1600455. eCollection 2017 Jan. Sci Adv. 2017. PMID: 28070554 Free PMC article.
-
Engineered Tissue Models to Replicate Dynamic Interactions within the Hematopoietic Stem Cell Niche.Adv Healthc Mater. 2022 Apr;11(7):e2102130. doi: 10.1002/adhm.202102130. Epub 2022 Jan 7. Adv Healthc Mater. 2022. PMID: 34936239 Free PMC article. Review.
-
Concise Review: Paracrine Functions of Vascular Niche Cells in Regulating Hematopoietic Stem Cell Fate.Stem Cells Transl Med. 2017 Feb;6(2):482-489. doi: 10.5966/sctm.2016-0254. Epub 2016 Sep 13. Stem Cells Transl Med. 2017. PMID: 28191767 Free PMC article. Review.
Cited by
-
Translational Applications of Hydrogels.Chem Rev. 2021 Sep 22;121(18):11385-11457. doi: 10.1021/acs.chemrev.0c01177. Epub 2021 May 3. Chem Rev. 2021. PMID: 33938724 Free PMC article. Review.
-
Fabrication of initial trabecular bone-inspired three-dimensional structure with cell membrane nano fragments.Regen Biomater. 2022 Nov 2;10:rbac088. doi: 10.1093/rb/rbac088. eCollection 2023. Regen Biomater. 2022. PMID: 36683756 Free PMC article.
-
Connecting secretome to hematopoietic stem cell phenotype shifts in an engineered bone marrow niche.Integr Biol (Camb). 2020 Jul 10;12(7):175-187. doi: 10.1093/intbio/zyaa013. Integr Biol (Camb). 2020. PMID: 32556172 Free PMC article.
-
Perivascular Secretome Influences Hematopoietic Stem Cell Maintenance in a Gelatin Hydrogel.Ann Biomed Eng. 2021 Feb;49(2):780-792. doi: 10.1007/s10439-020-02602-0. Epub 2020 Sep 16. Ann Biomed Eng. 2021. PMID: 32939609 Free PMC article.
-
Structurally decoupled stiffness and solute transport in multi-arm poly(ethylene glycol) hydrogels.Biomaterials. 2023 Oct;301:122272. doi: 10.1016/j.biomaterials.2023.122272. Epub 2023 Aug 9. Biomaterials. 2023. PMID: 37573839 Free PMC article.
References
-
- Schofield R. The relationship between the spleen colony-forming cell and the haemopoietic stem cell. Blood Cells. 1978;4(1–2):7–25. - PubMed
-
- Haylock DN, Nilsson SK. Stem cell regulation by the hematopoietic stem cell niche. Cell Cycle. 2005;4(10):1353–1355. - PubMed
-
- Tokoyoda K, Egawa T, Sugiyama T, Choi BI, Nagasawa T. Cellular niches controlling B lymphocyte behavior within bone marrow during development. Immunity. 2004;20(6):707–718. - PubMed
-
- Purton LE, Scadden DT. StemBook. Cambridge (MA): 2008. The Hematopoietic Stem Cell Niche. - PubMed
-
- Adams GB, Scadden DT. The hematopoietic stem cell in its place. Nat Immunol. 2006;7(4):333–337. - PubMed
Publication types
MeSH terms
Substances
Grants and funding
LinkOut - more resources
Full Text Sources
Other Literature Sources
Medical

