

Default mode network deactivation to smoking cue relative to food cue predicts treatment outcome in nicotine use disorder
- PMID: 28231626
- PMCID: PMC5874131
- DOI: 10.1111/adb.12498
Default mode network deactivation to smoking cue relative to food cue predicts treatment outcome in nicotine use disorder
Abstract
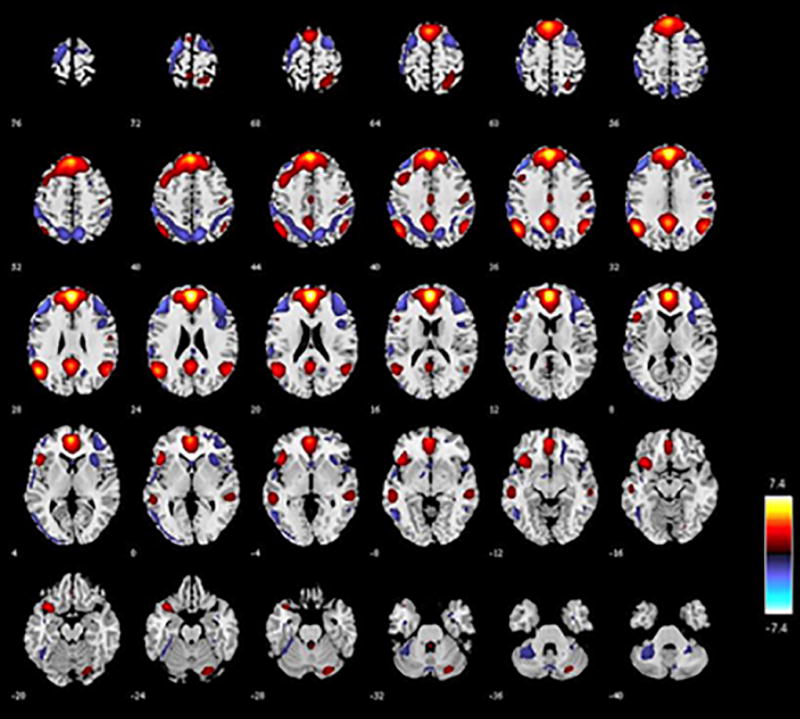
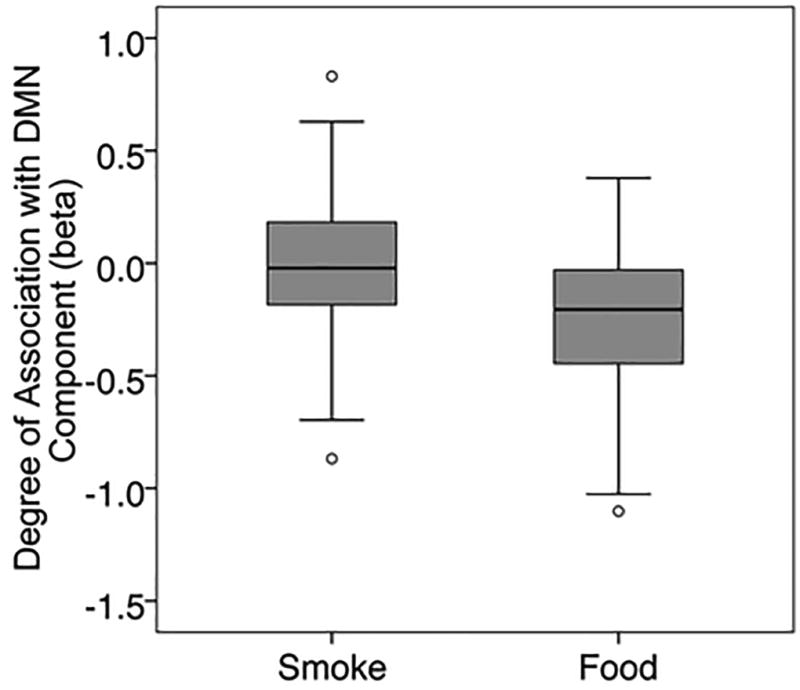
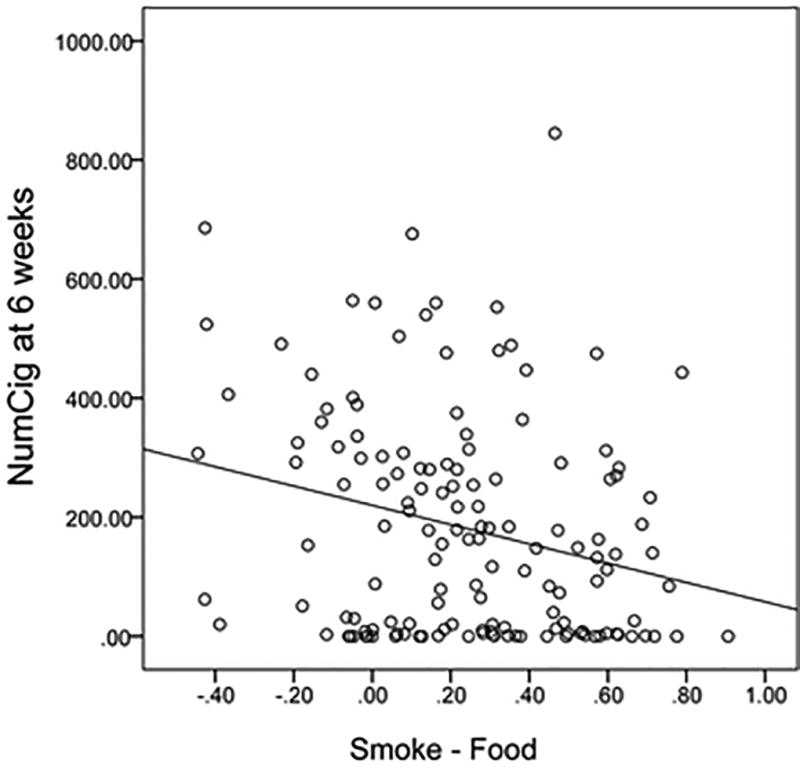
Identifying predictors of treatment outcome for nicotine use disorders (NUDs) may help improve efficacy of established treatments, like varenicline. Brain reactivity to drug stimuli predicts relapse risk in nicotine and other substance use disorders in some studies. Activity in the default mode network (DMN) is affected by drug cues and other palatable cues, but its clinical significance is unclear. In this study, 143 individuals with NUD (male n = 91, ages 18-55 years) received a functional magnetic resonance imaging scan during a visual cue task during which they were presented with a series of smoking-related or food-related video clips prior to randomization to treatment with varenicline (n = 80) or placebo. Group independent components analysis was utilized to isolate the DMN, and temporal sorting was used to calculate the difference between the DMN blood-oxygen-level dependent signal during smoke cues and that during food cues for each individual. Food cues were associated with greater deactivation compared with smoke cues in the DMN. In correcting for baseline smoking and other clinical variables, which have been shown to be related to treatment outcome in previous work, a less positive Smoke - Food difference score predicted greater smoking at 6 and 12 weeks when both treatment groups were combined (P = 0.005, β = -0.766). An exploratory analysis of executive control and salience networks demonstrated that a more positive Smoke - Food difference score for executive control network predicted a more robust response to varenicline relative to placebo. These findings provide further support to theories that brain reactivity to palatable cues, and in particular in DMN, may have a direct clinical relevance in NUD.
Keywords: default mode network; functional MRI; nicotine use disorder; smoking; treatment outcome; varenicline.
© 2017 Society for the Study of Addiction.
Conflict of interest statement
The authors have no conflicts of interest to declare.
Figures
Similar articles
-
Functional network connectivity predicts treatment outcome during treatment of nicotine use disorder.Psychiatry Res Neuroimaging. 2017 Jul 30;265:45-53. doi: 10.1016/j.pscychresns.2017.04.011. Epub 2017 Apr 30. Psychiatry Res Neuroimaging. 2017. PMID: 28525877 Free PMC article. Clinical Trial.
-
Dorsal anterior cingulate glutamate is associated with engagement of the default mode network during exposure to smoking cues.Drug Alcohol Depend. 2016 Oct 1;167:75-81. doi: 10.1016/j.drugalcdep.2016.07.021. Epub 2016 Aug 9. Drug Alcohol Depend. 2016. PMID: 27522872 Free PMC article.
-
Resisting the urge to smoke and craving during a smoking quit attempt on varenicline: results from a pilot fMRI study.Am J Drug Alcohol Abuse. 2013 Mar;39(2):92-8. doi: 10.3109/00952990.2012.750665. Am J Drug Alcohol Abuse. 2013. PMID: 23421569 Free PMC article. Clinical Trial.
-
Current pharmacologic treatments for smoking cessation and new agents undergoing clinical trials.Ther Adv Respir Dis. 2019 Jan-Dec;13:1753466619875925. doi: 10.1177/1753466619875925. Ther Adv Respir Dis. 2019. PMID: 31533544 Free PMC article. Review.
-
Advances in smoking cessation pharmacotherapy: Non-nicotinic approaches in animal models.Neuropharmacology. 2020 Nov 1;178:108225. doi: 10.1016/j.neuropharm.2020.108225. Epub 2020 Aug 3. Neuropharmacology. 2020. PMID: 32758566 Free PMC article. Review.
Cited by
-
Active versus sham transcranial direct current stimulation (tDCS) as an adjunct to varenicline treatment for smoking cessation: Study protocol for a double-blind single dummy randomized controlled trial.PLoS One. 2022 Dec 8;17(12):e0277408. doi: 10.1371/journal.pone.0277408. eCollection 2022. PLoS One. 2022. PMID: 36480510 Free PMC article.
-
Neural cue reactivity during acute abstinence predicts short-term smoking relapse.Addict Biol. 2020 Mar;25(2):e12733. doi: 10.1111/adb.12733. Epub 2019 Feb 25. Addict Biol. 2020. PMID: 30806013 Free PMC article.
-
Functional network connectivity predicts treatment outcome during treatment of nicotine use disorder.Psychiatry Res Neuroimaging. 2017 Jul 30;265:45-53. doi: 10.1016/j.pscychresns.2017.04.011. Epub 2017 Apr 30. Psychiatry Res Neuroimaging. 2017. PMID: 28525877 Free PMC article. Clinical Trial.
-
Neural mechanisms linked to treatment outcomes and recovery in substance-related and addictive disorders.Dialogues Clin Neurosci. 2023 Dec;25(1):75-91. doi: 10.1080/19585969.2023.2242359. Dialogues Clin Neurosci. 2023. PMID: 37594217 Free PMC article. Review.
-
Correlations Between the DMN and the Smoking Cessation Outcome of a Real-Time fMRI Neurofeedback Supported Exploratory Therapy Approach: Descriptive Statistics on Tobacco-Dependent Patients.Clin EEG Neurosci. 2022 Jul;53(4):287-296. doi: 10.1177/15500594211062703. Epub 2021 Dec 8. Clin EEG Neurosci. 2022. PMID: 34878329 Free PMC article. Clinical Trial.
References
-
- Alison PD. Logistic Regression Using SAS®: Theory and Application, Second Edition. SAS Institute; 2012.
-
- Aubin HJ, Lebargy F, Berlin I, Bidaut-Mazel C, Chemali-Hudry J, Lagrue G. Efficacy of bupropion and predictors of successful outcome in a sample of French smokers: a randomized placebo-controlled trial. Addiction. 2004;99(9):1206–1218. - PubMed
Publication types
MeSH terms
Substances
Grants and funding
LinkOut - more resources
Full Text Sources
Other Literature Sources
Medical
