

Exploratory bioinformatics investigation reveals importance of "junk" DNA in early embryo development
- PMID: 28231763
- PMCID: PMC5324221
- DOI: 10.1186/s12864-017-3566-0
Exploratory bioinformatics investigation reveals importance of "junk" DNA in early embryo development
Abstract
Background: Instead of testing predefined hypotheses, the goal of exploratory data analysis (EDA) is to find what data can tell us. Following this strategy, we re-analyzed a large body of genomic data to study the complex gene regulation in mouse pre-implantation development (PD).
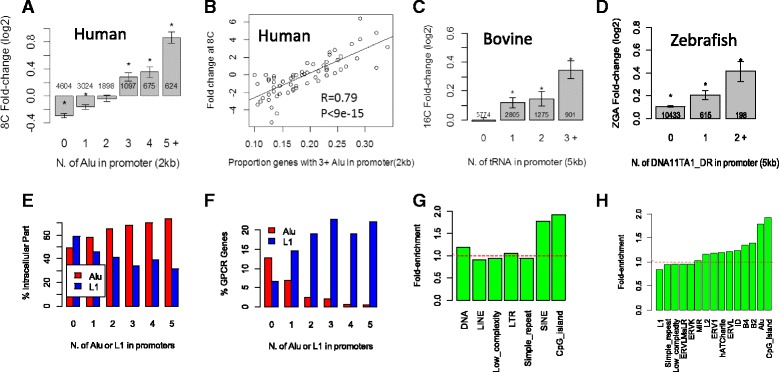
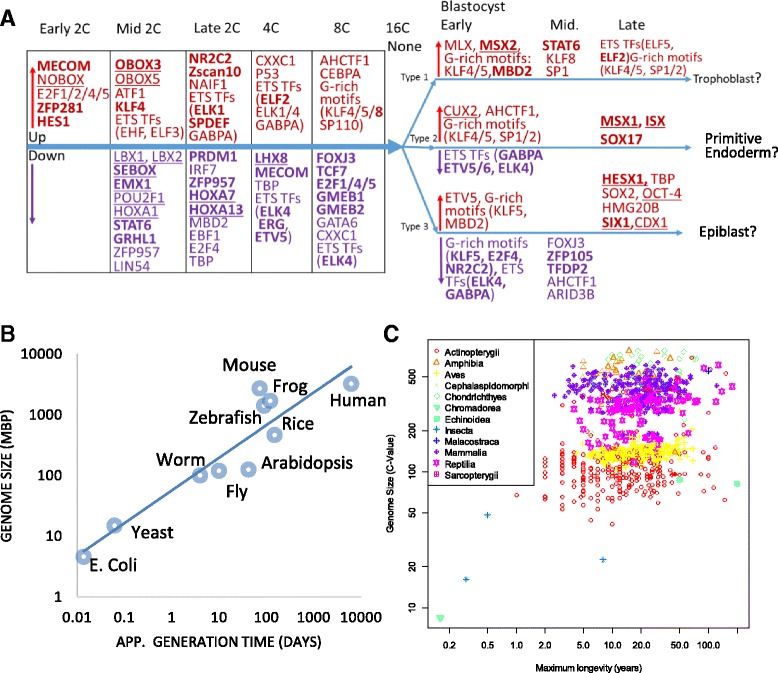
Results: Starting with a single-cell RNA-seq dataset consisting of 259 mouse embryonic cells derived from zygote to blastocyst stages, we reconstructed the temporal and spatial gene expression pattern during PD. The dynamics of gene expression can be partially explained by the enrichment of transposable elements in gene promoters and the similarity of expression profiles with those of corresponding transposons. Long Terminal Repeats (LTRs) are associated with transient, strong induction of many nearby genes at the 2-4 cell stages, probably by providing binding sites for Obox and other homeobox factors. B1 and B2 SINEs (Short Interspersed Nuclear Elements) are correlated with the upregulation of thousands of nearby genes during zygotic genome activation. Such enhancer-like effects are also found for human Alu and bovine tRNA SINEs. SINEs also seem to be predictive of gene expression in embryonic stem cells (ESCs), raising the possibility that they may also be involved in regulating pluripotency. We also identified many potential transcription factors underlying PD and discussed the evolutionary necessity of transposons in enhancing genetic diversity, especially for species with longer generation time.
Conclusions: Together with other recent studies, our results provide further evidence that many transposable elements may play a role in establishing the expression landscape in early embryos. It also demonstrates that exploratory bioinformatics investigation can pinpoint developmental pathways for further study, and serve as a strategy to generate novel insights from big genomic data.
Keywords: Early embryogenesis; Exploratory data analysis; Pre-implantation development; Repetitive DNA; Single-cell RNA-seq; Transposons.
Figures


Similar articles
-
Expression dynamics of repetitive DNA in early human embryonic development.BMC Genomics. 2019 May 31;20(1):439. doi: 10.1186/s12864-019-5803-1. BMC Genomics. 2019. PMID: 31151386 Free PMC article.
-
Identification and functional analysis of long non-coding RNAs in human and mouse early embryos based on single-cell transcriptome data.Oncotarget. 2016 Sep 20;7(38):61215-61228. doi: 10.18632/oncotarget.11304. Oncotarget. 2016. PMID: 27542205 Free PMC article.
-
Chromatin analysis in human early development reveals epigenetic transition during ZGA.Nature. 2018 May;557(7704):256-260. doi: 10.1038/s41586-018-0080-8. Epub 2018 May 2. Nature. 2018. PMID: 29720659
-
Epigenetic regulatory mechanisms during preimplantation development.Birth Defects Res C Embryo Today. 2009 Dec;87(4):297-313. doi: 10.1002/bdrc.20165. Birth Defects Res C Embryo Today. 2009. PMID: 19960551 Review.
-
The impact of retrotransposons on zygotic genome activation and the chromatin landscape of early embryos.Ann N Y Acad Sci. 2024 Dec;1542(1):11-24. doi: 10.1111/nyas.15260. Epub 2024 Nov 22. Ann N Y Acad Sci. 2024. PMID: 39576233 Free PMC article. Review.
Cited by
-
Living Organisms Author Their Read-Write Genomes in Evolution.Biology (Basel). 2017 Dec 6;6(4):42. doi: 10.3390/biology6040042. Biology (Basel). 2017. PMID: 29211049 Free PMC article. Review.
-
Human pluripotent reprogramming with CRISPR activators.Nat Commun. 2018 Jul 6;9(1):2643. doi: 10.1038/s41467-018-05067-x. Nat Commun. 2018. PMID: 29980666 Free PMC article.
-
Transposable element-derived sequences in vertebrate development.Mob DNA. 2021 Jan 6;12(1):1. doi: 10.1186/s13100-020-00229-5. Mob DNA. 2021. PMID: 33407840 Free PMC article. Review.
-
Duplication and divergence of the retrovirus restriction gene Fv1 in Mus caroli allows protection from multiple retroviruses.PLoS Genet. 2020 Jun 11;16(6):e1008471. doi: 10.1371/journal.pgen.1008471. eCollection 2020 Jun. PLoS Genet. 2020. PMID: 32525879 Free PMC article.
-
Genes as Genome Stabilizers in Pluripotent Stem Cells.Adv Exp Med Biol. 2025;1483:21-47. doi: 10.1007/5584_2025_853. Adv Exp Med Biol. 2025. PMID: 40095244 Review.
References
-
- Popper KR. Conjectures and refutations; the growth of scientific knowledge. New York: Basic Books; 1962.
-
- Tukey JW. Exploratory data analysis. Massachusetts: Addison-Wesley Pub. Co; 1977.
-
- Tufte ER. The visual display of quantitative information. Cheshire, Conn. (Box 430, Cheshire 06410): Graphics Press; 1983.
Publication types
MeSH terms
Substances
Grants and funding
LinkOut - more resources
Full Text Sources
Other Literature Sources
Research Materials
