

Do pre-diagnosis primary care consultation patterns explain deprivation-specific differences in net survival among women with breast cancer? An examination of individually-linked data from the UK West Midlands cancer registry, national screening programme and Clinical Practice Research Datalink
- PMID: 28231774
- PMCID: PMC5324281
- DOI: 10.1186/s12885-017-3129-4
Do pre-diagnosis primary care consultation patterns explain deprivation-specific differences in net survival among women with breast cancer? An examination of individually-linked data from the UK West Midlands cancer registry, national screening programme and Clinical Practice Research Datalink
Abstract
Background: In England and Wales breast cancer survival is higher among more affluent women. Our aim was to investigate the potential of pre-diagnostic factors for explaining deprivation-related differences in survival.
Methods: Individually-linked data from women aged 50-70 in the West Midlands region of England, diagnosed with breast cancer 1989-2006 and continuously eligible for screening, was retrieved from the cancer registry, screening service and Clinical Practice Research Datalink. Follow-up was to the end of July 2012. Deprivation was measured at small area level, based on the quintiles of the income domain of the English indices of deprivation. Consultation rates per woman per week, time from last breast-related GP consultation to diagnosis, and from diagnosis to first surgery were calculated. We estimated net survival using the non-parametric Pohar-Perme estimator.
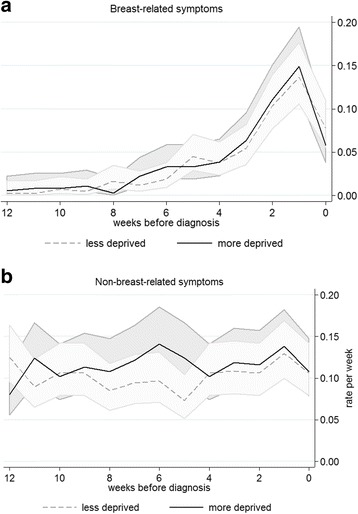
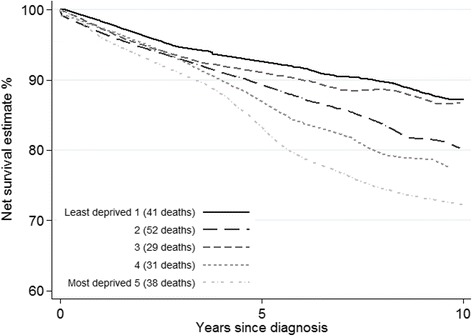
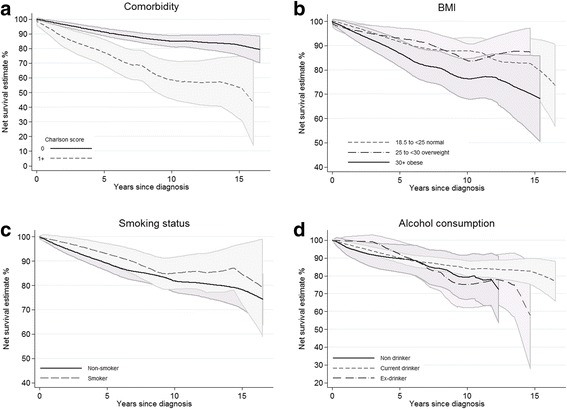
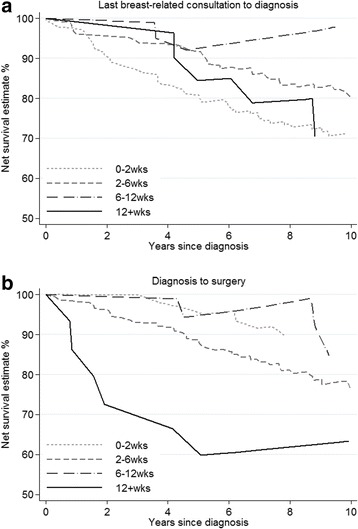
Results: The rate of primary care consultations was similar during the 18 months prior to diagnosis in each deprivation group for breast and non-breast symptoms. Survival was lower for more deprived women from 4 years after diagnosis. Lower net survival was associated with more advanced extent of disease and being non-screen-detected. There was a persistent trend of lower net survival for more deprived women, irrespective of the woman's obesity, alcohol, smoking or comorbidity status. There was no significant variation in time from last breast symptom to diagnosis by deprivation. However, women in more deprived categories experienced significantly longer periods between cancer diagnosis and first surgery (mean = 21.5 vs. 28.4 days, p = 0.03). Those whose surgery occurred more than 12 weeks following their cancer diagnosis had substantially lower net survival.
Conclusions: Our data suggest that although more deprived women with breast cancer display lifestyle factors associated with poorer outcomes, their consultation frequency, comorbidities and the breast cancer symptoms they present with are similar. We found weak evidence of extended times to surgical treatment among most deprived women who were not screen-detected but who presented with symptoms in primary care, which suggests that treatment delay may play a role. Further investigation of interrelationships between these variables within a larger dataset is warranted.
Keywords: Breast cancer; Consultation; Early Diagnosis; England; Pathways; Primary care; Socioeconomic inequalities; Survival.
Figures
Similar articles
-
Are socio-economic inequalities in breast cancer survival explained by peri-diagnostic factors?BMC Cancer. 2021 May 1;21(1):485. doi: 10.1186/s12885-021-08087-x. BMC Cancer. 2021. PMID: 33933034 Free PMC article.
-
Impact of deprivation on breast cancer survival among women eligible for mammographic screening in the West Midlands (UK) and New South Wales (Australia): Women diagnosed 1997-2006.Int J Cancer. 2016 May 15;138(10):2396-403. doi: 10.1002/ijc.29983. Epub 2016 Feb 13. Int J Cancer. 2016. PMID: 26756181 Free PMC article.
-
Ethnicity, deprivation and screening: survival from breast cancer among screening-eligible women in the West Midlands diagnosed from 1989 to 2011.Br J Cancer. 2015 Jul 28;113(3):548-55. doi: 10.1038/bjc.2015.204. Epub 2015 Jun 16. Br J Cancer. 2015. PMID: 26079301 Free PMC article.
-
Folic acid supplementation and malaria susceptibility and severity among people taking antifolate antimalarial drugs in endemic areas.Cochrane Database Syst Rev. 2022 Feb 1;2(2022):CD014217. doi: 10.1002/14651858.CD014217. Cochrane Database Syst Rev. 2022. PMID: 36321557 Free PMC article.
-
Health Inequalities in Breast Cancer in England: A Pragmatic Review to Inform National Institute for Care and Excellence (NICE) Recommendations.Cancer Control. 2024 Jan-Dec;31:10732748241293976. doi: 10.1177/10732748241293976. Cancer Control. 2024. PMID: 39576847 Free PMC article. Review.
Cited by
-
Impact of national cancer policies on cancer survival trends and socioeconomic inequalities in England, 1996-2013: population based study.BMJ. 2018 Mar 14;360:k764. doi: 10.1136/bmj.k764. BMJ. 2018. PMID: 29540358 Free PMC article.
-
Are socio-economic inequalities in breast cancer survival explained by peri-diagnostic factors?BMC Cancer. 2021 May 1;21(1):485. doi: 10.1186/s12885-021-08087-x. BMC Cancer. 2021. PMID: 33933034 Free PMC article.
-
Does changing healthcare use signal opportunities for earlier detection of cancer? A review of studies using information from electronic patient records.Cancer Epidemiol. 2022 Feb;76:102072. doi: 10.1016/j.canep.2021.102072. Epub 2021 Dec 4. Cancer Epidemiol. 2022. PMID: 34876377 Free PMC article. Review.
-
Identifying Methylation Pattern and Genes Associated with Breast Cancer Subtypes.Int J Mol Sci. 2019 Aug 31;20(17):4269. doi: 10.3390/ijms20174269. Int J Mol Sci. 2019. PMID: 31480430 Free PMC article.
References
Publication types
MeSH terms
Grants and funding
LinkOut - more resources
Full Text Sources
Other Literature Sources
Medical
