Randomized Controlled Trial
. 2017 Feb 24;17(1):12.
doi: 10.1186/s12902-017-0163-9.

Differential effects of vitamin D2 and D3 supplements on 25-hydroxyvitamin D level are dose, sex, and time dependent: a randomized controlled trial

Affiliations
Randomized Controlled Trial

Differential effects of vitamin D2 and D3 supplements on 25-hydroxyvitamin D level are dose, sex, and time dependent: a randomized controlled trial

Muhammad M Hammami et al. BMC Endocr Disord. .

Abstract

Background: Vitamin D (D) supplements are indispensable for its world-wide deficiency. Controversy continues on ergocalciferol (D2) and cholecalciferol (D3) relative potency as well as on dosing-schedule and sex role in raising 25-hydroxy D (25(OH)D) level, the best indicator of D status.

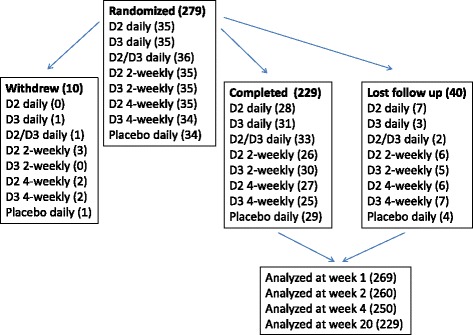
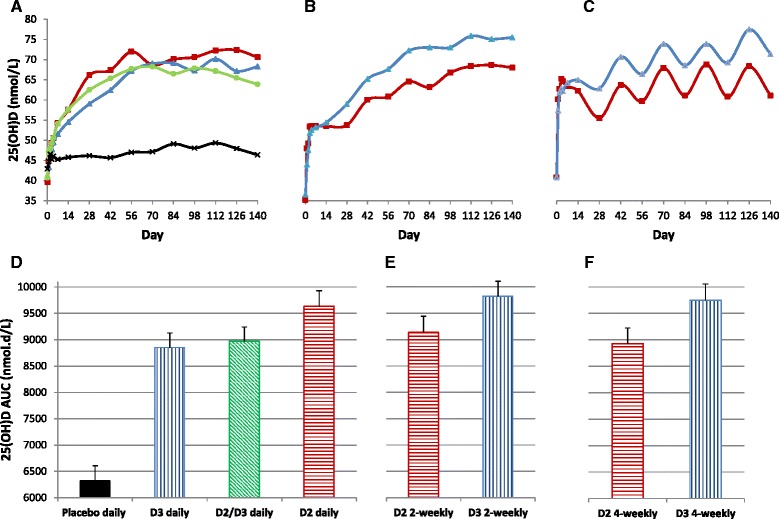
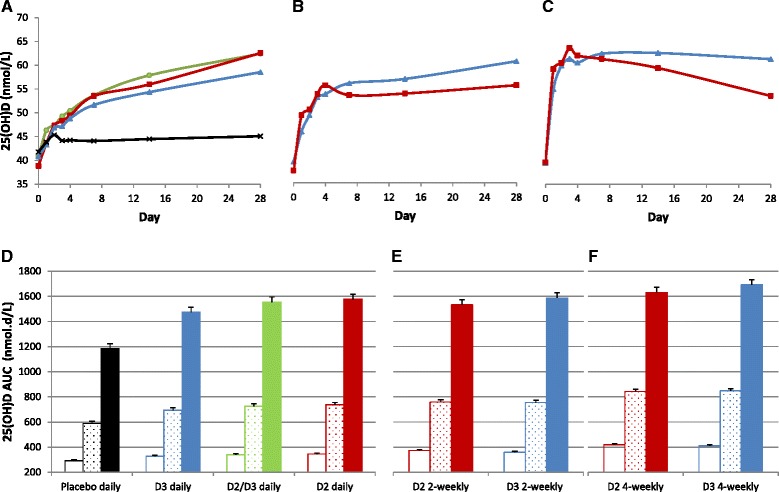
Methods: We randomized 279 adults to daily D2, D3, D2/D3, or placebo; 2-weekly D2 or D3; or 4-weekly D2 or D3 (250,000 IU over/140 days). Randomization sequence, stratified by body-mass-index (BMI) and sex, was concealed from study coordinators and participants who were then blinded to capsules' content. D2, D3, 25(OH)D2, and 25(OH)D3 Serum levels were determined blindly on days 0,1,2,3,4,7,14, and 2-weekly thereafter by high performance liquid chromatography assay. The results of 269 participants were available for analysis. Primary endpoint was area-under-the-curve (AUC) of 25(OH)D (25(OH)D2 + 25(OH)D3) adjusted for sex, BMI, and baseline 25(OH)D level.

Results: Mean(SD) age was 33.0(8.5) year, 41% were males, and 85% completed follow-up. Baseline 25(OH)D level was 39.8(11.9) and increased by 3.3(11.6) and 28.6(16.3) nmol/L, in the placebo and active-treatment groups, respectively. AUC from day 0 to 140 (AUC140) of 25(OH)D was 40% (D3 daily) to 55% (D3 2-weekly) higher with active-treatment than placebo (p < 0.001). 25(OH)D2 AUC140 was higher in daily than 2-weekly (17%, p = 0.006) and 4-weekly (20%, p = 0.001) D2-treated groups. 25(OH)D3 AUC140 was lower in daily than 2-weekly (11%, p = 0.002) and 4-weekly D3-treated groups (10%, p = 0.008). In D2-treated groups, there was 16.4 nmol/L decrease in 25(OH)D3 level that correlated (p < 0.001) with 25(OH)D2 level increase (r = 0.48) and baseline 25(OH)D level (r = 0.58), in one participant with measurable baseline 25(OH)D2 level, D3 caused a similar decrease in 25(OH)D2 level, while in the D2/D3-treated group, 25(OH)D3 level didn't increase. Incremental AUC from day 0 to 7 (AUC7) of D3 and 25(OH)D3 in D3-treated groups were 118-243% higher and 31-39% lower, respectively, than incremental AUC7 of D2 and 25(OH)D2 in D2-treated groups. Incremental AUC7 of D3 and 25(OH)D3 in D3-treated groups and D2 and 25(OH)D2 in D2-treated groups were higher in females than males (55, 13, 64, and 28%, respectively). Baseline 25(OH)D level predicted response to D2 and D3 (p < 0.001), whereas, BMI was significant predictor only for early response to D2.

Conclusions: Effects of D2 and D3 supplements on 25 (OH)D level may be dosing-schedule and sex-dependent. D2-associated reduction in 25(OH)D3 level may be related to total 25(OH)D level rather than being D2-specific. D2 may be 25-hydroxylated faster than D3.

Trial registration: ClinicalTrial.gov identifier: NCT01170494 (registered July 25, 2010).

Keywords: 25-hydroxyvitamin D2 level; 25-hydroxyvitamin D3 level; BMI; Cholecalciferol supplement; Creatinine production; D2 level; D3 level; Dose effect; Ergocalciferol supplement; Sex effect.


Figures

Fig. 1
Fig. 1
Participants flow chart. “Withdrew” indicates participants who did not complete the first week of the study and who were excluded from analysis
Fig. 2
Fig. 2
a, b, and c, data represent mean total 25-hydroxyvitamin D (25(OH)D) level over 140 days, in the daily, 2-weekly, and 4-weekly groups, respectively. Squares and triangles represent D2 and D3 groups, respectively. Circles and cross marks represent combined D2/D3 and placebo groups, respectively. d, e, and f, data represent adjusted mean (SE) 25(OH)D AUC140 in the daily, 2-weekly, and 4-weekly groups, respectively
Fig. 3
Fig. 3
a, b, and c, data represent mean total 25-hydroxyvitamin D (25(OH)D) level over the first 28 days of the study, in the daily, 2-weekly, and 4-weekly groups, respectively. Squares and triangles represent D2 and D3 groups, respectively. Circles and cross marks represent combined D2/D3 and placebo groups, respectively. d, e, and f, data represent adjusted mean (SE) 25(OH)D AUC7 (open bars), AUC14 (dotted bars), and AUC28 (closed bars) in the daily, 2-weekly, and 4-weekly groups, respectively
Fig. 4
Fig. 4
a and c, data represent mean 25-hydroxyvitamin D2 (25(OH)D2) and 25(OH)D3 levels, respectively, over 140 days. Squares and triangles represent D2 and D3 groups, respectively. Circles and cross marks represent combined D2/D3 and placebo groups, respectively. Solid, doted, and interrupted lines represent daily, 2-weekly, and 4-weekly groups, respectively. b and d, data represent adjusted mean (SE) 25(OH)D2 AUC140 in the D2 treated groups and 25(OH)D3 AUC140 in the D3 treated groups, respectively
Fig. 5
Fig. 5
a, Data show correlation between the changes (day 140 - day 0) in 25(OH)D3 levels and 25(OH)D2 levels in the three D2 treated groups (r = −0.48, p < 0.001). b, levels of D3 (open triangles), 25(OH)D2 (closed squares), and 25(OH)D3 (closed triangles) are depicted over 140 days in one participant from the D3 2-weekly group who happened to have measurable 25(OH)D2 at day zero
Fig. 6
Fig. 6
a, data represent mean D3 (closed triangles) and D2 (closed squares) levels in the 4-weekly (interrupted lines) and 2-weekly (solid lines) groups. b, data represent mean D3 (open triangles) and D2 (open squares) levels in females (interrupted line) and males (solid lines) in the 2-weekly and 4-weekly groups. C, data represent mean 25(OH)D3 (closed triangles) and 25(OH)D2 (closed squares) levels in the 4-weekly (interrupted lines) and 2-weekly (solid lines) groups after subtracting day zero levels. D, data represent mean 25(OH)D3 (open triangles) and 25(OH)D2 (open squares) levels in females (interrupted lines) and males (solid lines) in the 2-weekly and 4-weekly groups after subtracting day zero levels

References

    1. Bikle D. Nonclassic actions of vitamin D. J Clin Endocrinol Metab. 2009;94(1):26–34. doi: 10.1210/jc.2008-1454. - DOI - PMC - PubMed
    1. Hollis BW, Wagner CL. The role of the parent compound vitamin D with respect to metabolism and function: why clinical dose intervals can affect clinical outcomes. J Clin Endocrinol Metab. 2013;98(12):4619–28. doi: 10.1210/jc.2013-2653. - DOI - PMC - PubMed
    1. Romagnoli E, Carnevale V, Biondi P, Minisola S. Vitamin D supplementation: when and how? J Endocrinol Invest. 2014;37:603–7. doi: 10.1007/s40618-014-0071-z. - DOI - PubMed
    1. Heaney RP, Recker RR, Grote J, Horst RL, Armas LA. Vitamin D(3) is more potent than vitamin D(2) in humans. J Clin Endocrinol Metab. 2011;96(3):E447–52. doi: 10.1210/jc.2010-2230. - DOI - PubMed
    1. Melhem SJ, Aiedeh KM, Hadidi KA. Effects of a 10-day course of a high dose calciferol versus a single mega dose of ergocalciferol in correcting vitamin D deficiency. Ann Saudi Med. 2015;35(1):13–8. - PMC - PubMed

Publication types

Associated data