

Mechanistic added value of a trans-Sulfonamide-Platinum-Complex in human melanoma cell lines and synergism with cis-Platin
- PMID: 28231799
- PMCID: PMC5324334
- DOI: 10.1186/s12943-017-0618-7
Mechanistic added value of a trans-Sulfonamide-Platinum-Complex in human melanoma cell lines and synergism with cis-Platin
Abstract
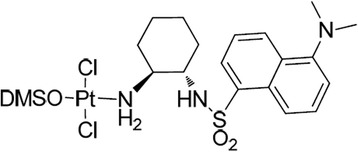
Background: Cisplatin is a potent antitumor agent. However, toxicity and primary and secondary resistance are major limitations of cisplatin-based chemotherapy, leading to therapeutic failure. We have previously reported that mono-sulfonamide platinum complexes have good antitumor activity against different tumoral cell lines and with a different and better cytotoxic profile than cisplatin. Besides, N-sulfonamides have been used extensively in medicinal chemistry as bactericides, anticonvulsant, inhibitors of the carbonic anhydrase, inhibitors of histone deacetylases, and inhibitors of microtubule polymerization, among others.
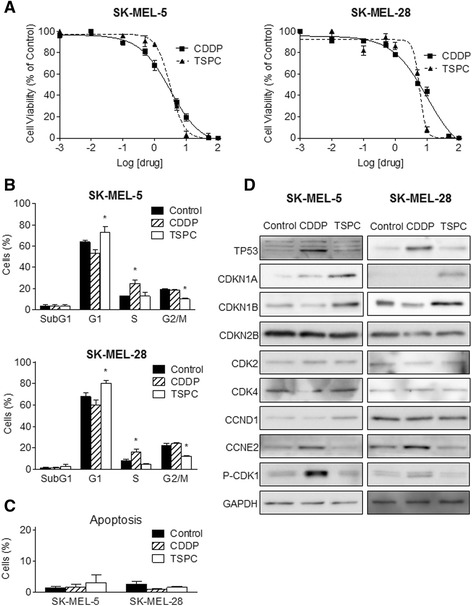
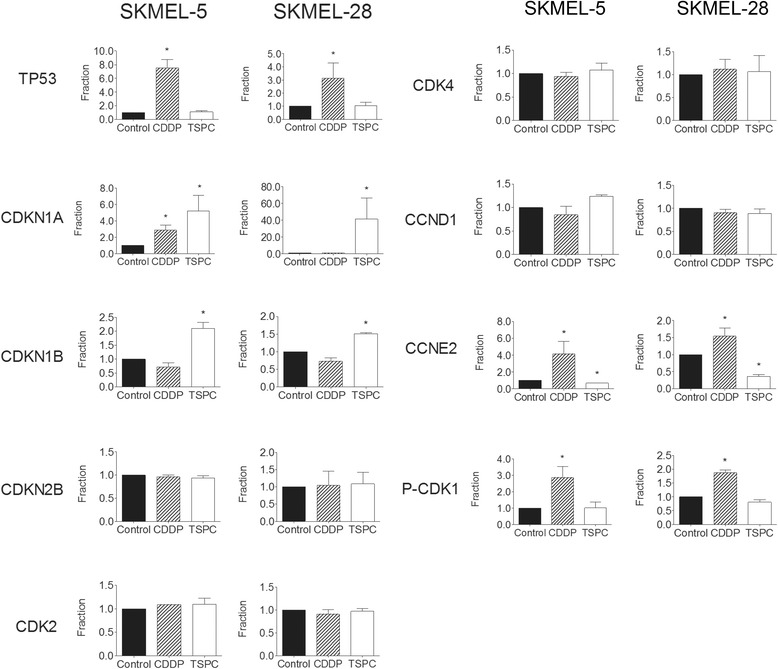
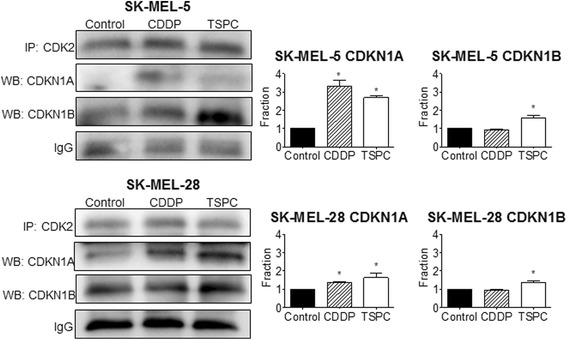
Methods: We aimed to compare the cytotoxic effects of cisplatin and a trans-sulfonamide-platinum-complex (TSPC), in two human melanoma cell lines that differ in their TP53 status: SK-MEL-5, TP53 wild type, and SK-MEL-28, TP53 mutated. We performed cytotoxicity assays with both drugs, alone and in combination, cell cycle analyses, western blotting and immunoprecipitation, and fluorescence immunocytochemistry.
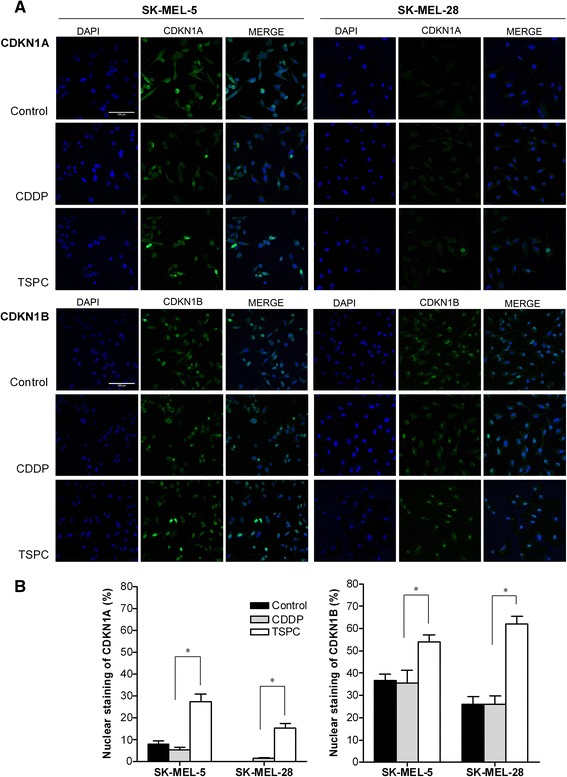
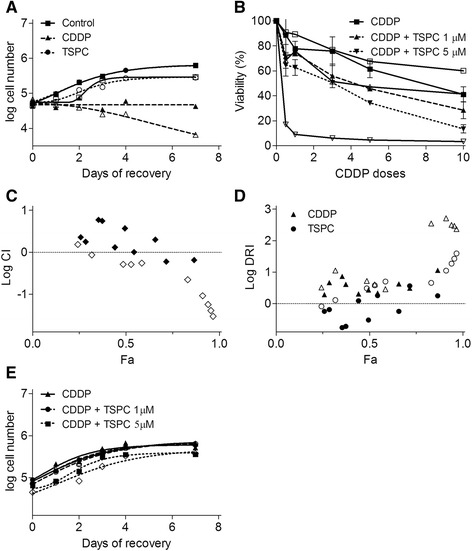
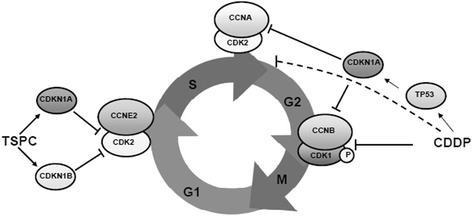
Results: TSPC had similar antiproliferative activity than cisplatin against SK-MEL-5 (3.24 ± 1.08 vs 2.89 ± 1.12 μM) and higher against SK-MEL-28 cells (5.83 ± 1.06 vs 10.17 ± 1.29 μM). Combination of both drugs inhibited proliferation in both cell lines, being especially important in SK-MEL-28, and showing a synergistic effect. In contrast to cisplatin, TSPC caused G1 instead G2/M arrest in both cell lines. Our present findings indicate that the G1 arrest is associated with the induction of CDKN1A and CDKN1B proteins, and that this response is also present in melanoma cells containing TP53 mutated. Also, strong accumulation of CDKN1A and CDKN1B in cells nuclei was seen upon TSPC treatment in both cell lines.
Conclusions: Overall, these findings provide a new promising TSPC compound with in vitro antitumor activity against melanoma cell lines, and with a different mechanism of action from that of cisplatin. Besides, TSPC synergism with cisplatin facilitates its potential use for co-treatment to reduce toxicity and resistance against cisplatin. TSPC remains a promising lead compound for the generation of novel antineoplastic agent and to explore its synergism with other DNA damaging agents.
Keywords: Cell Cycle control; Cisplatin; Mechanisms of action; Melanoma; Mono-Sulfonamide; Transplatin.
Figures
Similar articles
-
Evaluation of novel trans-sulfonamide platinum complexes against tumor cell lines.Eur J Med Chem. 2014 Apr 9;76:360-8. doi: 10.1016/j.ejmech.2014.02.022. Epub 2014 Feb 11. Eur J Med Chem. 2014. PMID: 24589491
-
Adenovirus-mediated E2F-1 gene transfer sensitizes melanoma cells to apoptosis induced by topoisomerase II inhibitors.Cancer Res. 2002 Mar 15;62(6):1776-83. Cancer Res. 2002. PMID: 11912154
-
Macrovipecetin, a C-type lectin from Macrovipera lebetina venom, inhibits proliferation migration and invasion of SK-MEL-28 human melanoma cells and enhances their sensitivity to cisplatin.Biochim Biophys Acta Gen Subj. 2018 Mar;1862(3):600-614. doi: 10.1016/j.bbagen.2017.11.019. Epub 2017 Nov 28. Biochim Biophys Acta Gen Subj. 2018. PMID: 29196192
-
Dimethylfumarate inhibits melanoma cell proliferation via p21 and p53 induction and bcl-2 and cyclin B1 downregulation.Tumour Biol. 2016 Oct;37(10):13627-13635. doi: 10.1007/s13277-016-5285-6. Epub 2016 Jul 29. Tumour Biol. 2016. PMID: 27468725
-
A Candidate Cell-Selective Anticancer Agent.2013 Dec 12 [updated 2014 Sep 18]. In: Probe Reports from the NIH Molecular Libraries Program [Internet]. Bethesda (MD): National Center for Biotechnology Information (US); 2010–. 2013 Dec 12 [updated 2014 Sep 18]. In: Probe Reports from the NIH Molecular Libraries Program [Internet]. Bethesda (MD): National Center for Biotechnology Information (US); 2010–. PMID: 25506970 Free Books & Documents. Review.
Cited by
-
Immune-related lncRNA pairs as novel signature to predict prognosis and immune landscape in melanoma patients.Medicine (Baltimore). 2022 Jan 7;101(1):e28531. doi: 10.1097/MD.0000000000028531. Medicine (Baltimore). 2022. PMID: 35029920 Free PMC article.
-
Metal Chelates of Sulfafurazole Azo Dye Derivative: Synthesis, Structure Affirmation, Antimicrobial, Antitumor, DNA Binding, and Molecular Docking Simulation.Bioinorg Chem Appl. 2023 Apr 22;2023:2239976. doi: 10.1155/2023/2239976. eCollection 2023. Bioinorg Chem Appl. 2023. PMID: 37274083 Free PMC article.
-
Novel Biomarker Genes for Prognosis of Survival and Treatment of Glioma.Front Oncol. 2021 Dec 15;11:667884. doi: 10.3389/fonc.2021.667884. eCollection 2021. Front Oncol. 2021. PMID: 34976783 Free PMC article.
-
"Non-Classical" Platinum Complexes: A Concise Review.Int J Mol Sci. 2025 Jun 28;26(13):6270. doi: 10.3390/ijms26136270. Int J Mol Sci. 2025. PMID: 40650048 Free PMC article. Review.
References
Publication types
MeSH terms
Substances
LinkOut - more resources
Full Text Sources
Other Literature Sources
Medical
Research Materials
Miscellaneous
