

Structural variability and niche differentiation in the rhizosphere and endosphere bacterial microbiome of field-grown poplar trees
- PMID: 28231859
- PMCID: PMC5324219
- DOI: 10.1186/s40168-017-0241-2
Structural variability and niche differentiation in the rhizosphere and endosphere bacterial microbiome of field-grown poplar trees
Abstract
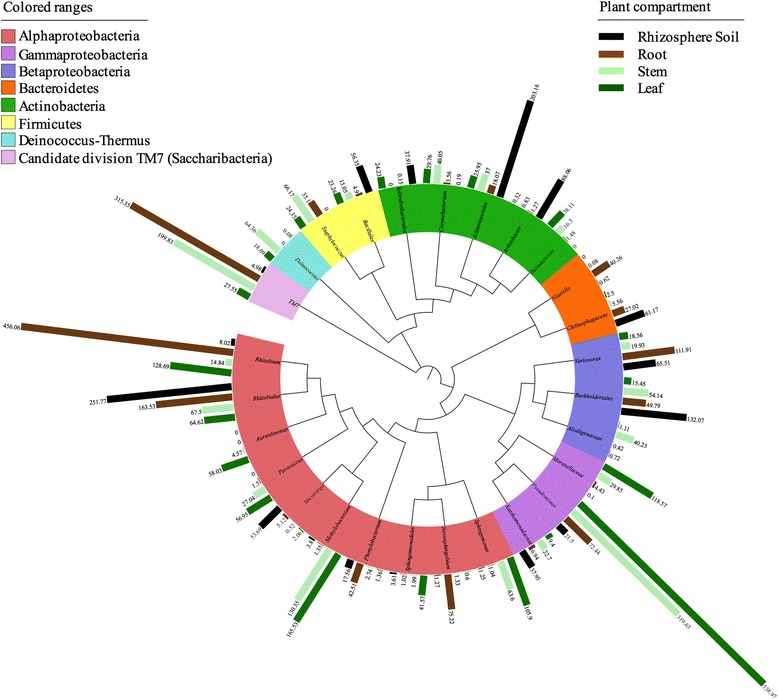
Background: The plant microbiome represents one of the key determinants of plant health and productivity by providing a plethora of functional capacities such as access to low-abundance nutrients, suppression of phytopathogens, and resistance to biotic and/or abiotic stressors. However, a robust understanding of the structural composition of the bacterial microbiome present in different plant microenvironments and especially the relationship between below-ground and above-ground communities has remained elusive. In this work, we addressed hypotheses regarding microbiome niche differentiation and structural stability of the bacterial communities within different ecological plant niches.
Methods: We sampled the rhizosphere soil, root, stem, and leaf endosphere of field-grown poplar trees (Populus tremula × Populus alba) and applied 16S rRNA amplicon pyrosequencing to unravel the bacterial communities associated with the different plant habitats.
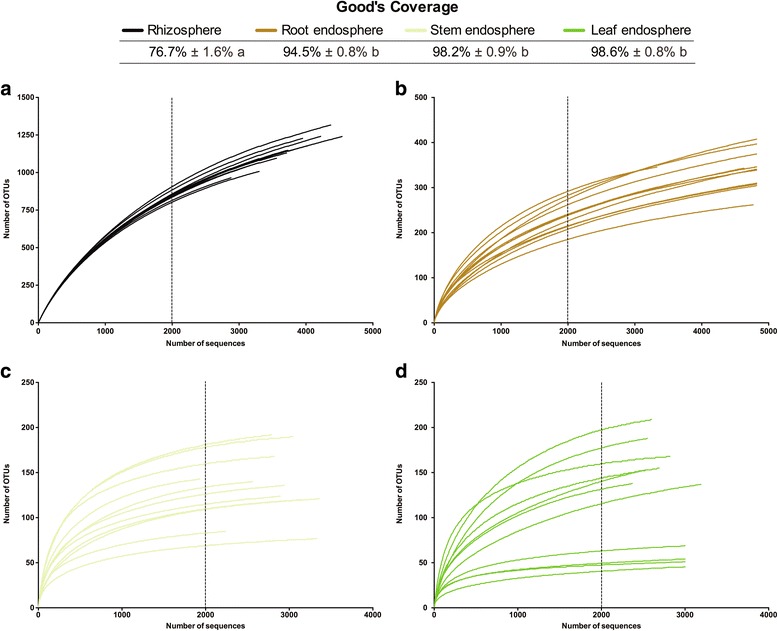
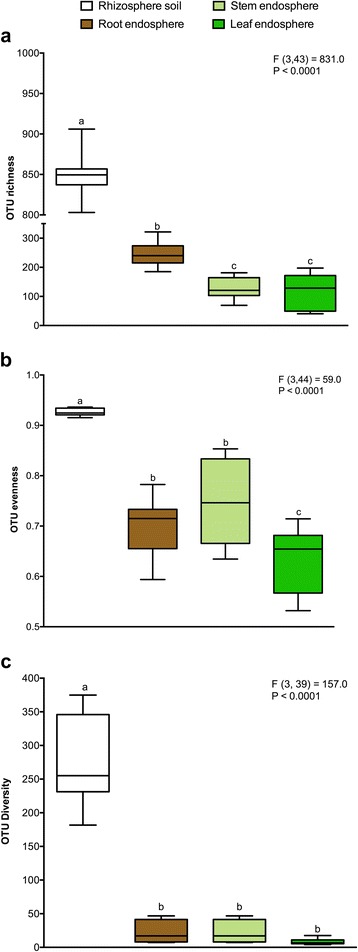
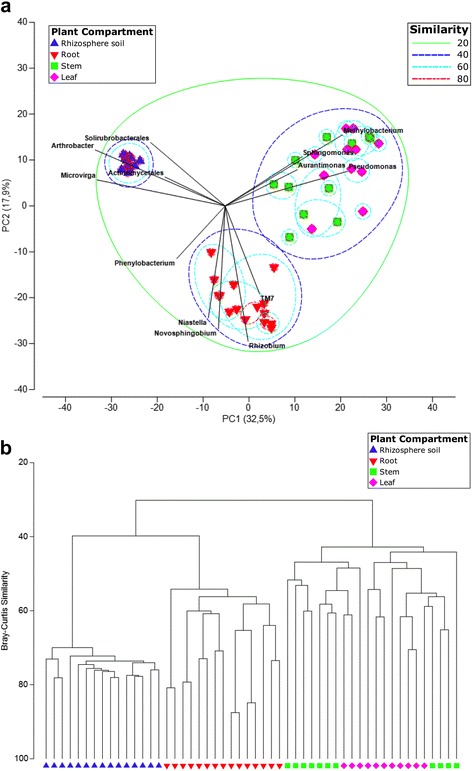
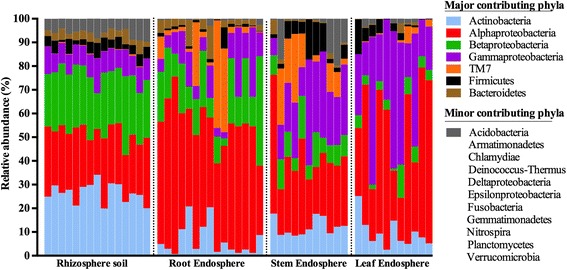
Results: We found that the structural variability of rhizosphere microbiomes in field-grown poplar trees (P. tremula × P. alba) is much lower than that of the endosphere microbiomes. Furthermore, our data not only confirm microbiome niche differentiation reports at the rhizosphere soil-root interface but also clearly show additional fine-tuning and adaptation of the endosphere microbiome in the stem and leaf compartment. Each plant compartment represents an unique ecological niche for the bacterial communities. Finally, we identified the core bacterial microbiome associated with the different ecological niches of Populus.
Conclusions: Understanding the complex host-microbe interactions of Populus could provide the basis for the exploitation of the eukaryote-prokaryote associations in phytoremediation applications, sustainable crop production (bio-energy efficiency), and/or the production of secondary metabolites.
Keywords: 16S rRNA amplicon pyrosequencing; Bacterial microbiome; Endosphere; Microbiome niche differentiation; Populus tremula × Populus alba; Rhizosphere.
Figures
Similar articles
-
Assembly of the Populus Microbiome Is Temporally Dynamic and Determined by Selective and Stochastic Factors.mSphere. 2021 Jun 30;6(3):e0131620. doi: 10.1128/mSphere.01316-20. Epub 2021 Jun 9. mSphere. 2021. PMID: 34106767 Free PMC article.
-
Lignin engineering in field-grown poplar trees affects the endosphere bacterial microbiome.Proc Natl Acad Sci U S A. 2016 Feb 23;113(8):2312-7. doi: 10.1073/pnas.1523264113. Epub 2016 Jan 11. Proc Natl Acad Sci U S A. 2016. PMID: 26755604 Free PMC article.
-
Rhizosphere microbiomes diverge among Populus trichocarpa plant-host genotypes and chemotypes, but it depends on soil origin.Microbiome. 2019 May 18;7(1):76. doi: 10.1186/s40168-019-0668-8. Microbiome. 2019. PMID: 31103040 Free PMC article.
-
Roots shaping their microbiome: global hotspots for microbial activity.Annu Rev Phytopathol. 2015;53:403-24. doi: 10.1146/annurev-phyto-082712-102342. Annu Rev Phytopathol. 2015. PMID: 26243728 Review.
-
Towards a holistic understanding of the beneficial interactions across the Populus microbiome.New Phytol. 2015 Mar;205(4):1424-1430. doi: 10.1111/nph.13133. Epub 2014 Nov 24. New Phytol. 2015. PMID: 25422041 Review.
Cited by
-
Environmental Response to Root Secondary Metabolite Accumulation in Paeonia lactiflora: Insights from Rhizosphere Metabolism and Root-Associated Microbial Communities.Microbiol Spectr. 2022 Dec 21;10(6):e0280022. doi: 10.1128/spectrum.02800-22. Epub 2022 Nov 1. Microbiol Spectr. 2022. PMID: 36318022 Free PMC article.
-
Response of Poplar and Associated Fungal Endophytic Communities to a PAH Contamination Gradient.Int J Mol Sci. 2022 May 25;23(11):5909. doi: 10.3390/ijms23115909. Int J Mol Sci. 2022. PMID: 35682588 Free PMC article.
-
Whole-plant microbiome profiling reveals a novel geminivirus associated with soybean stay-green disease.Plant Biotechnol J. 2022 Nov;20(11):2159-2173. doi: 10.1111/pbi.13896. Epub 2022 Aug 27. Plant Biotechnol J. 2022. PMID: 35869670 Free PMC article.
-
Salt-tolerant endophytic bacterium Enterobacter ludwigii B30 enhance bermudagrass growth under salt stress by modulating plant physiology and changing rhizosphere and root bacterial community.Front Plant Sci. 2022 Aug 2;13:959427. doi: 10.3389/fpls.2022.959427. eCollection 2022. Front Plant Sci. 2022. PMID: 35982708 Free PMC article.
-
Phagotrophic protists preserve antibiotic-resistant opportunistic human pathogens in the vegetable phyllosphere.ISME Commun. 2023 Sep 2;3(1):94. doi: 10.1038/s43705-023-00302-z. ISME Commun. 2023. PMID: 37660098 Free PMC article.
References
Publication types
MeSH terms
Substances
LinkOut - more resources
Full Text Sources
Other Literature Sources
Miscellaneous
