. 2017 May:62:291-305.
doi: 10.1016/j.bbi.2017.02.014. Epub 2017 Feb 21.

Activation of NLRP3 inflammasome by cholesterol crystals in alcohol consumption induces atherosclerotic lesions

Affiliations

Activation of NLRP3 inflammasome by cholesterol crystals in alcohol consumption induces atherosclerotic lesions

P M Abdul Muneer et al. Brain Behav Immun. 2017 May.

Abstract

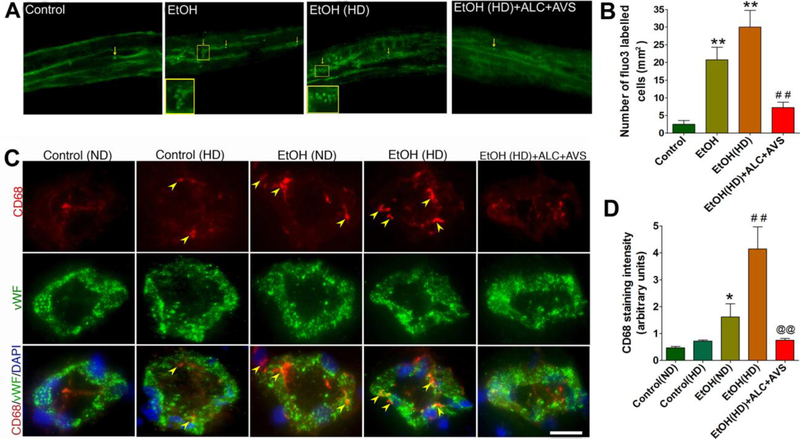
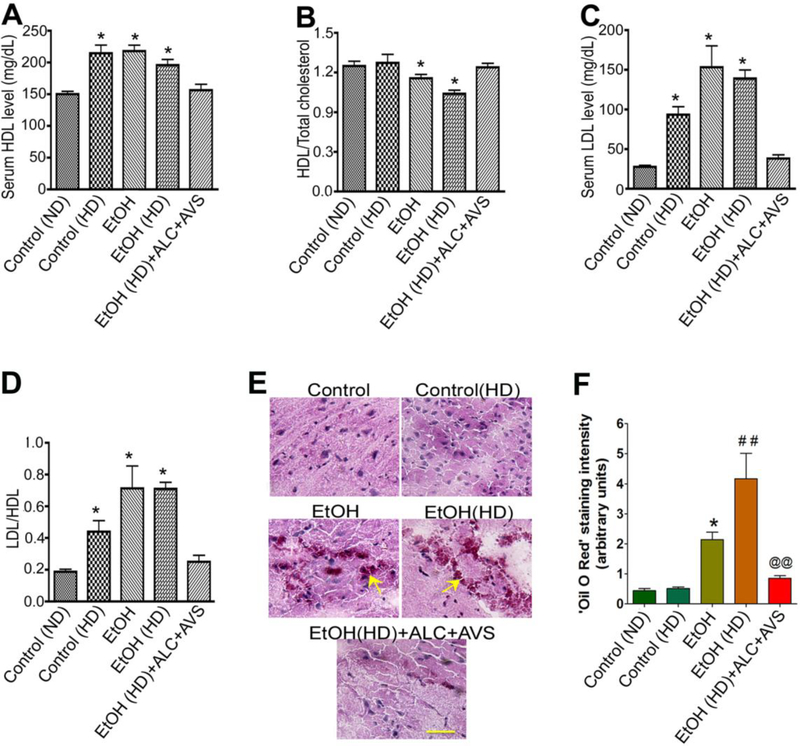
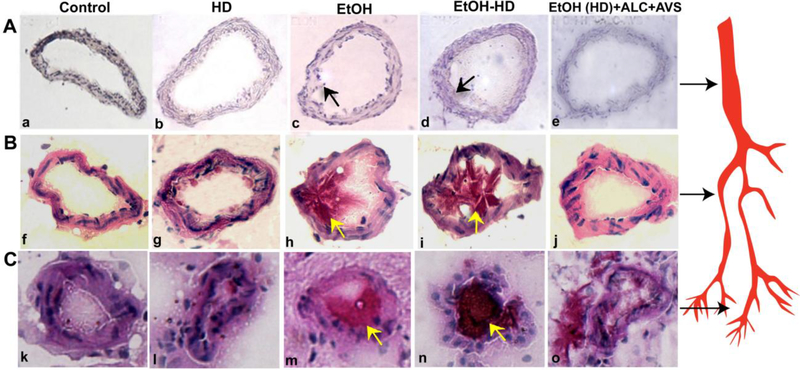
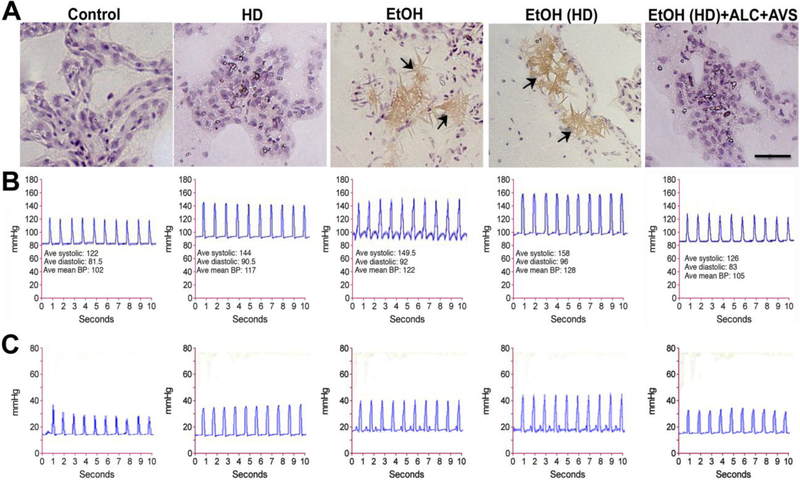
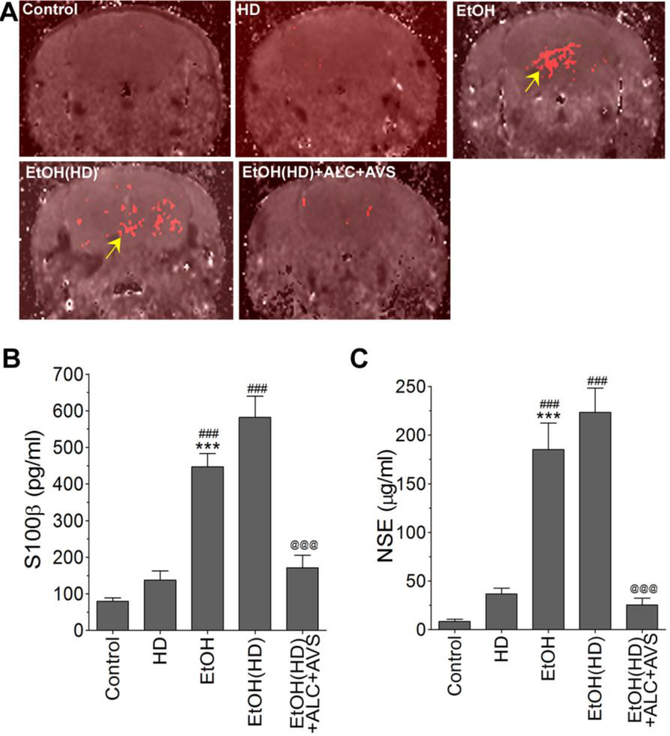
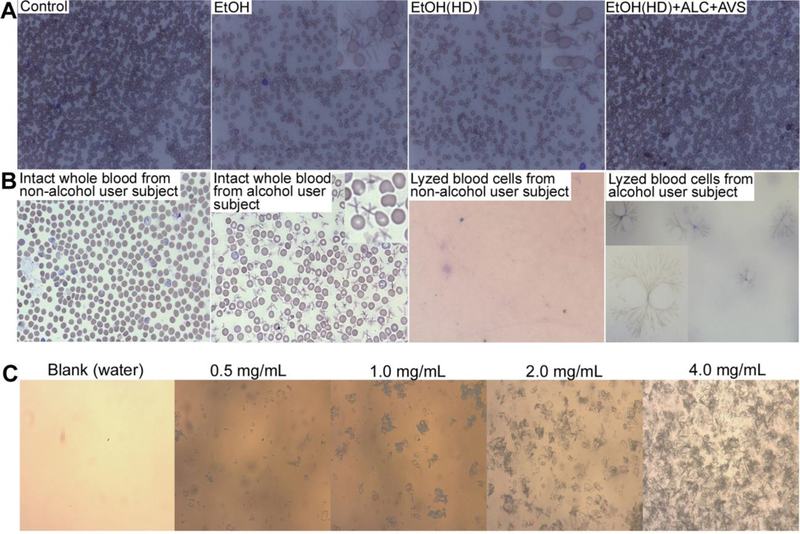
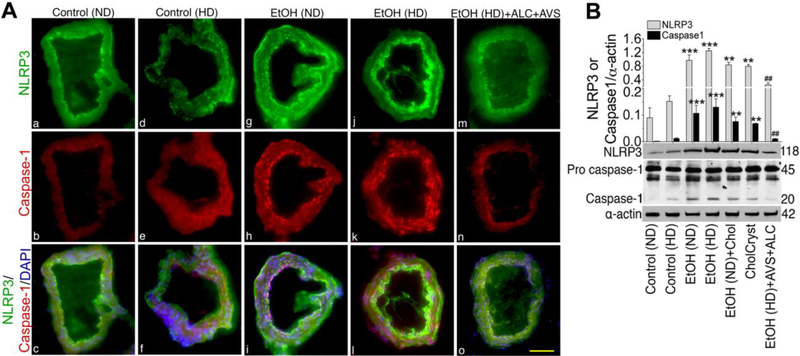
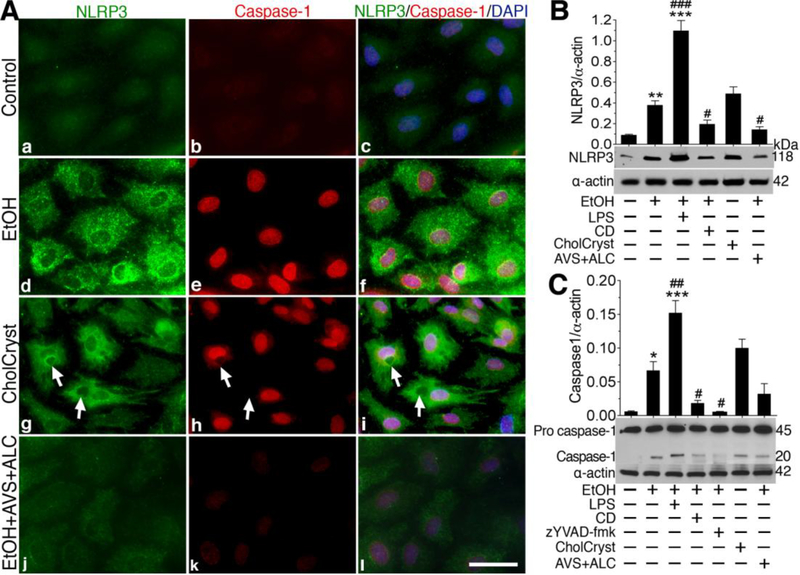
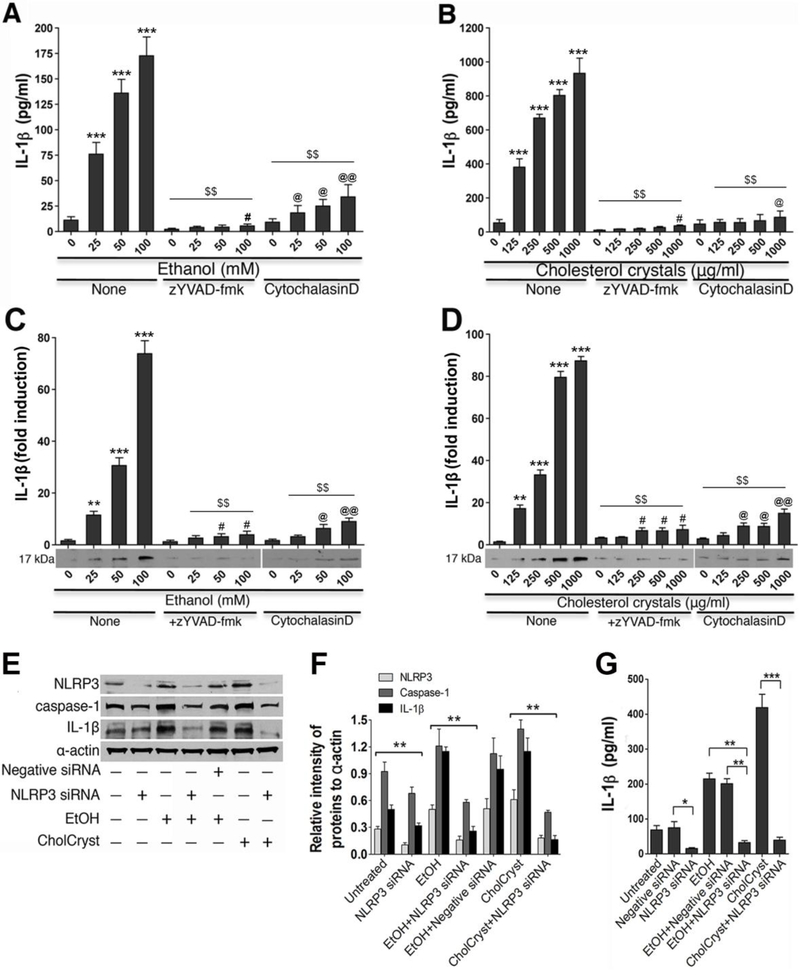
Epidemiological studies showed a strong association between alcoholism and incidence of stroke, for which the underlying causative mechanisms remain to be understood. Here we found that infiltration of immune cells and deposition of cholesterol at the site of brain artery/capillary injury induced atherosclerosis in chronic alcohol (ethanol) consumption in the presence or absence of high-fat diet. Conversion of cholesterol into sharp edges of cholesterol crystals (CCs) in alcohol intake was key to activation of NLRP3 inflammasome, induction of cerebral atherosclerosis, and development of neuropathy around the atherosclerotic lesions. The presence of alcohol was critical for the formation of CCs and development of the neuropathology. Thus, we observed that alcohol consumption elevated the level of plasma cholesterol, deposition and crystallization of cholesterol, as well as activation of NLRP3 inflammasome. This led to arteriole or capillary walls thickening and increase intracranial blood pressure. Distinct neuropathy around the atherosclerotic lesions indicated vascular inflammation as an initial cause of neuronal degeneration. We demonstrated the molecular mechanisms of NLRP3 activation and downstream signaling cascade event in primary culture of human brain arterial/capillary endothelial cells in the setting of dose-/time-dependent effects of alcohol/CCs using NLRP3 gene silencing technique. We also detected CCs in blood samples from alcohol users, which validated the clinical importance of the findings. Finally, combined therapy of acetyl-l-carnitine and Lipitor® prevented deposition of cholesterol, formation of CCs, activation of NLRP3, thickening of vessel walls, and elevation of intracranial blood pressure. We conclude that alcohol-induced accumulation and crystallization of cholesterol activates NLRP3/caspase-1 in the cerebral vessel that leads to early development of atherosclerosis.

Keywords: Alcohol-induced cholesterol crystals; Cerebral atherosclerosis; Intracranial blood pressure; NLRP3 inflammasomes; Therapeutic intervention.


Conflict of interest statement

COMPETING INTERESTS:

The authors have declared that no competing interests exist.

Figures

Figure 1:
Figure 1:. Immune cell adhesion and infiltration in brain arterial vasculature.
(A) Representative images of Fluo-3 labeled macrophages in intact arterioles in control, high-fat diet (HD), ethanol-diet (EtOH), EtOH(HD), EtOH(HD)+ALC+AVS). Cell infiltration on the brain side (basolateral side of arteriole) is highlighted in enlarged images. (B) Bar graphs indicate the number of Fluo-3 labeled cells inthe intact microvessels. (C) Representative images of CD68 positive cells staining in the capillary endothelium that are co-localized with endothelial marker von Willebrand factor (vWF) and cellular nuclei DAPI in rat brain tissue cross-sections. Arrows indicate infiltrated macrophages and the scale bar is 5 μm. (D)Bar graphs indicate CD68 quantification using ImageJ in rat brain microvessels. Data in (B)and (D) are presented as the mean values (± SEM, N = 5).Statistical significance indicates *p<0.05, **p<0.01 compared with control(ND); ##p<0.01 compared with control(HD), and @@p<0.01 compared with EtOH(HD).
Figure 2:
Figure 2:. Serum cholesterol levels in chronic alcohol or high-fat diets intake with/without ALC+AVS.
Serum collected from 12–14 weeks pair fed animal were analyzed for total cholesterol and lipoprotein conjugated cholesterol levels. (A) HDL levels in serum; (B) serum HDL expressed as a ratio of total cholesterol; (C) LDL levels in serum, and (D) LDL level expressed as a ration of HDL. Statistical significance indicates *p<0.05 compared with control and dataare presented as the mean values (± SEM, N = 5/group). See the composition of normal diet (ND) and high fat diet (HD) in methods section.(E)Deposition of cholesterol in brain tissue. The Oil red O staining and microscopy analyses determined the cholesterol deposition in the deep brain frontal corticaltissue sectionsof 8 μm thicknessfrom control, HD, EtOH, EtOH(HD), and EtOH(HD)+ALC+AVS conditions. Scale bar is 5 μm. (F)Quantification of ‘Oil Red O’ staining of cholesterol deposition in the deep brain tissue using ImageJ software in experimental conditions. Data in (B)and (D) are presented as the mean values (± SEM, N = 5).Statistical significance indicates *p<0.05 compared with control(ND); ##p<0.01 compared with control(HD), and @@p<0.01 compared with EtOH(HD).
Figure 3:
Figure 3:. Cholesterol deposition and thickening of the arterial/capillary walls.
Deposition of cholesterol in different segments of the brain vasculature was evaluated by Oil red O staining and microscopy analysesin 8 μm thick brain tissue sections.Representative imaging of cholesterol accumulation and luminal vessel wall thickening in cerebral artery (A a-e), arterioles (B f-j),and capillary (C k-o) from control, high-fat diet (HD), ethanol (EtOH), EtOH(HD), and EtOH(HD)+ALC+AVS. Scale bar is 5 μm, N =5 rats/condition. Arrows indicate the deposition of cholesterol in cerebral artery, arteriole, and capillary. The internal diameters of capillaries in controls or EtOH(HD)+ALC+AVS are 7–10 μm and that of EtOH or EtOH(HD) diets are 5–7 μm. The thickness of the capillary, arteriole or arterial walls in experiment conditions is about 2–3 μm and that of control is about 1–2 μm. The internal diameters of arterioles are about 25 – 40 μm and that of arteries range from 50 – 75 μm. Arrows on the right side of the figure indicate the cerebral artery, arteriole, and capillary segmentation.
Figure 4:
Figure 4:. Normalization of plasma cholesterol prevents formation of cholesterol crystals and hypertension.
(A) Hematoxylin and Eosin (H and E) staining of the whole brain tissue sections shows the formation of cholesterol crystals in mid-frontal capillaries of alcohol diet consumed rats only. (B) The cardiovascular and (C) the intracranial systolic and diastolic blood pressure monitored by 1.2F pressure catheter sensor probe. Note that reduction of arterial/capillary cholesterol levels and CCs formation by ALC+AVS effectively normalized the intracranial blood pressure of alcohol-high fat diet consumed animals to that of control levels. The changes in blood pressure of HD, EtOH, or EtOH(HD) conditions are statistically significant (p<0.05) compare to control or EtOH(HD)+ALC+AVS condition.Scale bar is 5 μm, N = 5 animals per condition.
Figure 5:
Figure 5:. Magnetic resonance brain imaging and BBB permeability assays confirm the leakiness of the BBB due to atherosclerotic lesions in alcohol consumed animals.
(A)Brain infarct volume assessed by MRI gadolinium leakage in control, EtOH, EtOH(HD) and EtOH(HD)+ALC+AVS diets ingested animals. Arrows indicate the atherosclerotic leakage as demonstrated by gadolinium permeability. (B-C)Leaking out of brain matters into the circulation as a result of atherosclerotic lesions was assessed by ELISA assay kits. (B) Detection of S100β in blood serum suggests the leaking out of astrocytic protein marker into the circulation, and (C) detection of NSE in serum suggests the leaking out of brain matter neuronal specific enolase into the circulation. Statistically significant ***p<0.001 compared with control(ND); ###p<0.001 compared with control(HD); and @@@p<0.001 compared with EtOH(HD). Resultsare presented as the mean values (± SEM, N = 5).
Figure 6:
Figure 6:. Giemsa staining and microscopy detection of CCs in human whole blood samples and kinetic profile of CC formation.
(A) Detection of CCc in rat whole blood samples from EtOH normal diet (ND) or EtOH high-fat diet (HD) intake compare to control or EtOH(HD)+ALC+AVS diet consumption where CCs were not observed. (B)First two left images: Distinctive presence of CCs in intact whole blood sample from alcohol user human subjects compare to non-alcohol user. Last two right images: Clusters of long branching CCs aggregates in lyzed whole blood sample from alcohol user compare to non-alcohol user (magnification 20×). Inserts show the enlarged image of CCs in blood cells (magnification 40×). Data are representative image from N = 6/condition.(C) Threshold of CC formation with varying concentrations of cholesterol (0.25 – 4.0 mg/ml) incubated for 2 hours in 1% of ethanol at 37°C. A concentration of 0.25 mg/ml did not yield any traces of CCs.
Figure 7:
Figure 7:. Ethanol induces NLRP3 inflammasomes and activates caspase-1 in rat brain capillaries.
(A).Rat brain capillarystaining of NLRP3 inflammasomes (green, A-a,d,g,j,m) and caspase-1 (red, A-b,e,h,k,n) merged with DAPI (blue, A-c,f,i,l,o) in normal control diet (ND), high-fat diet (HD), EtOH(ND), EtOH(HD), and EtOH(HD)+ALC+AVS conditions. Scale bar indicates 5 μm in all panels. (B). Western blot analysis of NLRP3 and caspase-1 (pro- and mature- caspase) in protein extracted from brain microvessels of chronically administered (12–14 weeks)ND, HD, EtOH(ND), EtOH(HD), and EtOH(HD)+ALC+AVS diets consume rats, or infusionof cholesterolin EtOH(ND) consume rat, or infusion of powdered cholesterol crystals(CholCryst) in control rats.Cholesterol or CholCryst was infused through the catheters implanted into the right common carotid artery. Bar graph results are expressed as ratio of NLRP3 or caspase1 to that of α-actin normalization. Data are presented as mean (±SEM; N = 5). *p<0.05, **p<0.01, ***p<0.001 vs control; #p<0.5, ##p<0.01 vs EtOH (second bar).
Figure 8:
Figure 8:. Cholesterol crystals or ethanol activates NLRP3 inflammasomes and caspase-1 in brain endothelial cell culture.
(A) Immunocytochemistry of NLRP3 (green) and caspase-1 (red) merged with DAPI (blue) are shown in untreated, 24 hours 50 mM EtOH, Cholesterol Crystals (CholCryst, 1 mM), and EtOH+ALC (ALC=1 mg/ml) treated hBECs. Scale bar indicates 20 μm in all panels. B-C)Western blot analysis of NLRP3 (B) and caspase-1 (pro and mature) (C) in 24 hours of EtOH (50 mM), EtOH+LPS (LPS=1 g/mL), EtOH+CD (CD=2 M), EtOH+zYVAD-fmk (zYVAD-fmk, caspase-1 inhibitor, 5 g/ml), CholCryst (1 mM) and EtOH+ALC (ALC=100 M) treated hBECs. Bar graphs show the results that are expressed as ratio of NLRP3 in B and caspase1 in C to that of -actin bands, and values are mean (±SEM; N = 4). *p<0.05, **p<0.01, ***p<0.001 vs control; #p<0.5, ##p<0.01, ###p<0.001 vs EtOH (second bar).
Figure 9 A-D:
Figure 9 A-D:. Dose-dependent effects of ethanol (EtOH) or cholesterol crystals (CCs) on IL-1 secretion due to caspase-1 activation.
The levels of IL-1 secretion in cell culture supernatants and cell lysates were determined by ELISAand Western blot analyses after treating hBECs with various concentrations of EtOH or CCs for 24 hours in the presence or absence of zYVAD-fmk and Cytochalasin D.Dose-dependent effects of EtOH (A)and CCs (B)onIL-1secretion in hBEC cell culture media determined by ELISA kit. Dose-dependent effects of EtOH (C) and CCs(D)onIL-1levels in hBEC cell lysates determined by Western blotting. Bar graphs show the relative levels of IL-1 or immunoreactive band intensity of IL-1 normalized to-actin bandsin respective experiments. Statistical significant **p<0.05,***p<0.001compared with respective controls (O)in EtOH or CCs without zYVAD-fmk or cytochlasinD conditions.#/@p<0.05,@@p<0.01compared with Zero concentration of EtOH or CCs, but in the presence of zYVAD-fmk or cytochlasin D. Results are presented as the mean values (± SEM, N = 6). Figure 9 E-G: Silencing the NLRP3 inflammasome gene attenuated the activation of caspase-1 and release of IL-1in hBEC lysates. Scrambled siRNA hBECs and NLRP3 siRNA hBECs culture were treated with EtOH (50 mM) or CCs (1 mg/ml)for 24 hours for evaluating the changes in NLRP3, Caspase-1 and IL-1 levels. (E) Immunoreactive band representative of NLRP3, Caspase-1, IL-1 and -actin in hBEC lysates from various experimental conditions. (F) Quantification of NLRP3, Caspase-1, or IL-1immunoreactive bands to that of - actin in hBEC lysates. (G) Changes in the levels ofIL-1 in hBEC culture supernatants from respective experimental conditions. Statistical significant *p<0.05 and **p<0.01 compared with corresponding bars. The resultsare presented as the mean values (± SEM, N = 4).

References

    1. Donnan GA, Fisher M, Macleod M, Davis SM (2008) Stroke. Lancet 371: 1612–1623. - PubMed
    1. Jerrard-Dunne P, Sitzer M, Risley P, Steckel DA, Buehler A, et al. (2003) Interleukin-6 promoter polymorphism modulates the effects of heavy alcohol consumption on early carotid artery atherosclerosis: the Carotid Atherosclerosis Progression Study (CAPS). Stroke 34: 402–407. - PubMed
    1. Kiechl S, Willeit J, Rungger G, Egger G, Oberhollenzer F, et al. (1998) Alcohol consumption and atherosclerosis: what is the relation? Prospective results from the Bruneck Study. Stroke 29: 900–907. - PubMed
    1. Mostofsky E, Burger MR, Schlaug G, Mukamal KJ, Rosamond WD, et al. (2010) Alcohol and acute ischemic stroke onset: the stroke onset study. Stroke 41: 1845–1849. - PMC - PubMed
    1. Patra J, Taylor B, Irving H, Roerecke M, Baliunas D, et al. (2010) Alcohol consumption and the risk of morbidity and mortality for different stroke types-a systematic review and meta-analysis. BMC Public Health 10: 258. - PMC - PubMed