Gene expression profiling in persons with multiple chemical sensitivity before and after a controlled n-butanol exposure session
- PMID: 28232466
- PMCID: PMC5337747
- DOI: 10.1136/bmjopen-2016-013879
Gene expression profiling in persons with multiple chemical sensitivity before and after a controlled n-butanol exposure session
Abstract
Objectives: To investigate the pathophysiological pathways leading to symptoms elicitation in multiple chemical sensitivity (MCS) by comparing gene expression in MCS participants and healthy controls before and after a chemical exposure optimised to cause symptoms among MCS participants.The first hypothesis was that unexposed and symptom-free MCS participants have similar gene expression patterns to controls and a second hypothesis that MCS participants can be separated from controls based on differential gene expression upon a controlled n-butanol exposure.
Design: Participants were exposed to 3.7 ppm n-butanol while seated in a windowed exposure chamber for 60 min. A total of 26 genes involved in biochemical pathways found in the literature have been proposed to play a role in the pathogenesis of MCS and other functional somatic syndromes were selected. Expression levels were compared between MCS and controls before, within 15 min after being exposed to and 4 hours after the exposure.
Settings: Participants suffering from MCS and healthy controls were recruited through advertisement at public places and in a local newspaper.
Participants: 36 participants who considered themselves sensitive were prescreened for eligibility. 18 sensitive persons fulfilling the criteria for MCS were enrolled together with 18 healthy controls.
Outcome measures: 17 genes showed sufficient transcriptional level for analysis. Group comparisons were conducted for each gene at the 3 times points and for the computed area under the curve (AUC) expression levels.
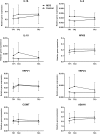
Results: MCS participants and controls displayed similar gene expression levels both at baseline and after the exposure and the computed AUC values were likewise comparable between the 2 groups. The intragroup variation in expression levels among MCS participants was noticeably greater than the controls.
Conclusions: MCS participants and controls have similar gene expression levels at baseline and it was not possible to separate MCS participants from controls based on gene expression measured after the exposure.
Keywords: Chemical exposure; Exposure chamber; Gene expression; Multiple Chemical Sensitivity; qPCR.
Published by the BMJ Publishing Group Limited. For permission to use (where not already granted under a licence) please go to http://www.bmj.com/company/products-services/rights-and-licensing/.
Conflict of interest statement
Figures


Similar articles
-
Inflammatory Mediator Profiling of n-butanol Exposed Upper Airways in Individuals with Multiple Chemical Sensitivity.PLoS One. 2015 Nov 23;10(11):e0143534. doi: 10.1371/journal.pone.0143534. eCollection 2015. PLoS One. 2015. PMID: 26599866 Free PMC article. Clinical Trial.
-
Chemosensory perception, symptoms and autonomic responses during chemical exposure in multiple chemical sensitivity.Int Arch Occup Environ Health. 2016 Jan;89(1):79-88. doi: 10.1007/s00420-015-1053-y. Epub 2015 Apr 28. Int Arch Occup Environ Health. 2016. PMID: 25917753 Clinical Trial.
-
Genetic susceptibility factors for multiple chemical sensitivity revisited.Int J Hyg Environ Health. 2010 Mar;213(2):131-9. doi: 10.1016/j.ijheh.2010.02.001. Epub 2010 Feb 24. Int J Hyg Environ Health. 2010. PMID: 20185366
-
White paper: Neuropsychiatric aspects of sensitivity to low-level chemicals: a neural sensitization model.Toxicol Ind Health. 1994 Jul-Oct;10(4-5):277-312. Toxicol Ind Health. 1994. PMID: 7778100 Review.
-
Multiple chemical sensitivity syndrome: a clinical perspective. I. Case definition, theories of pathogenesis, and research needs.J Occup Med. 1994 Jul;36(7):718-30. J Occup Med. 1994. PMID: 7931736 Review.
Cited by
-
A case report of idiopathic environmental intolerance: A controversial and current issue.Clin Case Rep. 2019 Nov 26;8(1):79-85. doi: 10.1002/ccr3.2535. eCollection 2020 Jan. Clin Case Rep. 2019. PMID: 31998492 Free PMC article.
-
Olfactory-Related Quality of Life in Multiple Chemical Sensitivity: A Genetic-Acquired Factors Model.Int J Mol Sci. 2019 Dec 25;21(1):156. doi: 10.3390/ijms21010156. Int J Mol Sci. 2019. PMID: 31881664 Free PMC article.
-
Multiple Chemical Sensitivity.Brain Sci. 2021 Dec 29;12(1):46. doi: 10.3390/brainsci12010046. Brain Sci. 2021. PMID: 35053790 Free PMC article. Review.
-
Perspectives on multisensory perception disruption in idiopathic environmental intolerance: a systematic review.Int Arch Occup Environ Health. 2018 Nov;91(8):923-935. doi: 10.1007/s00420-018-1346-z. Epub 2018 Aug 7. Int Arch Occup Environ Health. 2018. PMID: 30088144
-
Chemical Intolerance and Mast Cell Activation: A Suspicious Synchronicity.J Xenobiot. 2023 Nov 12;13(4):704-718. doi: 10.3390/jox13040045. J Xenobiot. 2023. PMID: 37987446 Free PMC article.
References
Publication types
MeSH terms
Substances
LinkOut - more resources
Full Text Sources
Other Literature Sources
