. 2017 Apr 7;292(14):5884-5897.
doi: 10.1074/jbc.M117.776914. Epub 2017 Feb 22.

The antagonistically bifunctional retinoid oxidoreductase complex is required for maintenance of all- trans-retinoic acid homeostasis

Affiliations

The antagonistically bifunctional retinoid oxidoreductase complex is required for maintenance of all- trans-retinoic acid homeostasis

Olga V Belyaeva et al. J Biol Chem. .

Abstract

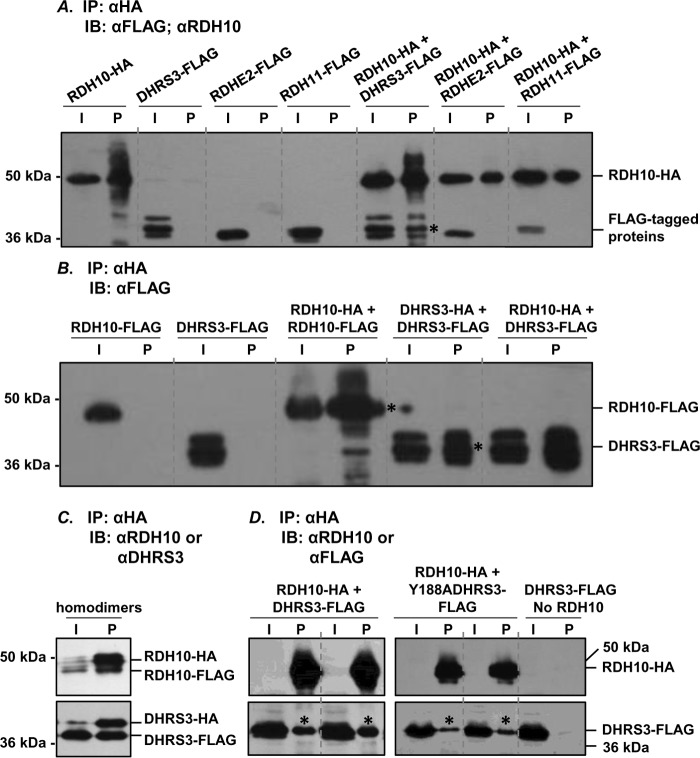
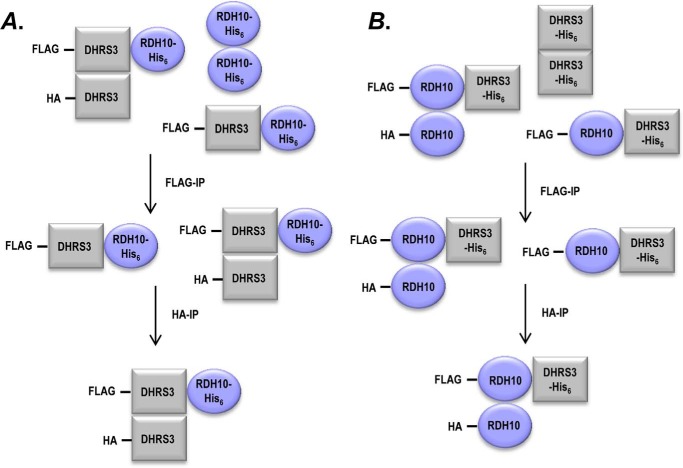
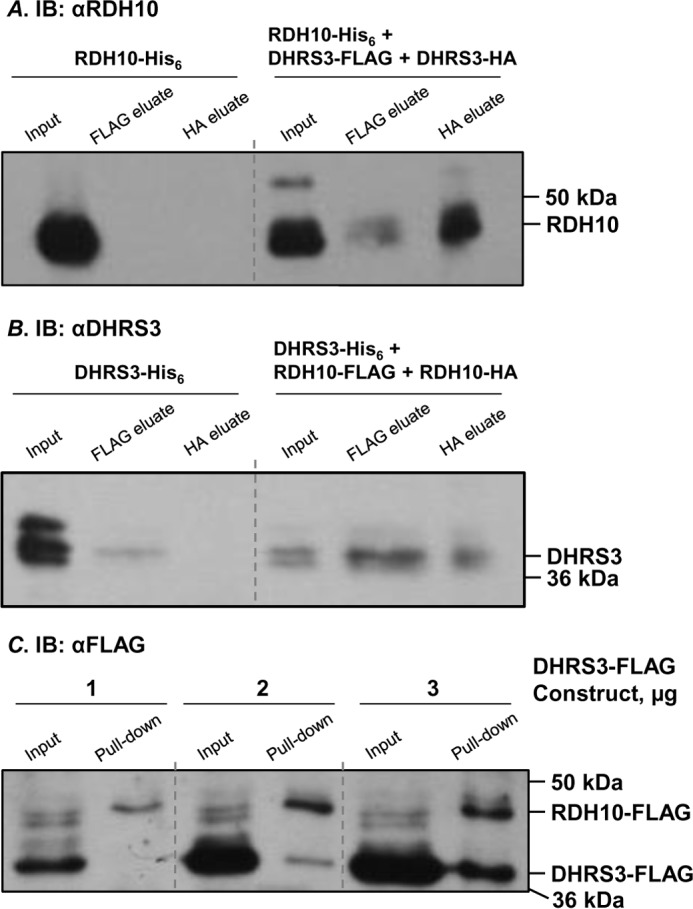
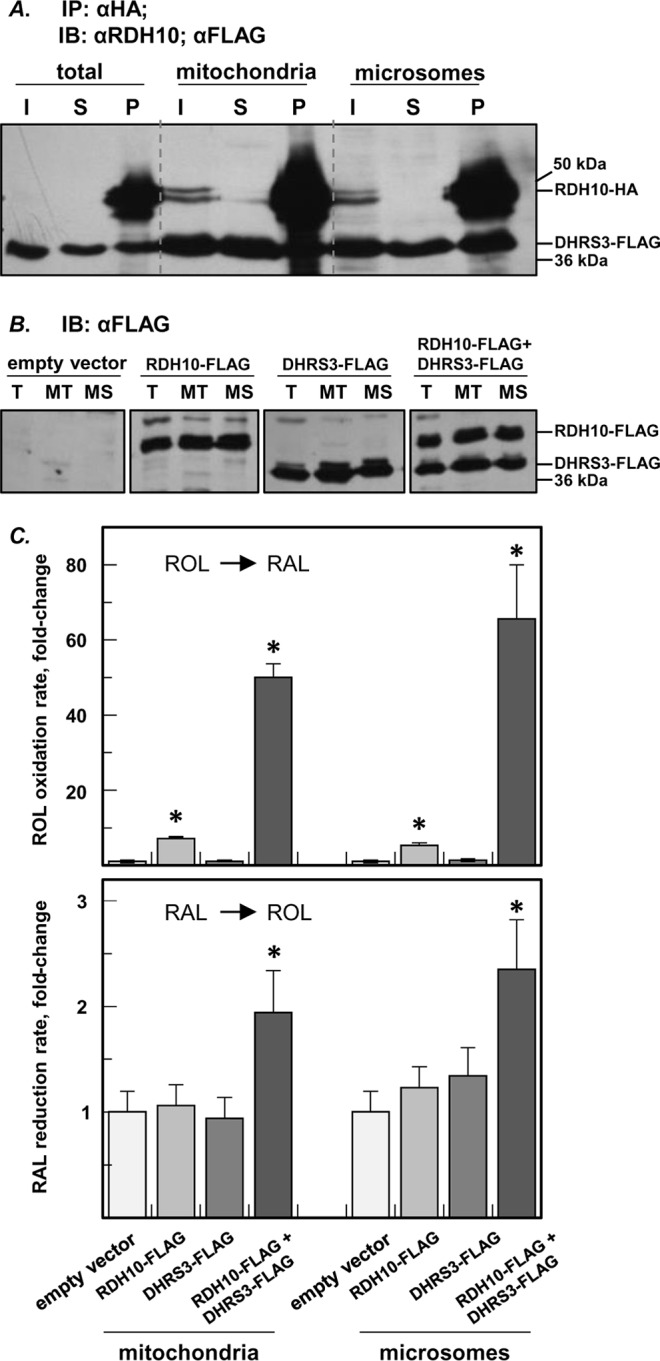
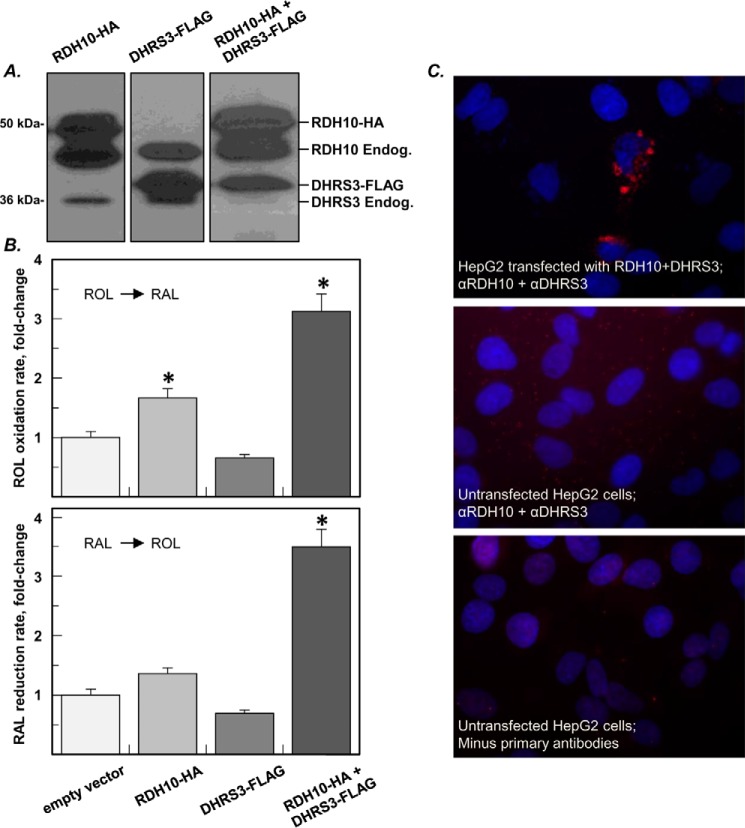
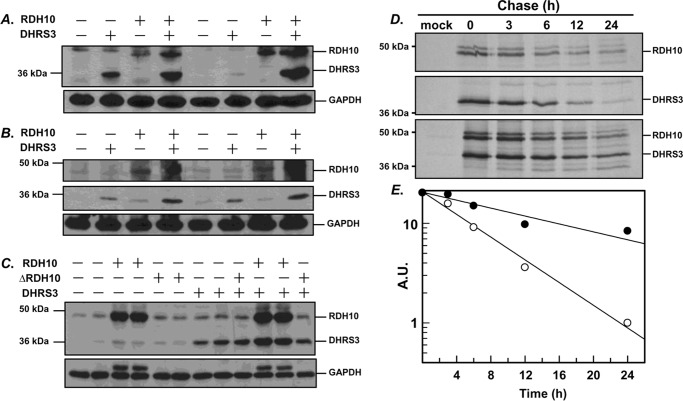
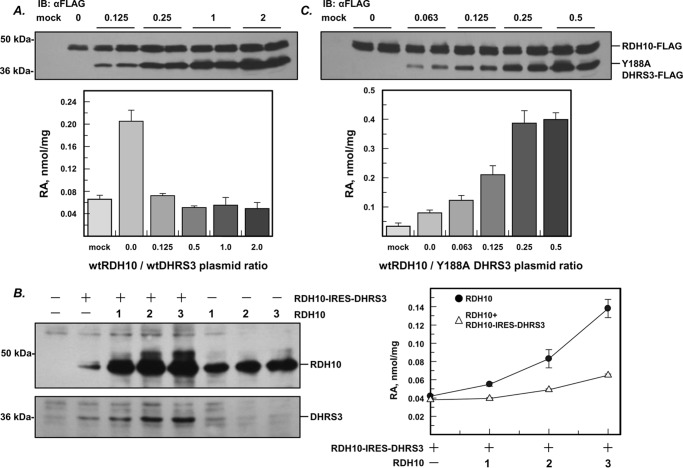
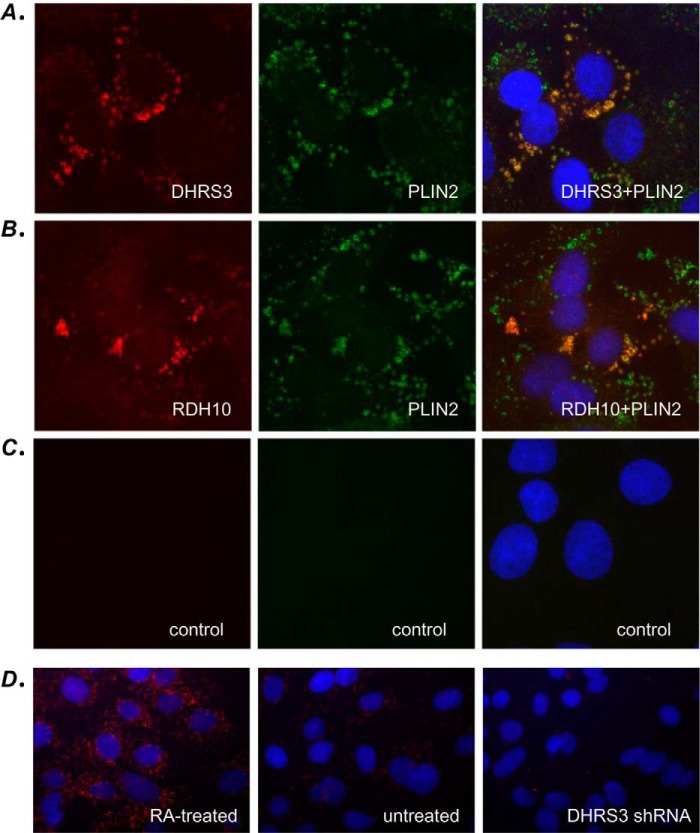
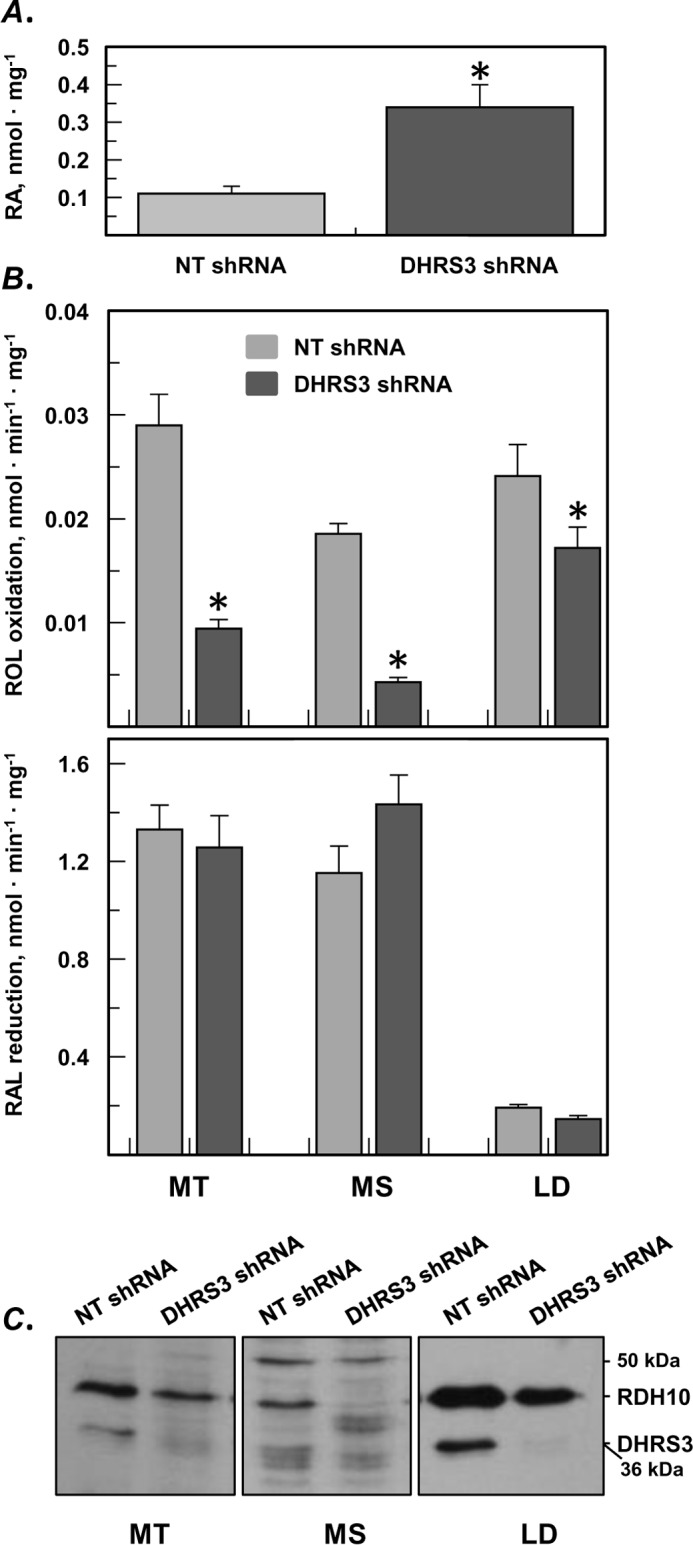
All-trans-retinoic acid (RA), a bioactive derivative of vitamin A, exhibits diverse effects on gene transcription and non-genomic regulatory pathways. The steady-state levels of RA are therefore tightly controlled, but the mechanisms responsible for RA homeostasis are not fully understood. We report a molecular mechanism that allows cells to maintain a stable rate of RA biosynthesis by utilizing a biological circuit generated by a bifunctional retinoid oxidoreductive complex (ROC). We show that ROC is composed of at least two subunits of NAD+-dependent retinol dehydrogenase 10 (RDH10), which catalyzes the oxidation of retinol to retinaldehyde, and two subunits of NADPH-dependent dehydrogenase reductase 3 (DHRS3), which catalyzes the reduction of retinaldehyde back to retinol. RDH10 and DHRS3 also exist as homo-oligomers. When complexed, RDH10 and DHRS3 mutually activate and stabilize each other. These features of ROC ensure that the rate of RA biosynthesis in whole cells is largely independent of the concentration of the individual ROC components. ROC operates in various subcellular fractions including microsomes, mitochondria, and lipid droplets; however, lipid droplets display weaker mutual activation between RDH10 and DHRS3, suggesting reduced formation of ROC. Importantly, disruption of the ROC-generated circuit by a knockdown of DHRS3 results in an increased flux through the RA biosynthesis pathway and elevated RA levels despite the decrease in RDH10 protein destabilized by the absence of DHRS3, hence demonstrating a loss of control. Thus, the bifunctional nature of ROC provides the RA-based signaling system with robustness by safeguarding appropriate RA concentration despite naturally occurring fluctuations in RDH10 and DHRS3.

Keywords: dehydrogenase; homeostasis; reductase; retinoic acid; retinol; vitamin A.


Conflict of interest statement

The authors declare that they have no conflicts of interest with the contents of this article

Figures

FIGURE 1.
FIGURE 1.
RDH10 and DHRS3 form hetero-oligomers and homo-oligomers. A, Sf9 microsomes (30 μg) containing the indicated proteins were solubilized and processed for immunoprecipitation of HA-tagged RDH10. 2 μg of microsomes were used for input. RDHE2 and RDH11 served as negative controls. Binding of RDH10-HA to agarose was confirmed by staining with RDH10 antibodies (1:3000). FLAG-tagged binding partners were detected using FLAG antibody (1:3000) after separation in 12% SDS-PAGE. B, homo-oligomers of RDH10 and DHRS3 in Sf9 cells microsomes were detected as described in A. Note that RDH10-FLAG and DHRS3-FLAG do not associate with anti-HA-agarose in the absence of HA-tagged partners. Microsomes containing RDH10-HA and DHRS3-FLAG were utilized as positive controls for protein-protein interactions. C and D, HEK 293 cells were transfected with combinations of HA- and FLAG-tagged constructs as indicated. Pulldowns were performed as described in A. RDH10 and DHRS3 oligomers were detected using RDH10 or DHRS3 antibodies (C), which allowed simultaneous visualization of both HA-tagged and FLAG-tagged variants. Note that RDH10-HA was expressed at lower levels than RDH10-FLAG (C) and was below the detection limit in the input (∼11 μg) from total cell lysate (D). Negative control DHRS3-FLAG expressed alone did not bind to agarose and served as a control for nonspecific binding (D). I, input; IB, immunoblot; IP, immunoprecipitation; P, pulldown. Pulled down proteins are indicated by asterisks.
FIGURE 2.
FIGURE 2.
A diagram of sequential co-immunoprecipitation scheme. Proteins carrying three different tags (DHRS3-FLAG, DHRS3-HA, and RDH10-His6 in A and RDH10-FLAG, RDH10-HA, and DHRS3-His6 in B) were co-expressed in Sf9 cells. Lysates of Sf9 microsomes were immunoprecipitated with anti-FLAG agarose beads. The bound fraction was eluted from beads and subjected to the second round of immunoprecipitation with anti-HA-agarose. The eluate from anti-HA-agarose was analyzed by Western blotting for the presence of the protein carrying the third tag using RDH10 or DHRS3 antibodies. The presence of the His-tagged proteins in the eluates from anti-HA-agarose after two rounds of immunoprecipitation indicates that the complex contains at least three subunits.
FIGURE 3.
FIGURE 3.
RDH10-DHRS3 hetero-oligomer is larger than a dimer. A, DHRS3-His6 was expressed in Sf9 cells alone or in combination with RDH10-FLAG and RDH10-HA. Solubilized microsomes (200 μg) were incubated with ANTI-FLAG M2 affinity gel. Bound proteins were eluted with FLAG peptide and applied to anti-HA-agarose. Final eluate was probed with DHRS3 antibodies after separation in 10% SDS-PAGE. B, RDH10-His6 was expressed in Sf9 cells alone or in combination with DHRS3-FLAG and DHRS3-HA. Two sequential rounds of immunoprecipitation were performed as described in A. Final eluate was probed with RDH10 antibodies. For immunoblotting in A and B, 2 μg of microsomes were loaded for input; ∼20% of eluate from anti-FLAG M2 affinity gel for FLAG eluate; and 100% of the eluate from anti-HA-agarose for HA eluate. C, HEK 293 cells were co-transfected with 1 μg of RDH10-HA, 1 μg of RDH10-FLAG, and increasing amounts of DHRS3-FLAG expressing construct (1, 2, and 3 μg as indicated). Both RDH10-FLAG and DHRS3-FLAG fusion proteins were detected using FLAG antibody. Pulldown assays of RDH10-HA show that a large excess of DHRS3-FLAG protein is required for efficient formation of DHRS3-RDH10 hetero-oligomers. Note the increase in the ratio between DHRS3-FLAG/RDH10-FLAG in the pulldown fraction from 1 to 3 μg of DHRS3 construct. The increase in RDH10-FLAG is likely due to the stabilizing effect of DHRS3 protein as shown in Fig. 6. IB, immunoblot.
FIGURE 4.
FIGURE 4.
RDH10-DHRS3 hetero-oligomerization occurs in various subcellular fractions. A, the interaction between RDH10-HA and DHRS3-FLAG proteins in mitochondria (∼10 μg) and microsomes (∼10 μg) from HEK 293 cells was analyzed by pulldown assays. I, input; S, supernatant (unbound); P, pulldown. Note that in lanes I of A, RDH10-HA (upper band) is below detection limit in the input (∼11 μg) from total cell lysate but is much more intense in lane P, because all of HA eluate (including all of the bound RDH10-HA bait) was loaded on the gel to ensure reliable detection of the co-immunoprecipitated DHRS3-FLAG (lower band). B, Western blotting analysis of RDH10-FLAG and DHRS3-FLAG expressed separately or together in HEK 293 cells for activity assays of subcellular fractions. T, total lysate; MT, mitochondria; MS, microsomes. C, oxidation of retinol (ROL) to retinaldehyde (RAL) and reduction of retinaldehyde to retinol by HEK 293 mitochondria and microsomes containing RDH10-FLAG or DHRS3-FLAG alone or in combination. The rates are normalized to cells transfected with empty vector (means ± S.D.). *, p < 0.05, n = 3. Note that in both subcellular fractions co-expression of RDH10 and DHRS3 results in an increase of retinol oxidizing activity in comparison with cells expressing RDH10 alone, and overexpression of DHRS3 results in the increase of retinaldehyde reductive activity only in the presence of RDH10. This mutual activation confirms the interaction between RDH10 and DHRS3 in both fractions. IB, immunoblot; IP, immunoprecipitation.
FIGURE 5.
FIGURE 5.
The mutual activation of RDH10 and DHRS3 is reduced in lipid droplets. A, Western blotting analysis of lipid droplets from HEK 293 cells transfected with RDH10-HA or DHRS3-FLAG constructs separately and in combination. Immunoblotting was performed using RDH10 and DHRS3 antibodies, which detect endogenous (Endog.) RDH10 and DHRS3 in addition to ectopically expressed proteins. B, oxidation of retinol (ROL) and reduction of retinaldehyde (RAL) by lipid droplets (means ± S.D., n = 3). *, p < 0.05. C, proximity ligation assay (red signal) shows direct protein-protein interaction between RDH10 and DHRS3 expressed in HepG2 cells.
FIGURE 6.
FIGURE 6.
The half-lives of RDH10 and DHRS3 proteins are extended when they are co-expressed. A–C, CHO cells (A), HepG2 cells (B), and HEK 293 cells (C) were transfected in replicates with vectors expressing RDH10 or DHRS3 alone or in combination. Western blotting analysis was performed using RDH10 and DHRS3 antibodies (both at 1:2,000). GAPDH served as a loading control. ΔRDH10 is a construct that lacks amino acids 85–109 and has the same mobility as DHRS3. D, autoradiography of radiolabeled DHRS3-HA and RDH10-HA expressed in HEK 293 cells separately or together. E, the band intensities at different time points were determined by densitometry and used to calculate the half-lives. A.U., absolute units calculated as percentage of initial band intensity.
FIGURE 7.
FIGURE 7.
Antagonistically bifunctional activity of RDH10-DHRS3 complex provides independence from fluctuations in the levels of individual components. A, Western blotting and activity analysis of HEK 293 cells co-transfected with a fixed amount of RDH10-FLAG construct and increasing amounts of DHRS3-FLAG construct. The ratio of DHRS3/RDH10 plasmid varied from 0 to 2 (μg/μg), as indicated. RA production was determined by HPLC after incubating the cells with 2 μm retinol for 9 h (means ± S.D., n = 3). B, HEK 293 cells were transfected with increasing amounts of RDH10-expressing construct (1–3 μg as indicated) separately or together with a fixed amount of bicistronic vector (RDH10-IRES-DHRS3). RA production was measured as in A. Note that RA production levels in the cells co-transfected with RDH10 and bicistronic vector remain stable despite the gradual increase in RDH10 protein. C, Western blotting and activity analysis of HEK 293 cells co-transfected with a fixed amount of RDH10-FLAG and increasing amounts of Y188A DHRS3-FLAG. Note the gradual increase in RA production, reflecting the loss of homeostasis. IB, immunoblot.
FIGURE 8.
FIGURE 8.
Endogenous RDH10 and DHRS3 proteins co-localize with PLIN2 in HepG2 cells. Immunocytochemistry of wild-type HepG2 cells was performed using a mixture of rabbit DHRS3 antibodies and chicken PLIN2 antibodies (A) or rabbit RDH10 antibodies and chicken PLIN2 antibodies (B). The signal was visualized after subsequent incubation with Alexa Fluor 594-conjugated anti-rabbit antibody (red dye) and Alexa Fluor 488-conjugated anti-chicken antibody (green dye). C, controls without primary antibodies. D, immunolocalization of DHRS3 in HepG2 cells treated with RA (10 nm), untreated cells, or cells stably transfected with DHRS3 shRNA. Note the gradual decrease in signal from RA-treated cells to DHRS3-silenced cells.
FIGURE 9.
FIGURE 9.
Endogenous RDH10 protein is reduced in the absence of DHRS3 but produces more RA because of disruption of the circuit. A, HepG2 cells stably transfected with shRNA targeting DHRS3 produce more RA than cells transfected with non-targeting (NT) shRNA. B, in vitro activities of subcellular fractions isolated from DHRS3-silenced HepG2 cells versus control cells (means ± S.D., n = 3). *, p < 0.05. Note the decrease in the retinol dehydrogenase activity of mitochondria (MT), microsomes (MS), and lipid droplets (LD) from DHRS3-silenced cells. C, Western blotting analysis of endogenous RDH10 and DHRS3 shows decreased levels of both proteins in subcellular fractions (50 μg each) of DHRS3-silenced HepG2 cells. ROL, retinol; RAL, retinaldehyde.

References

    1. Al Tanoury Z., Piskunov A., and Rochette-Egly C. (2013) Vitamin A and retinoid signaling: genomic and nongenomic effects. J. Lipid Res. 54, 1761–1775 - PMC - PubMed
    1. Clagett-Dame M., and Knutson D. (2011) Vitamin A in reproduction and development. Nutrients 3, 385–428 - PMC - PubMed
    1. Kedishvili N. Y. (2013) Enzymology of retinoic acid biosynthesis and degradation. J. Lipid Res. 54, 1744–1760 - PMC - PubMed
    1. Ross A. C., and Zolfaghari R. (2011) Cytochrome P450s in the regulation of cellular retinoic acid metabolism. Annu. Rev. Nutr. 31, 65–87 - PMC - PubMed
    1. O'Byrne S. M., and Blaner W. S. (2013) Retinol and retinyl esters: biochemistry and physiology. J. Lipid Res. 54, 1731–1743 - PMC - PubMed

Publication types

MeSH terms

LinkOut - more resources