

Pharmacokinetic Analysis of Dynamic 18F-Fluoromisonidazole PET Data in Non-Small Cell Lung Cancer
- PMID: 28232611
- PMCID: PMC5450365
- DOI: 10.2967/jnumed.116.180422
Pharmacokinetic Analysis of Dynamic 18F-Fluoromisonidazole PET Data in Non-Small Cell Lung Cancer
Abstract
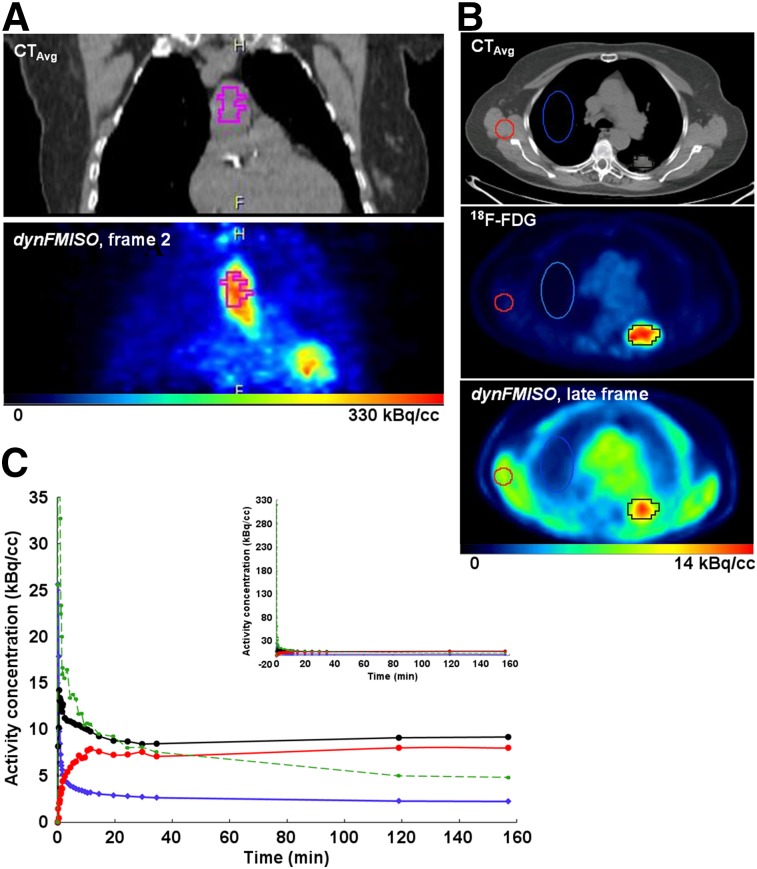
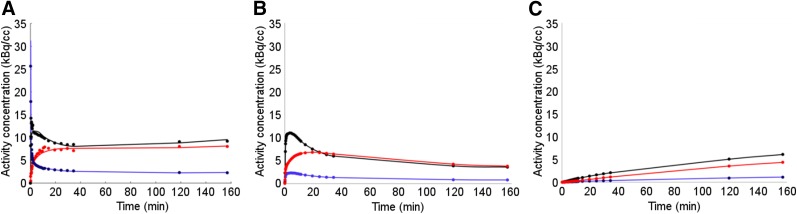
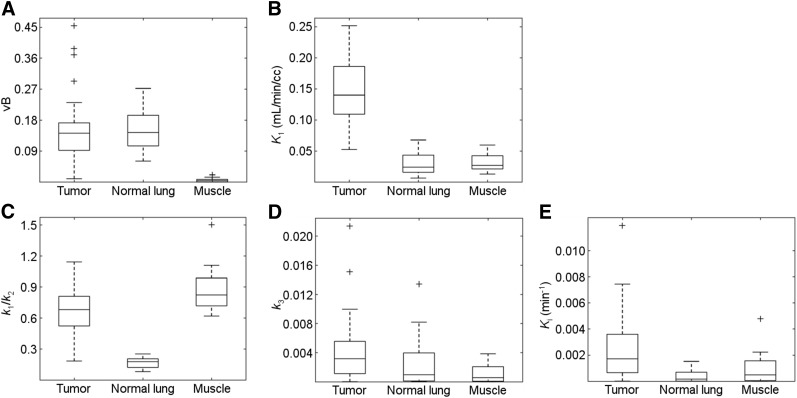
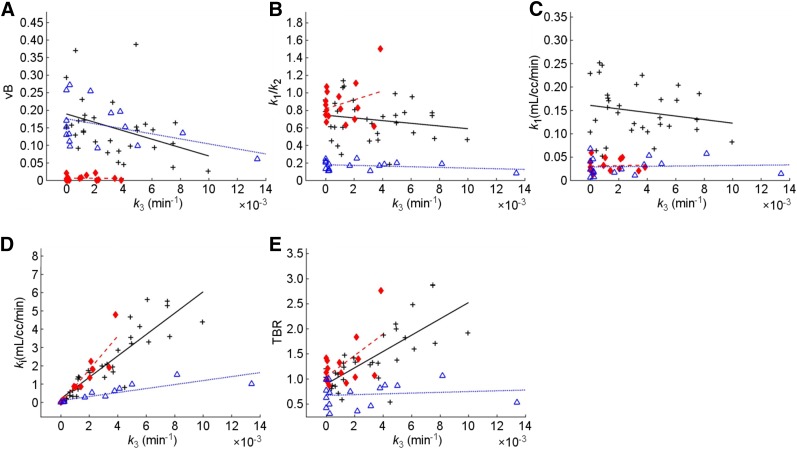
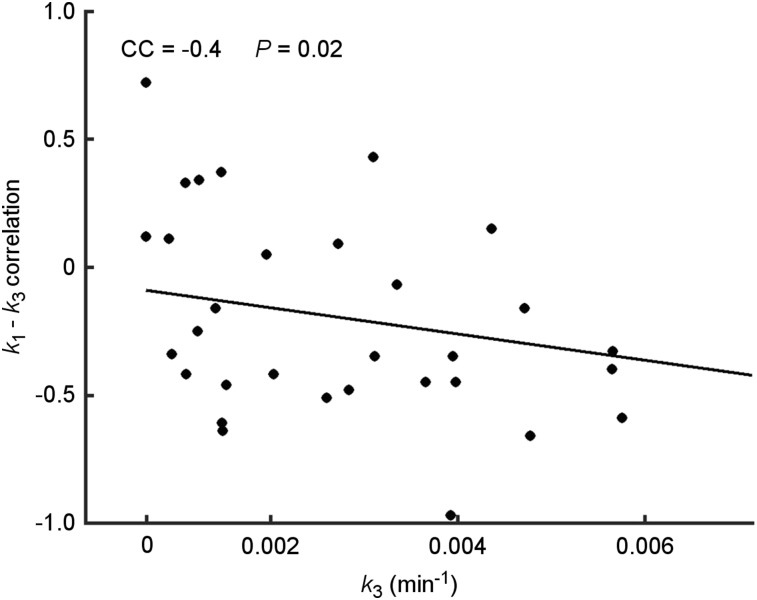
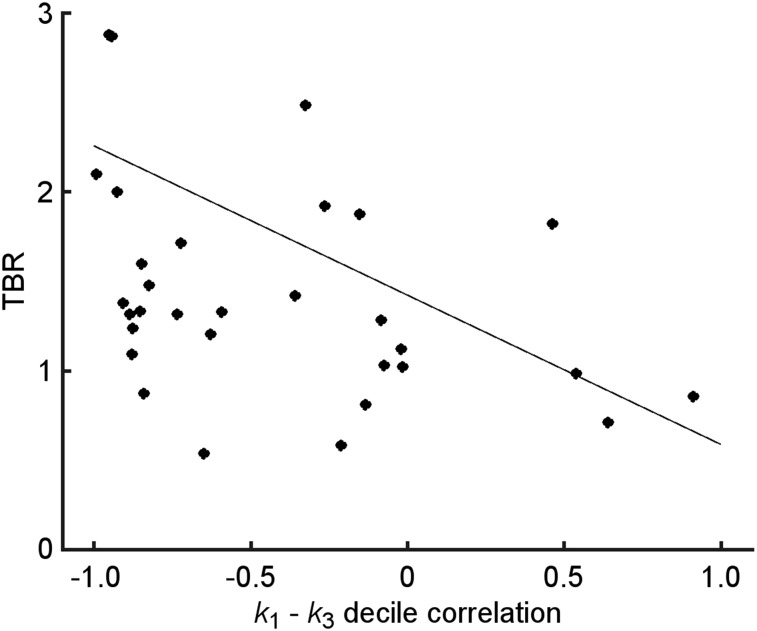
Hypoxic tumors exhibit increased resistance to radiation, chemical, and immune therapies. 18F-fluoromisonidazole (18F-FMISO) PET is a noninvasive, quantitative imaging technique used to evaluate the magnitude and spatial distribution of tumor hypoxia. In this study, pharmacokinetic analysis (PKA) of 18F-FMISO dynamic PET extended to 3 h after injection is reported for the first time, to our knowledge, in stage III-IV non-small cell lung cancer (NSCLC) patients. Methods: Sixteen patients diagnosed with NSCLC underwent 2 PET/CT scans (1-3 d apart) before radiation therapy: a 3-min static 18 F-FDG and a dynamic 18F-FMISO scan lasting 168 ± 15 min. The latter data were acquired in 3 serial PET/CT dynamic imaging sessions, registered with each other and analyzed using pharmacokinetic modeling software. PKA was performed using a 2-tissue, 3-compartment irreversible model, and kinetic parameters were estimated for the volumes of interest determined using coregistered 18F-FDG images for both the volume of interest-averaged and the voxelwise time-activity curves for each patient's lesions, normal lung, and muscle. Results: We derived average values of 18F-FMISO kinetic parameters for NSCLC lesions as well as for normal lung and muscle. We also investigated the correlation between the trapping rate (k3) and delivery rate (K1), influx rate (Ki ) constants, and tissue-to-blood activity concentration ratios (TBRs) for all tissues. Lesions had trapping rates 1.6 times larger, on average, than those of normal lung and 4.4 times larger than those in muscle. Additionally, for almost all cases, k3 and Ki had a significant strong correlation for all tissue types. The TBR-k3 correlation was less straightforward, showing a moderate to strong correlation for only 41% of lesions. Finally, K1-k3 voxelwise correlations for tumors were varied, but negative for 76% of lesions, globally exhibiting a weak inverse relationship (average R = -0.23 ± 0.39). However, both normal tissue types exhibited significant positive correlations for more than 60% of patients, with 41% having moderate to strong correlations (R > 0.5). Conclusion: All lesions showed distinct 18F-FMISO uptake. Variable 18F-FMISO delivery was observed across lesions, as indicated by the variable values of the kinetic rate constant K1 Except for 3 cases, some degree of hypoxia was apparent in all lesions based on their nonzero k3 values.
Keywords: 18F-fluoromisonidazole; compartmental analysis; hypoxia; non-small cell lung cancer; pharmacokinetic analysis.
© 2017 by the Society of Nuclear Medicine and Molecular Imaging.
Figures
Similar articles
-
18F-Fluoromisonidazole Kinetic Modeling for Characterization of Tumor Perfusion and Hypoxia in Response to Antiangiogenic Therapy.J Nucl Med. 2017 Oct;58(10):1567-1573. doi: 10.2967/jnumed.117.190892. Epub 2017 Mar 30. J Nucl Med. 2017. PMID: 28360207 Free PMC article.
-
Interobserver agreement of qualitative analysis and tumor delineation of 18F-fluoromisonidazole and 3'-deoxy-3'-18F-fluorothymidine PET images in lung cancer.J Nucl Med. 2013 Sep;54(9):1543-50. doi: 10.2967/jnumed.112.118083. Epub 2013 Aug 5. J Nucl Med. 2013. PMID: 23918733 Clinical Trial.
-
Lack of correlation of hypoxic cell fraction and angiogenesis with glucose metabolic rate in non-small cell lung cancer assessed by 18F-Fluoromisonidazole and 18F-FDG PET.J Nucl Med. 2006 Dec;47(12):1921-6. J Nucl Med. 2006. PMID: 17138734
-
Usefulness of FMISO-PET for glioma analysis.Neurol Med Chir (Tokyo). 2013;53(11):773-8. doi: 10.2176/nmc.ra2013-0256. Epub 2013 Oct 29. Neurol Med Chir (Tokyo). 2013. PMID: 24172591 Free PMC article. Review.
-
[18F]Fluoromisonidazole.2005 Jul 18 [updated 2005 Aug 15]. In: Molecular Imaging and Contrast Agent Database (MICAD) [Internet]. Bethesda (MD): National Center for Biotechnology Information (US); 2004–2013. 2005 Jul 18 [updated 2005 Aug 15]. In: Molecular Imaging and Contrast Agent Database (MICAD) [Internet]. Bethesda (MD): National Center for Biotechnology Information (US); 2004–2013. PMID: 20641304 Free Books & Documents. Review.
Cited by
-
Phantom Validation of a Conservation of Activity-Based Partial Volume Correction Method for Arterial Input Function in Dynamic PET Imaging.Tomography. 2022 Mar 21;8(2):842-857. doi: 10.3390/tomography8020069. Tomography. 2022. PMID: 35314646 Free PMC article.
-
Kinetic modeling and parametric imaging with dynamic PET for oncological applications: general considerations, current clinical applications, and future perspectives.Eur J Nucl Med Mol Imaging. 2021 Jan;48(1):21-39. doi: 10.1007/s00259-020-04843-6. Epub 2020 May 19. Eur J Nucl Med Mol Imaging. 2021. PMID: 32430580 Free PMC article. Review.
-
Oxygen Sensing, Hypoxia Tracing and in Vivo Imaging with Functional Metalloprobes for the Early Detection of Non-communicable Diseases.Front Chem. 2018 Feb 23;6:27. doi: 10.3389/fchem.2018.00027. eCollection 2018. Front Chem. 2018. PMID: 29527524 Free PMC article. Review.
-
Hypoxia and the phenomenon of immune exclusion.J Transl Med. 2021 Jan 6;19(1):9. doi: 10.1186/s12967-020-02667-4. J Transl Med. 2021. PMID: 33407613 Free PMC article. Review.
-
[18F]Fluoromisonidazole PET in rectal cancer.EJNMMI Res. 2017 Sep 20;7(1):78. doi: 10.1186/s13550-017-0324-x. EJNMMI Res. 2017. PMID: 28933018 Free PMC article.
References
-
- Rosenzweig KE, Amols H, Ling CC. New radiotherapy technologies. Semin Surg Oncol. 2003;21:190–195. - PubMed
-
- Eschmann SM, Paulsen F, Reimold M, et al. Prognostic impact of hypoxia imaging with 18F-misonidazole PET in non-small cell lung cancer and head and neck cancer before radiotherapy. J Nucl Med. 2005;46:253–260. - PubMed
-
- Le QT, Chen E, Salim A, et al. An evaluation of tumor oxygenation and gene expression in patients with early stage non-small cell lung cancers. Clin Cancer Res. 2006;12:1507–1514. - PubMed
-
- Nordsmark M, Bentzen SM, Rudat V, et al. Prognostic value of tumor oxygenation in 397 head and neck tumors after primary radiation therapy: an international multi-center study. Radiother Oncol. 2005;77:18–24. - PubMed
Publication types
MeSH terms
Substances
Grants and funding
LinkOut - more resources
Full Text Sources
Other Literature Sources
Medical