. 2017 Feb 24;7(1):37.
doi: 10.1038/s41598-017-00084-0.

Accelerated disease progression and robust innate host response in aged SIVmac239-infected Chinese rhesus macaques is associated with enhanced immunosenescence

Affiliations

Accelerated disease progression and robust innate host response in aged SIVmac239-infected Chinese rhesus macaques is associated with enhanced immunosenescence

Hong-Yi Zheng et al. Sci Rep. .

Abstract

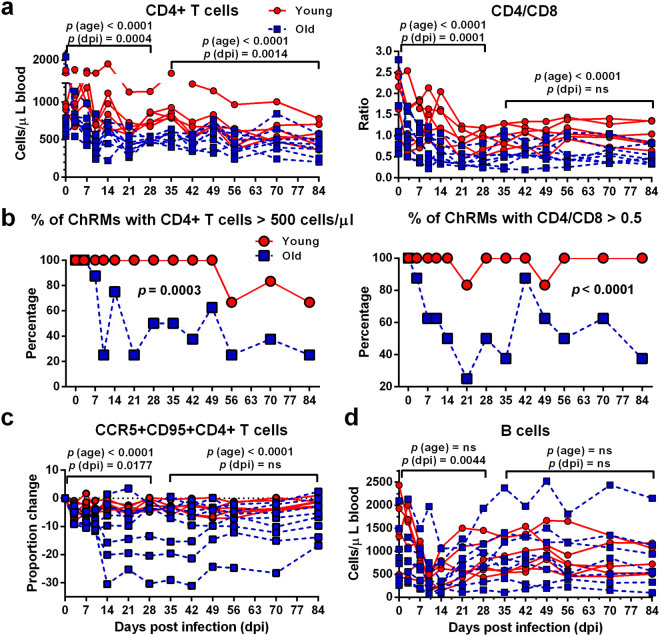
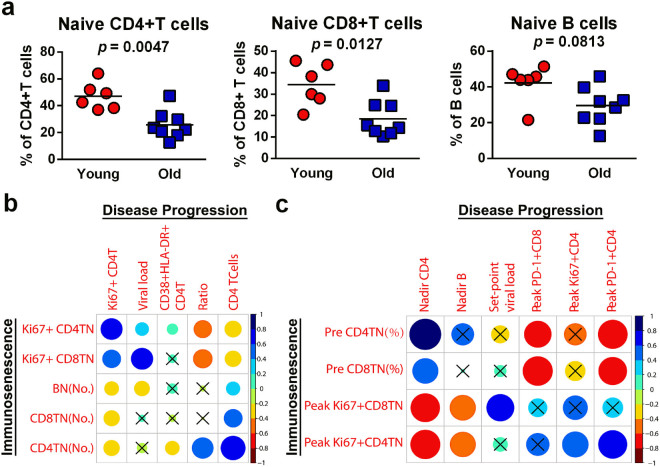
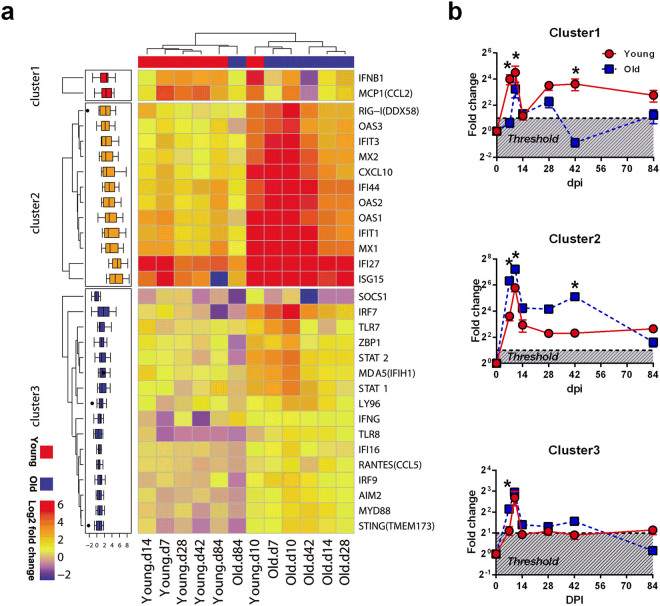
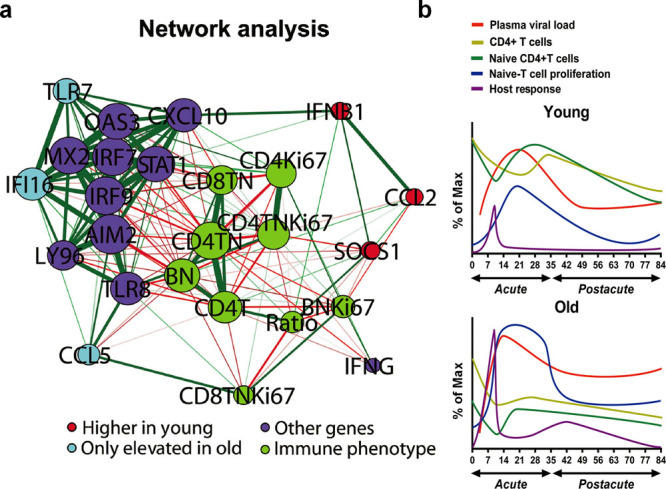
The elderly population infected with HIV-1 is often characterized by the rapid AIDS progression and poor treatment outcome, possibly because of immunosenescence resulting from both HIV infection and aging. However, this hypothesis remains to be fully tested. Here, we studied 6 young and 12 old Chinese rhesus macaques (ChRM) over the course of three months after simian immunodeficiency virus (SIV) SIVmac239 infection. Old ChRM showed a higher risk of accelerated AIDS development than did young macaques, owing to rapidly elevated plasma viral loads and decreased levels of CD4+ T cells. The low frequency of naïve CD4+ T cells before infection was strongly predictive of an increased disease progression, whereas the severe depletion of CD4+ T cells and the rapid proliferation of naïve lymphocytes accelerated the exhaustion of naïve lymphocytes in old ChRM. Moreover, in old ChRM, a robust innate host response with defective regulation was associated with a compensation for naïve T cell depletion and a high level of immune activation. Therefore, we suggest that immunosenescence plays an important role in the accelerated AIDS progression in elderly individuals and that SIV-infected old ChRM may be a favorable model for studying AIDS pathogenesis and researching therapies for elderly AIDS patients.


Figures

Figure 1
Figure 1
Disease status of young and old ChRM during early SIV infection. (a) Kaplan–Meier survival curve comparing SIVmac239-infected young macaques (n = 6, red solid line) with old macaques (n = 12, blue dashed line) during the 84 days after infection. The P value is given by the log rank (Mantel–Cox) test. (b) Plasma viral loads are expressed as SIV RNA copies/ml and are shown for every animal in the young (red circle) and old (blue square) groups. The data are shown as the mean ± SEM. The comparison between the two groups was performed by using two-way ANOVA. (c) Peak and set-point levels of viral load and days with peak viral load were compared between the young and old macaques. P values were determined by using the Mann-Whitney t-test.
Figure 2
Figure 2
Old ChRM display an increased depletion of CD4+ T cells, as compared with young ChRM. (a) Longitudinal assessment of CD4+ T cell numbers and the CD4/CD8 ratio in the peripheral blood of the young (n = 6, red circle) and old (n = 8, blue square) groups during the 84 days after infection (dpi) is shown in dot plots. (b) The frequency of animals with CD4+ T cells > 500 cells/μl blood or a CD4/CD8 ratio > 0.5 within the young and old groups. P values were determined using the Mann-Whitney t-test. (c) The dynamics of CCR5 expression by CD95+CD4+ memory T cells in the peripheral blood is shown as the differences in frequency at each dpi relative to day 0. The data are shown as the mean ± SEM. (d) Longitudinal assessment of B-cell levels in the peripheral blood of ChRM during early SIV infection. P (dpi) < 0.05, statistically significant differences over the acute or postacute phase, as determined by two-way ANOVA. P (age) < 0.05, statistically significant differences between the young and old groups, as determined by two-way ANOVA.
Figure 3
Figure 3
The naïve T cell subsets of old ChRM have an increased level of proliferation. (a) Dot plots shows increased levels of CD38+HLA-DR+CD4+ T cells, Ki67+CD4+ T cells, Ki67+CD4+ naïve T cells, Ki67+CD8+ T cells and Ki67+CD8+ naïve T cells in old (n = 8, blue square) compared with young (n = 6, red circle) animals during early infection. P (dpi) < 0.05, statistically significant differences over the acute or postacute phase, as determined by two-way ANOVA. P (age) < 0.05, statistically significant differences between the young and old groups, as determined by two-way ANOVA.
Figure 4
Figure 4
Old ChRM display a decreased number of naïve CD4+ T cells and B cells, as compared with young macaques. (a) The absolute number of naïve CD4+ T and B cells in the peripheral blood of young (n = 6, red circle) and old macaques (n = 8, blue square) is shown in scatter plots. (b) Comparison of the TREC (T cell receptor rearrangement excision circle) content in T cells or the KREC (kappa-deletion recombination excision circle) content in B cells from PBMCs in young and old macaques. The data are shown as the mean ± SEM. p (dpi) < 0.05 with color, statistically significant differences over the entire infection time, as determined by one-way ANOVA in the young (red) or old (blue) group. P (age) < 0.05, statistically significant differences between the young and old groups, as determined by two-way ANOVA. (c) Principal component analysis (PCA) of an immunophenotype data set in the acute and postacute phase was calculated by a varimax rotation method in package psych and graphed by package ggbiplot2 with R. Each dot represents a sample from a time point that is plotted against its expression levels for 9 variables that differed over time and between age groups, as determined by two-way ANOVA. The variables are shown in capital letters and are arranged alphabetically according to their communalities from high to low. CD4TCells, CD4+ T cell number; CD4TN, naïve CD4+ T cell number; CD8TN, naïve CD8+ T cell number; Ratio, CD4/CD8; BN, naïve B cell number; Ki67+CD4TN, % of Ki67+CD4+ naïve T cells; Ki67+CD8TN, % of Ki67+CD8+ naïve T cells; Ki67+CD4T, % of Ki67+CD4+ T cells; CD38+HLA-DR+CD4T, % of CD38+HLA-DR+CD4+ T cells.
Figure 5
Figure 5
Immunosenescence predicts accelerated disease progression in old ChRM. (a) Old ChRM have a significantly lower frequency of naïve CD4+and CD8+ T cells and naïve B cells than young ChRM before infection. P values were determined using the Mann-Whitney t-test. (b) The correlation matrix constructed by package corrplot with R reveals the relationships between the markers of immunosenescence and SIV disease progression during infection. (c) The correlation matrix reveals the relationships between characteristic values before and after infection. Pre, value before infection; Peak, peak value during infection; Nadir, minimum value during infection. The blue and red indicate positive and negative correlations, respectively (see color bar). The results of Spearman’s test (two-tailed, unadjusted) with a P value ≥ 0.05 were considered not significant (shown as cross).
Figure 6
Figure 6
Acute SIV infection induces a robust innate host response in old ChRM. (a) Hierarchical clustering of 30 genes significantly induced by SIV infection (dpi = 0, 7, 10, 14, 28, 42 and 84) and differentially expressed between the young (n = 6) and old (n = 6) ChRM. Clustering was performed on the average of log2 ratios of mRNA expression relative to levels before infection by the RT-PCR-based ΔΔCt method. The genes were clustered on the basis of their expression value across samples using Euclidean distance and k-mean clustering. The progressive increases in mean log2-fold-change are represented by blue to red colors. (b) Graphs that display the characteristics of the three distinct clusters revealed in the left heat map. The threshold represents the credible induction by SIV infection for more than a 2-fold up-regulation of gene expression. The data are shown as the mean ± SEM. *P < 0.05 between the young (red circle) and old (blue square) groups, as determined by uncorrected Fisher’s LSD test post two-way ANOVA.
Figure 7
Figure 7
Systematic analysis of data of immunosenescence, disease progression and host response. (a) The correlation network of immunophenotype and gene expression data was constructed by using the qgraph package with R. The 4 groups of nodes are colored on the basis of data types. The groups include genes expressed higher in the young group (IFNB1, CCL2 and SOCS1), genes elevated in only the old group (TLR7, IFI16 and CCL5), other genes significantly correlated with immunophenotype (OAS3, CXCL10, MX2, IRF7, STAT1, IRF9, AIM2, LY96, TLR8 and IFNG) and an immunophenotype that differed between the young and old groups (CD4T, CD4+ T cell number; Ratio, CD4/CD8; CD4TN, naïve CD4+ T cell number; CD8 TN, naïve CD8+ T cell number; CD4Ki67, % of Ki67+CD4+ T cells; CD4TNKi67, % of Ki67+CD4+ T cells; CD8TNKi67, % of Ki67+CD8+ T cells; BN, naïve B cell number; BNKi67, % of Ki67+ naïve B cells). The node size indicates the relative strength value according to a centrality analysis. The thicker lines indicate more correlated genes. The green lines represent significantly positive Pearson correlation coefficients ≥ 0.40, and the red lines represent significantly negative Pearson correlation coefficients ≤ −0.40. (b) Model of immunosenescence, disease progression and host response in ChRM that demonstrates their variation differences during early SIV infection as detailed in the text. Immunosenescence is shown by the numbers of naïve CD4+ T cells and the percentage of Ki67+ naïve T cells. The plasma viral loads and CD4+ T cell numbers represent the level of disease progression. The innate host response is defined by the fold-changes of differentially expressed genes. The smooth curves were constructed by a spline fit method using GraphPad Prism 6 software.

Similar articles

Cited by

References

    1. Fauci AS, Folkers GK, Dieffenbach CW. HIV-AIDS: much accomplished, much to do. Nat Immunol. 2013;14:1104–1107. doi: 10.1038/ni.2735. - DOI - PubMed
    1. Nasi M, et al. Aging with HIV infection: a journey to the center of inflammAIDS, immunosenescence and neuroHIV. Immunol Lett. 2014;162:329–333. doi: 10.1016/j.imlet.2014.06.012. - DOI - PubMed
    1. Bakanda C, et al. Association of aging and survival in a large HIV-infected cohort on antiretroviral therapy. AIDS. 2011;25:701–705. doi: 10.1097/QAD.0b013e3283437ed7. - DOI - PubMed
    1. Kalayjian RC, et al. Age-related immune dysfunction in health and in human immunodeficiency virus (HIV) disease: association of age and HIV infection with naive CD8+ cell depletion, reduced expression of CD28 on CD8+ cells, and reduced thymic volumes. J Infect Dis. 2003;187:1924–1933. doi: 10.1086/375372. - DOI - PubMed
    1. van Baarle D, Tsegaye A, Miedema F, Akbar A. Significance of senescence for virus-specific memory T cell responses: rapid ageing during chronic stimulation of the immune system. Immunol Lett. 2005;97:19–29. doi: 10.1016/j.imlet.2004.10.003. - DOI - PubMed

Publication types