. 2017 Feb 9:11:2.
doi: 10.3389/fnint.2017.00002. eCollection 2017.

Characterization of Involuntary Contractions after Spinal Cord Injury Reveals Associations between Physiological and Self-Reported Measures of Spasticity

Affiliations

Characterization of Involuntary Contractions after Spinal Cord Injury Reveals Associations between Physiological and Self-Reported Measures of Spasticity

Meagan Mayo et al. Front Integr Neurosci. .

Abstract

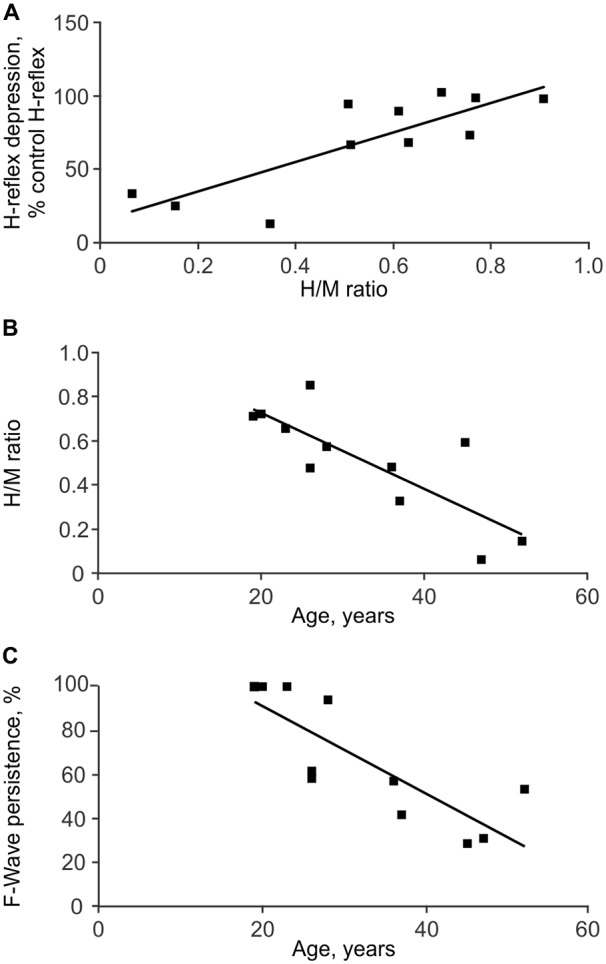
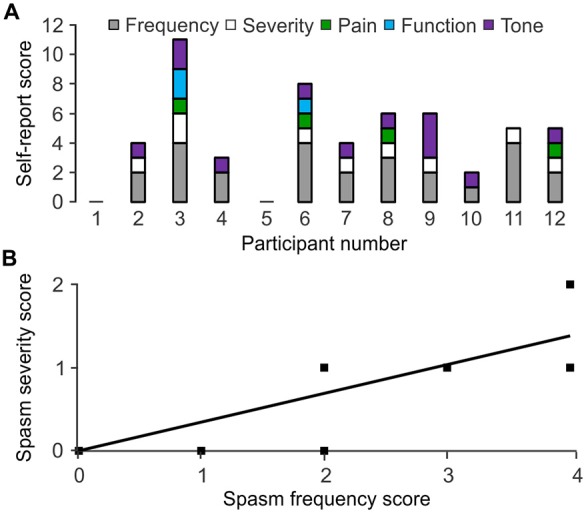
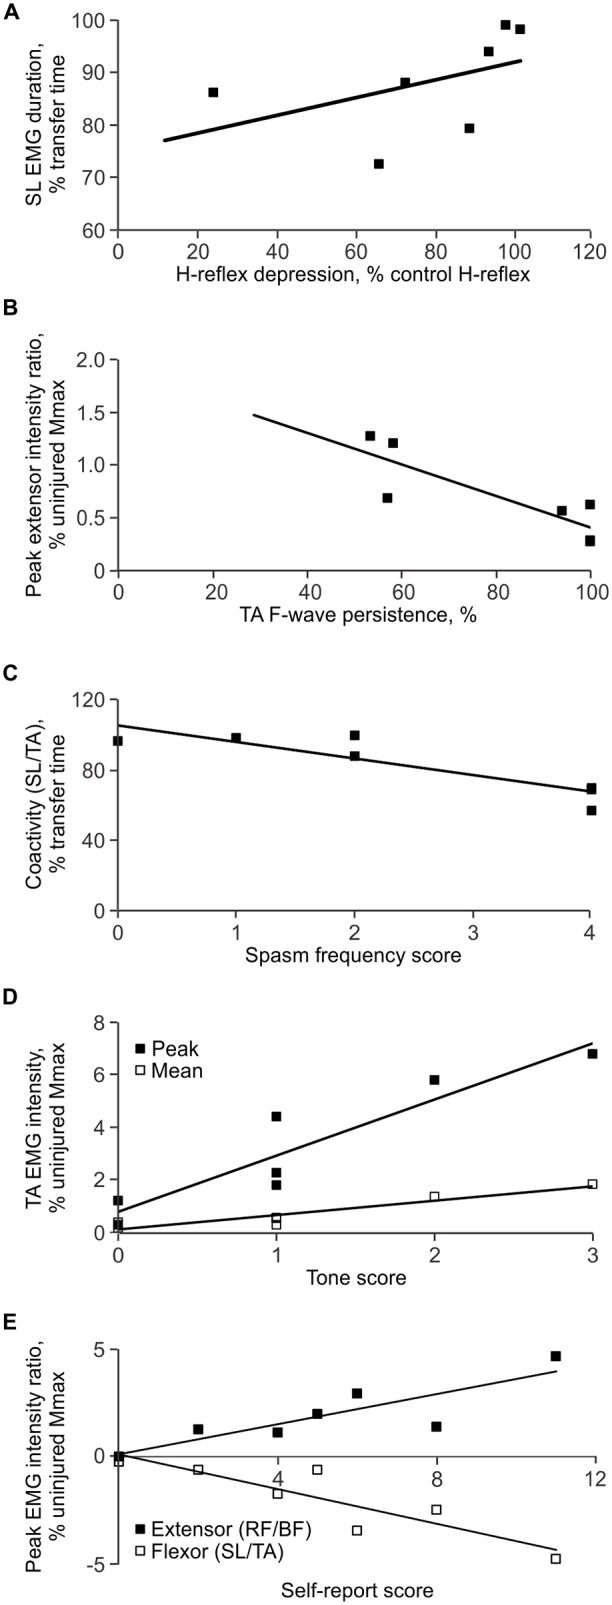
Correlations between physiological, clinical and self-reported assessments of spasticity are often weak. Our aims were to quantify functional, self-reported and physiological indices of spasticity in individuals with thoracic spinal cord injury (SCI; 3 women, 9 men; 19-52 years), and to compare the strength and direction of associations between these measures. The functional measure we introduced involved recording involuntary electromyographic activity during a transfer from wheelchair to bed which is a daily task necessary for function. High soleus (SL) and tibialis anterior (TA) F-wave/M-wave area ratios were the only physiological measures that distinguished injured participants from the uninjured (6 women, 13 men, 19-67 years). Hyporeflexia (decreased SL H/M ratio) was unexpectedly present in older participants after injury. During transfers, the duration and intensity of involuntary electromyographic activity varied across muscles and participants, but coactivity was common. Wide inter-participant variability was seen for self-reported spasm frequency, severity, pain and interference with function, as well as tone (resistance to imposed joint movement). Our recordings of involuntary electromyographic activity during transfers provided evidence of significant associations between physiological and self-reported measures of spasticity. Reduced low frequency H-reflex depression in SL and high F-wave/M-wave area ratios in TA, physiological indicators of reduced inhibition and greater motoneuron excitability, respectively, were associated with long duration SL and biceps femoris (BF) electromyographic activity during transfers. In turn, participants reported high spasm frequency when transfers involved short duration TA EMG, decreased co-activation between SL and TA, as well as between rectus femoris (RF) vs. BF. Thus, the duration of muscle activity and/or the time of agonist-antagonist muscle coactivity may be used by injured individuals to count spasms. Intense electromyographic activity and high tone related closely (possibly from joint stabilization), while intense electromyographic activity in one muscle of an agonist-antagonist pair (especially in TA vs. SL, and RF vs. BF) likely induced joint movement and was associated with severe spasms. These data support the idea that individuals with SCI describe their spasticity by both the duration and intensity of involuntary agonist-antagonist muscle coactivity during everyday tasks.

Keywords: F-wave; H-reflex; muscle co-activation; muscle spasms; tone; wheelchair transfer.


Figures

Figure 1
Figure 1
Electrode placement and physiological data. (A) Bipolar EMG was recorded from soleus (SL), tibialis anterior (TA), rectus femoris (RF) and biceps femoris (BF) with electrodes ~4 cm apart. Pictures of muscles used with permission (Sieg and Adams, 2009). (B) Raster of SL EMG evoked by tibial nerve stimulation at increasing intensity (top to bottom). The H-reflex increases, then decreases as the M-wave increases. The maximal H-reflex trace is thick. Maximal M-waves are overlaid. (C) Raster of maximal SL M-waves and the associated F-waves which vary across responses. (D) Overlay of control SL M-waves and H-reflexes (top and bottom, two traces each) and M-wave and H-reflexes evoked in response to pulses at 1 Hz stimulation (middle). The M-waves (2.5 ± 0.6% Mmax) remained stable throughout. All data are taken from participant 6.
Figure 2
Figure 2
Involuntary EMG generated during transfers from a wheelchair to a bed. (A) Schematic of the transfer task. (B) TA EMG intensity for the data shown in (C–E) normalized to Uninjured and spinal cord injury (SCI) maximal M-wave data. EMG recorded from SL, TA, RF and BF as participant 5 (C), 7 (D) and 3 (E) transferred from their wheelchair to our bed (positioning), then lay down. The transition between the two phases is marked by a dotted line.
Figure 3
Figure 3
EMG parameters during transfers. (A) Mean (+SD) EMG duration for each muscle and participant. (B) Mean and peak (+SD) EMG intensity as a percentage of the average uninjured maximal M-wave by gender. (C) Mean (+SD) percentage of transfer time SL was coactive with TA, and RF was activated with BF by participant. (D) Median and peak intensity EMG ratios for SL/TA and RF/BF muscle pairs (positive values indicate the extensor values for the muscle pair; negative values indicate the flexor values; zero indicates EMG of equal intensity in both the extensor and flexor). Mean ± SD Uninjured vs. SCI maximal M-waves: SL Men: 23.4 ± 6.8 mV vs. 10.8 ± 4.8 mV, Women: 22.6 ± 7.2 mV vs. 5.8 ± 1.6 mV; TA Men: 16.2 ± 3.2 mV vs. 6.2 ± 4.8 mV, Women: 11.8 ± 2.6 mV vs. 4.4 ± 1.0 mV; VL (Un) or RF (SCI) Men: 13.6 ± 5.2 mV vs. 9.8 ± 7.6 mV, Women: 7.2 ± 2.0 mV vs. 5.4 ± 0.6 mV.
Figure 4
Figure 4
Physiological measures of spasticity. Mean + SD SL H/M ratio (A), H-reflex depression at 1 Hz (B), F/M area ratio (C), and F-wave persistence (D) for SCI and Uninjured participants. Data for each group are plotted from low to high H/M ratio in this figure and other figures. No M-wave was evoked in one participant with SCI (participant 1). Solid, dotted and dashed lines show the Uninjured mean, ±1 SD, and ±2 SD, respectively. Mean ± SD Uninjured H/M Ratio: 0.55 ± 0.14; H-Depression: 57.8 ± 18.4%; F/M Area Ratio: 0.01 ± 0.01; F-wave Persistence: 89.7 ± 17.6%.
Figure 5
Figure 5
Associations between physiological measures of spasticity. Depression of the SL H-reflex in response to 1 Hz stimulation was less with greater H/M ratios (A). SL H/M ratio (B) and TA F-wave persistence (C) both decreased with age.
Figure 6
Figure 6
Self-reported spasm and tone scores. (A) Scores assigned to spasm frequency, severity, pain, interference with function, tone by participant. Higher numbers represent greater impairment. Participant 1 and 5 reported no spasms or tone. (B) Spasm frequency association with severity.
Figure 7
Figure 7
Correlations between measures. (A) Less low frequency H-reflex depression was associated with long SL EMG duration during the transfer. (B) Low TA F-wave persistence was associated with intense EMG in SL vs. TA, expressed as a higher peak extensor EMG ratio (SL EMG intensity < TA EMG intensity). (C) High spasm frequency was associated with decreased coactivity between SL and TA. (D) Greater self-reported tone was associated with strong mean and peak EMG in TA. (E) Greater total self-reported scores were associated with strong EMG in TA vs. SL, and strong EMG in RF vs. BF.

Similar articles

Cited by

References

    1. Adams M. M., Hicks A. L. (2005). Spasticity after spinal cord injury. Spinal Cord 43, 577–586. 10.1038/sj.sc.3101757 - DOI - PubMed
    1. Allison G., Singer K., Marshall R. (1995). Muscle activation patterns during transfers in individuals with spinal cord injury. Aust. J. Physiother. 41, 169–176. 10.1016/s0004-9514(14)60427-x - DOI - PubMed
    1. Ashby P., Verrier M., Lightfoot E. (1974). Segmental reflex pathways in spinal shock and spinal spasticity in man. J. Neurol. Neurosurg. Psychiatry 37, 1352–1360. 10.1136/jnnp.37.12.1352 - DOI - PMC - PubMed
    1. Baunsgaard C. B., Nissen U. V., Christensen K. B., Biering-Sørensen F. (2016). Modified Ashworth scale and spasm frequency score in spinal cord injury: reliability and correlation. Spinal Cord 54, 702–708. 10.1038/sc.2015.230 - DOI - PubMed
    1. Beaumont E., Houlé J. D., Peterson C. A., Gardiner P. F. (2004). Passive exercise and fetal spinal cord transplant both help to restore motoneuronal properties after spinal cord transection in rats. Muscle Nerve 29, 234–242. 10.1002/mus.10539 - DOI - PubMed

LinkOut - more resources