. 2017 Feb 9:11:6.
doi: 10.3389/fncom.2017.00006. eCollection 2017.

Phase Difference between Model Cortical Areas Determines Level of Information Transfer

Affiliations

Phase Difference between Model Cortical Areas Determines Level of Information Transfer

Marije Ter Wal et al. Front Comput Neurosci. .

Abstract

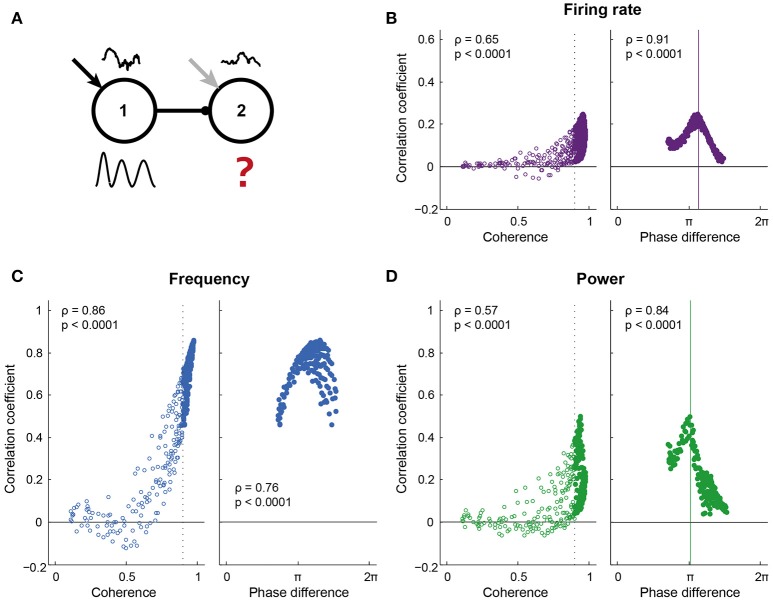
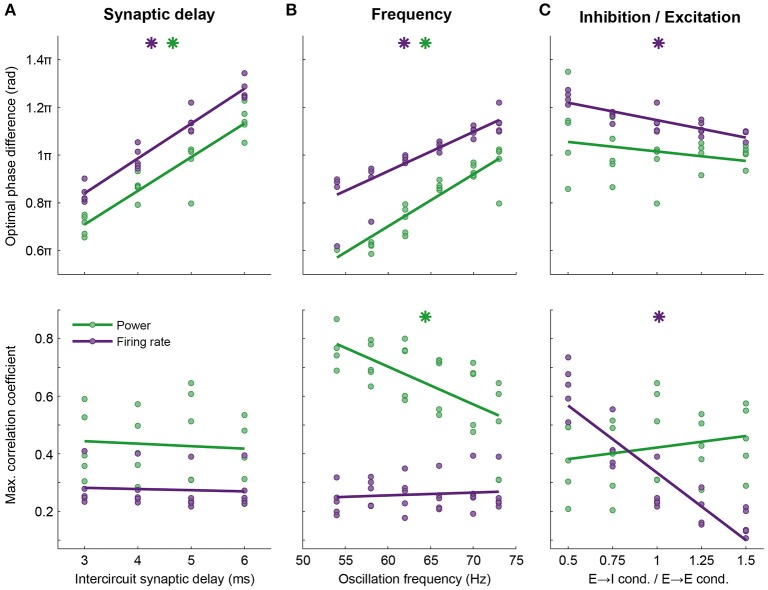
Communication between cortical sites is mediated by long-range synaptic connections. However, these connections are relatively static, while everyday cognitive tasks demand a fast and flexible routing of information in the brain. Synchronization of activity between distant cortical sites has been proposed as the mechanism underlying such a dynamic communication structure. Here, we study how oscillatory activity affects the excitability and input-output relation of local cortical circuits and how it alters the transmission of information between cortical circuits. To this end, we develop model circuits showing fast oscillations by the PING mechanism, of which the oscillatory characteristics can be altered. We identify conditions for synchronization between two brain circuits and show that the level of intercircuit coherence and the phase difference is set by the frequency difference between the intrinsic oscillations. We show that the susceptibility of the circuits to inputs, i.e., the degree of change in circuit output following input pulses, is not uniform throughout the oscillation period and that both firing rate, frequency and power are differentially modulated by inputs arriving at different phases. As a result, an appropriate phase difference between the circuits is critical for the susceptibility windows of the circuits in the network to align and for information to be efficiently transferred. We demonstrate that changes in synchrony and phase difference can be used to set up or abolish information transfer in a network of cortical circuits.

Keywords: PING; communication through coherence; information transfer; multiplexing; oscillations; phase difference; synchrony.


Figures

Figure 1
Figure 1
A single local circuit model shows both asynchronous and PING and ING-generated synchronous network states, depending on the level of input current to the pyramidal cell and interneuron populations. (A) Example rastergram of a synchronous state; (B) The corresponding spike density plot of the same simulation run; (C) Input to the interneurons (horizontal axis) and the pyramidal cells (vertical axis) determines the level of synchrony of the circuit, indicated by color saturation, and the oscillation frequency, indicated by hue, in a systematic way. In the dark gray area, the circuit synchronized according to the ING mechanism. In the colored area, the PING mechanism synchronized the neurons. In this region of interest, oscillation frequency (black) is increased by increasing the input to both cell types (D), while synchrony (PPC, orange) is changed by decreasing the depolarization of one of the cell types, and increasing the input to the other cell type (E).
Figure 2
Figure 2
Synchronization between two circuits in a feedforward network emerged within a tilted Arnold tongue. (A) Schematic of the model setup. Two circuits showing intrinsic oscillatory activity in isolation, were connected by excitatory unidirectional synaptic connections with an axonal delay of 5 ms. The receiving circuit oscillated at 43 Hz, while the oscillation frequency of the sender was varied (x-axis in B,D) by increasing the static external drive between runs. (B) Coherence (color coded) between the circuits at the oscillation frequency of the sending circuit, showed resemblance to a tilted Arnold tongue. The area of high LFP-LFP coherence coincided with an area of intermediate (thin black line) and high (thick black line) spike-LFP phase consistency between the circuits (that is, spikes from circuit 2 and the LFP from circuit 1, see also Figures SI4C,D). (C) Simplified model in which a single circuit was driven by an oscillatory drive of which the frequency was varied together with either the amplitude (left) or the average current (middle). For comparison with panel B, “coherence” between drive frequency (fd) and circuit frequency (fc) is plotted, as defined in the equation below the colorbar. Gray lines show the 0.90-contours. Amplitude modulation gave rise to a conventional Arnold tongue synchronization, while offset modulation shifted the intrinsic frequency of the circuit and hence tilted the axis of synchronization. (D) Phase difference of the inter-circuit projection, as defined in the bottom panel of A, for conditions of high coherence (≥ 0.90). Conventions as in panel B, with the same PPC curves for reference.
Figure 3
Figure 3
Pulsed inputs caused changes in spike rate and the features of the oscillation, the magnitude of which depends on the pulse arrival time relative to the ongoing oscillation. (A) Pulses were applied to 75% of the pyramidal cells in circuit 1. The arrival time relative to the ongoing oscillation is indicated by θ, with 0 and 2π indicating the peaks of the oscillation. The effect of a pulse was determined by comparing traces after a pulse with the same condition without pulse presentation. (B) Conventions for panel D, where pulses were applied to circuit 1 of a feedforward network. (C) Changes in spike rate per oscillation period (left), peak time (middle), and height (right) of the first excitatory volley in circuit 1 after pulse presentation. Error bars show standard deviations over 10 simulation runs. Black bars at the abscissa indicate significant deviation from 0. The abscissa indicate pulse arrival phase. (D) The spike density traces of circuit 2 were also affected by pulse application to circuit 1, but in addition to the pulse arrival time this effect could depend on phase difference between the two circuits (Δφ, color coded). The two rows show the same data; the top row shows the data relative to the pulse arrival phase in circuit 1, while the bottom row shows the data relative to the pulse arrival phase in circuit 2 (Note: The pulse was applied only to circuit 1). In circuit 2, as in circuit 1, the number of spikes per period and the peak height were modulated by pulse arrival phase, but the size of the modulations depended on the phase difference between the circuits. Peak times of circuit 2 were modulated by pulse arrival phase, but not phase difference. Statistics for the data in D can be found in the main text and SI Figure 7.
Figure 4
Figure 4
Information transfer required high coherence and a “good” phase relation. (A) Pyramidal cells in both circuits of the network received a colored white noise current (correlation time = 200 ms), which was identical within each circuit, but uncorrelated across circuits. Correlating the instantaneous spike density frequency, power and spike rate of the two circuits gave a measure of information transfer: 1 indicates that all variability in the receiving circuit is explained by the sender (a high level of information transfer), while 0 indicates a low level of information transfer. (B–D) show the correlation coefficient for a range of coherence and phase conditions, for spike density frequency (B), power (C), and firing rate (D). For frequency, the correlation coefficient increased predominantly with coherence between the circuits. For power and firing rate, the range of correlation values was broad for conditions of high coherence, with strong correlations linked to a “good” phase difference between the circuits. Phase impacted the correlation coefficient for frequency, but to a much smaller extent than for power and firing rate.
Figure 5
Figure 5
Optimal phase difference (top row) and information transfer at this phase (bottom row) depend on network properties such as axonal delay, frequency and balance between excitation and inhibition. Here, data are shown for firing rate (purple) and power at the oscillation frequency (green, compare to Figure 4B). Every point shows data from one simulation, lines are linear fits. The phase of optimal information transfer depended on the characteristic of the network: The synaptic delay between the circuits (A) and the oscillation frequency (B) and to a much lesser extent, the E → I conductance relative to the E → E conductance (C). Other parameters (synaptic conductance, connection probability, etc.) were kept constant. Stars indicate significant correlations. The level of information transfer at the optimal phase strongly depended on the E → I—E → E conductance ratio for firing rate, but not power; (C) stronger projection to E cells in the receiving circuit led to more effective communication of firing rates. Information transfer through power was frequency dependent: Lower frequencies performed better (B). Parameters used in Figure 4B: 5 ms delay, an oscillation frequency of 73 Hz and an E → I—E → E conductance ratio of 1.
Figure 6
Figure 6
Illustration (one simulation) of altered communication in a network comprised of two senders and one receiver as a result of coherence and phase changes. (A) Schematic of the network: two circuits project to a third one with identical connection parameters. Both senders received independent noise currents. In addition, all circuits receive a static depolarization, which could change after 3000 ms-long epochs, as indicated in (B); (C) The changes in depolarization levels altered the oscillation frequency of the circuits. As a result, the receiving circuit switched from being synchronized to the sender 1b (orange), to being synchronized to sender 1a (red); (D) The coherence levels changed accordingly; (E) For the coherent pairs, phase differences were calculated. Both coherence and phase were time-resolved by taking 1000 ms windows, spaced 100 ms apart. The purple and green lines corresponded to the peak phases of firing rate and power, respectively, see Figure 4. (F) Information transfer was assessed, as before, by taking the frequency, power and firing-rate-per-period traces per epoch of 3000 ms, and correlating these between circuits. The information transfer from sender 1b to the receiver was reduced as this connection lost its coherence in the second epoch. Concomitantly, communication between 1a and the receiver increased after this coherence switch. In epoch 3 the firing rate transfer was reduced due to a less favorable phase relationship.
Figure 7
Figure 7
Interactions between top-down inputs and the PING model. (A) Bottom-up processing is associated with gamma oscillations. The model presented here predicts a decrease in intrinsic oscillation frequency along the hierarchy in the network. On the other hand, top-down inputs are mediated through low frequencies. These slow oscillations can interact with the bottom-up information stream in several different ways. (B) The model predicts that the ratio of excitation to inhibition that is recruited by a bottom-up stream affects the information transfer, by altering the phase locking of the receiver spikes. Top-down input can interfere by shifting the balance to excitation of inhibition. (C,D) Slow oscillations can also directly target the oscillations in either the sender (C), the receiver (D) or both local circuits. The effects of such interference need further investigation.

Similar articles

Cited by

References

    1. Akam T., Kullmann D. (2012). Efficient “communication through coherence” requires oscillations structured to minimize interference between signals. PLoS Comput. Biol. 8:e1002760 10.1371/journal.pcbi.1002760 - DOI - PMC - PubMed
    1. Akam T., Kullmann D. M. (2010). Oscillations and filtering networks support flexible routing of information. Neuron 67, 308–320. 10.1016/j.neuron.2010.06.019 - DOI - PMC - PubMed
    1. Akam T., Kullmann D. M. (2014). Oscillatory multiplexing of population codes for selective communication in the mammalian brain. Nat. Rev. Neurosci. 15, 111–122. 10.1038/nrn3668 - DOI - PMC - PubMed
    1. Akam T., Oren I., Mantoan L., Ferenczi E., Kullmann D. M. (2012). Oscillatory dynamics in the hippocampus support dentate gyrus–CA3 coupling. Nat. Neurosci. 15, 763–768. 10.1038/nn.3081 - DOI - PMC - PubMed
    1. Atallah B. V., Scanziani M. (2009). Instantaneous modulation of gamma oscillation frequency by balancing excitation with inhibition. Neuron 62, 566–577. 10.1016/j.neuron.2009.04.027 - DOI - PMC - PubMed