. 2017 Feb 9:8:120.
doi: 10.3389/fpsyg.2017.00120. eCollection 2017.

Compound Stimulus Presentation Does Not Deepen Extinction in Human Causal Learning

Affiliations

Compound Stimulus Presentation Does Not Deepen Extinction in Human Causal Learning

Oren Griffiths et al. Front Psychol. .

Abstract

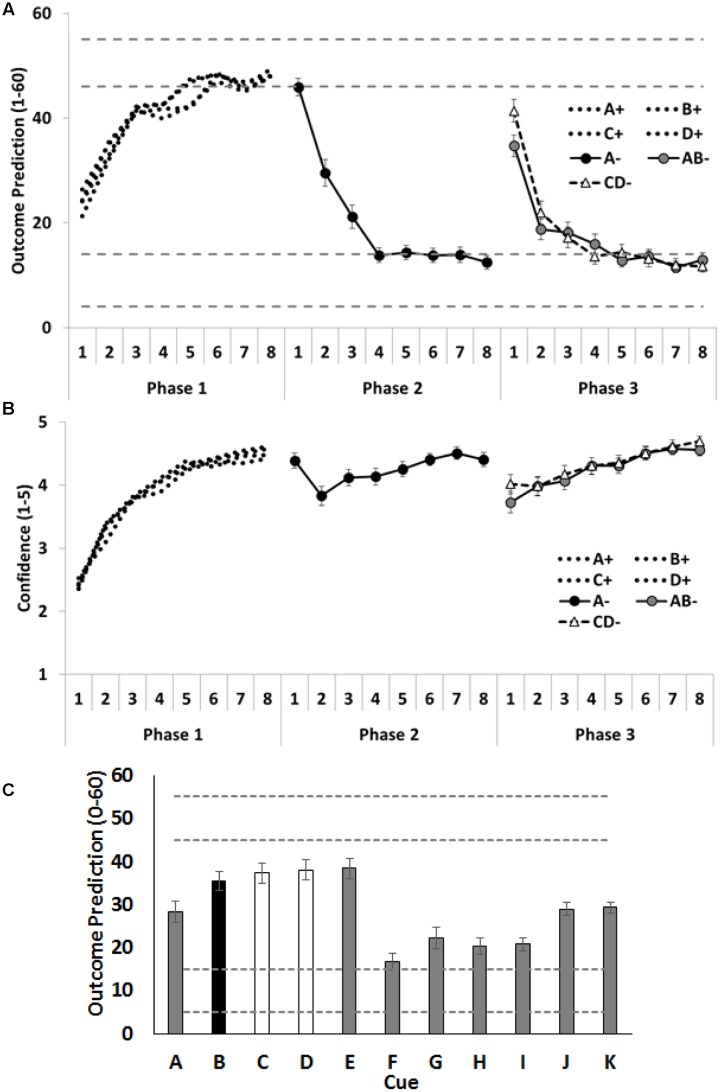
Models of associative learning have proposed that cue-outcome learning critically depends on the degree of prediction error encountered during training. Two experiments examined the role of error-driven extinction learning in a human causal learning task. Target cues underwent extinction in the presence of additional cues, which differed in the degree to which they predicted the outcome, thereby manipulating outcome expectancy and, in the absence of any change in reinforcement, prediction error. These prediction error manipulations have each been shown to modulate extinction learning in aversive conditioning studies. While both manipulations resulted in increased prediction error during training, neither enhanced extinction in the present human learning task (one manipulation resulted in less extinction at test). The results are discussed with reference to the types of associations that are regulated by prediction error, the types of error terms involved in their regulation, and how these interact with parameters involved in training.

Keywords: Pavlovian conditioning; animal conditioning; extinction; human learning; prediction error.


Figures

FIGURE 1
FIGURE 1
Schematic depiction of the materials used in Experiments 1 and 2. The (top left) panel shows a typical training trial in which participants were shown a food (or two foods, not shown) and were first asked to predict Mrs. X’s resultant antibody levels. They did this by manipulating the scrollbar in the panel. When that prediction was made, the participant was asked to rate their confidence using the 5-option response scale at the bottom of the screen. Feedback was then provided immediately for 1.5 s. A typical feedback screen is shown in the (top right) panel. It differs from the cue presentation screen in that it shows the correct value (on the right-hand scrollbar), alongside the prediction and confidence values chosen by the participant (left hand scrollbar and blue rectangle on the lower screen, respectively). Mrs. X’s antibody levels (and thus her allergic reaction response) was indicated by the right-hand response scale. The participant’s chosen confidence response remained onscreen. An intertrial interval (ITI) of 0.5 s occurred between trials, during which the preceding trial’s cue, response information, and feedback was removed from the screen. The lower two panels depict the two types of test-items. The (lower left) panel shows a typical forced choice test-item. The (lower right) item shows a typical test item in which people were asked to rate the allergenic properties of each food item individually.
FIGURE 2
FIGURE 2
Performance in Experiment 1. (A) Depicts outcome prediction responses across the three training phases for the critical cues A–D. The broken horizontal lines on (A,C) indicate the range of outcome values (allergic response severity, 0–60; corresponds to 10 times the 0.0–6.0 value seen in Figure 1) that could occur on a ++ trial (the upper range) or on a – trial (the lower range). (B) Depicts confidence ratings for these same trial-types across the three training phases. (C) Shows people’s test ratings for the individual cue test items. In panel C the critical cue (B) is shown as a black column, and the comparison control cues (C and D) are shown as white columns. Error bars indicate standard error of the mean in all panels.
FIGURE 3
FIGURE 3
Performance in Experiment 2. (A) Depicts outcome prediction responses across the three training phases for the critical cues A–D. The broken horizontal lines on (A,C) indicate the range of outcome values (allergic response severity, 0–60; corresponds to 10 times the 0.0–6.0 value seen in Figure 1) that could occur on a ++ trial (the upper range) or on a – trial (the lower range). (B) Depicts confidence ratings for these same trial-types across the three training phases. (C) People’s test ratings for the individual cue test items. The critical cues (A and B) are shown as black columns, and the comparison control cues (C and D) are shown as white columns. Error bars indicate standard error of the mean in all panels.

References

    1. Aitken M. R. F., Larkin M. J. W., Dickinson A. (2000). Super-learning of causal judgements. Q. J. Exp. Psychol. 53B, 59–81. 10.1080/027249900392995 - DOI - PubMed
    1. Chapman G. B., Robbins S. J. (1990). Cue interactions in human contingency judgment. Mem. Cogn. 18 537–545. 10.3758/BF03198486 - DOI - PubMed
    1. Clark D. M. (1986). A cognitive approach to panic. Behav. Res. Ther. 24 461–470. 10.1016/0005-7967(86)90011-2 - DOI - PubMed
    1. Collins D. J., Shanks D. R. (2002). Momentary and integrative response strategies in causal judgment. Mem. Cogn. 30 1138–1147. 10.3758/BF03194331 - DOI - PubMed
    1. Culver N. C., Vervliet B., Craske M. G. (2015). Compound extinction using the Rescorla–Wagner model to maximize exposure therapy effects for Anxiety disorders. Clin. Psychol. Sci. 3 335–348. 10.1177/2167702614542103 - DOI

LinkOut - more resources