

Analysis of Audiometric Differences of Patients with and without Tinnitus in a Large Clinical Database
- PMID: 28232817
- PMCID: PMC5298966
- DOI: 10.3389/fneur.2017.00031
Analysis of Audiometric Differences of Patients with and without Tinnitus in a Large Clinical Database
Abstract
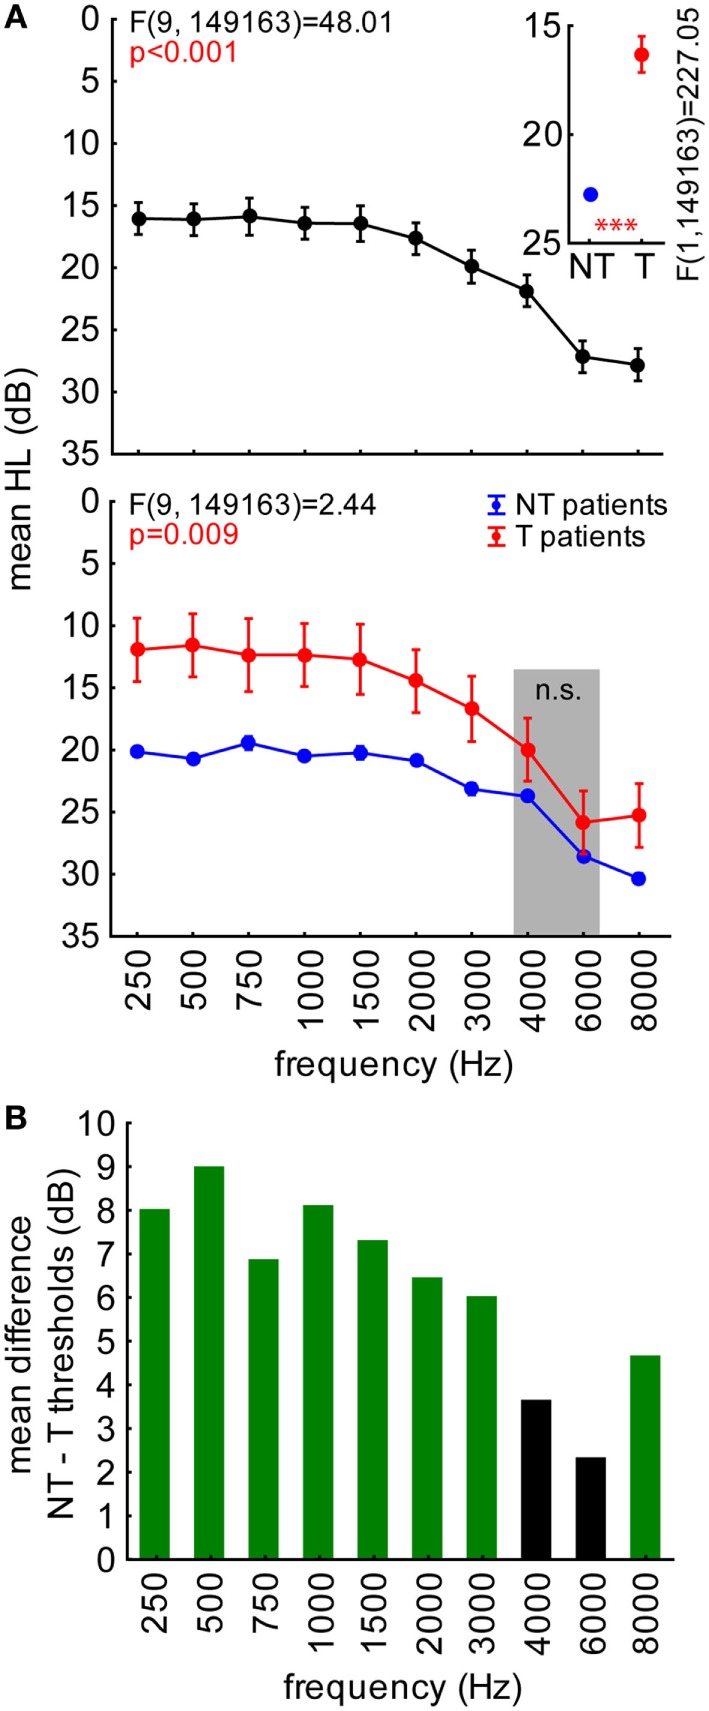
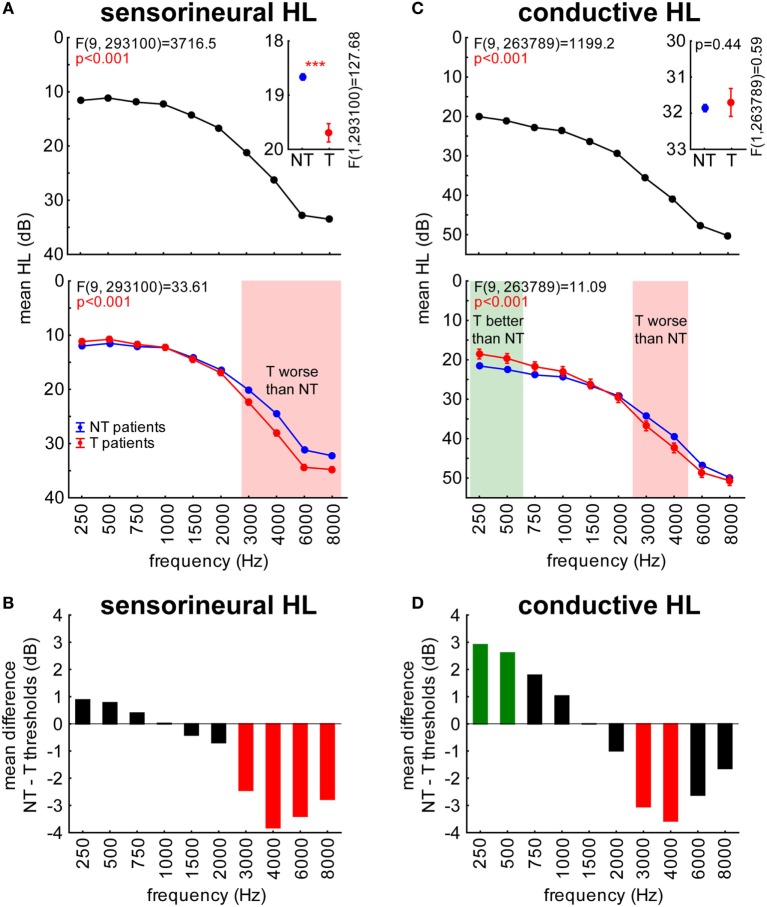
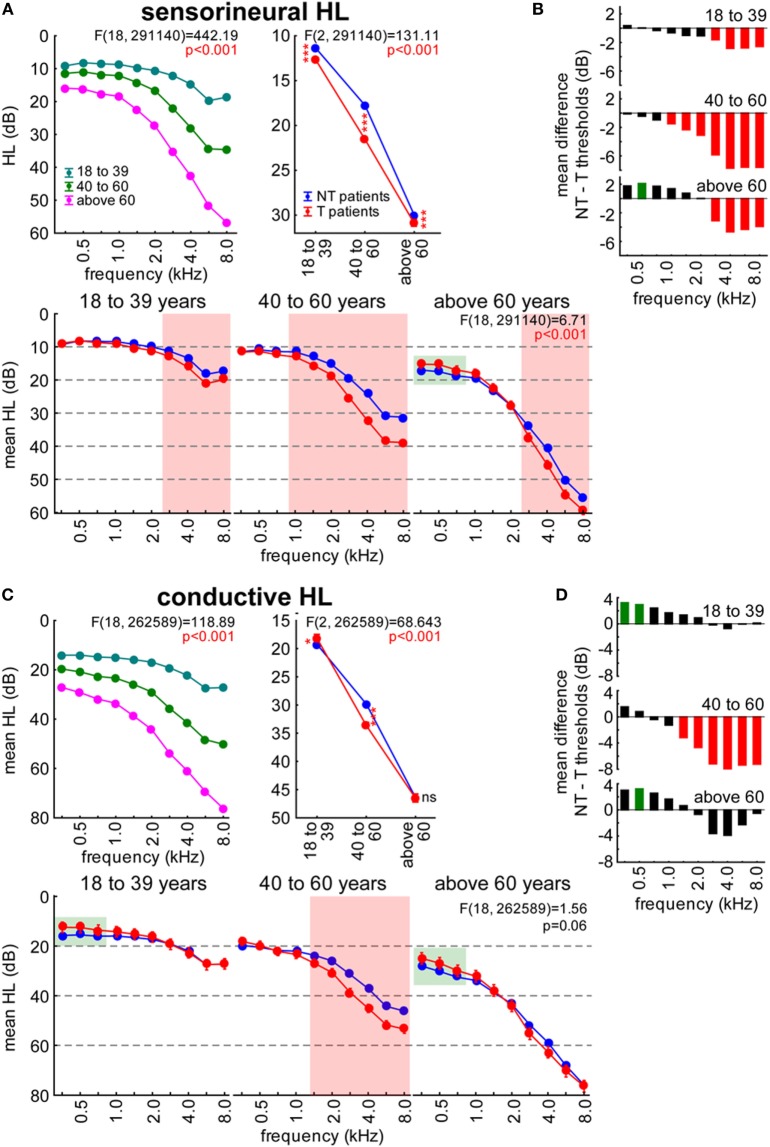
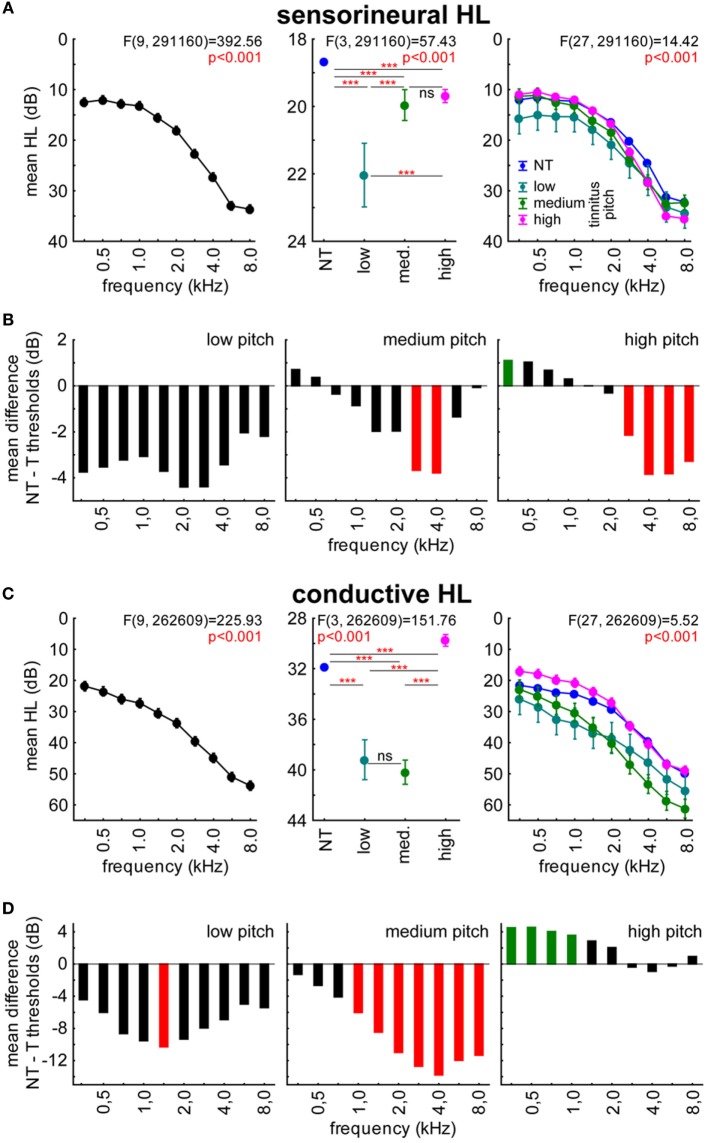
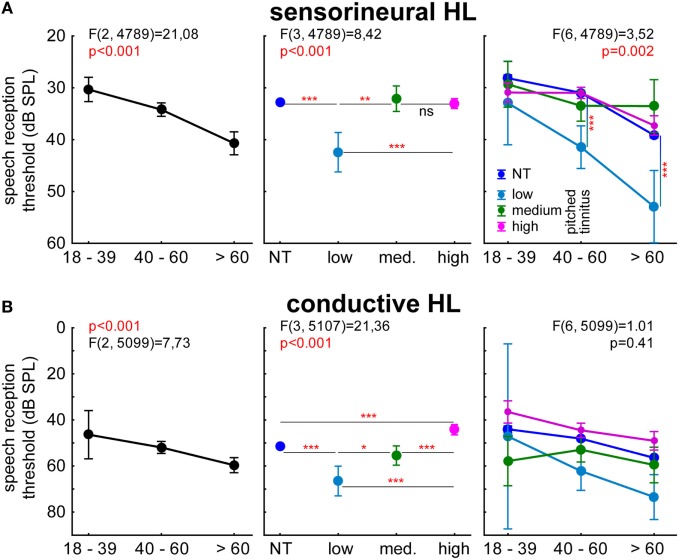
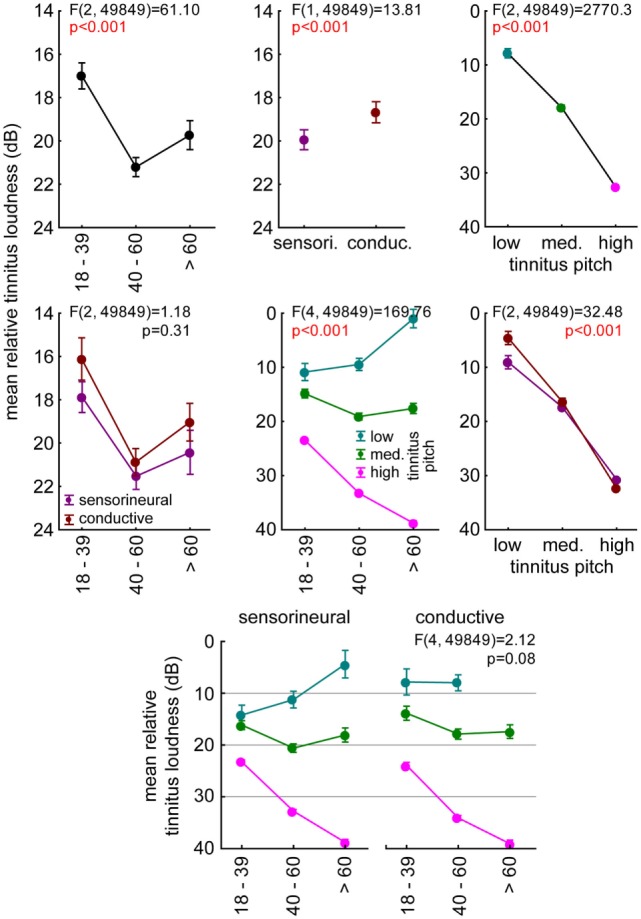
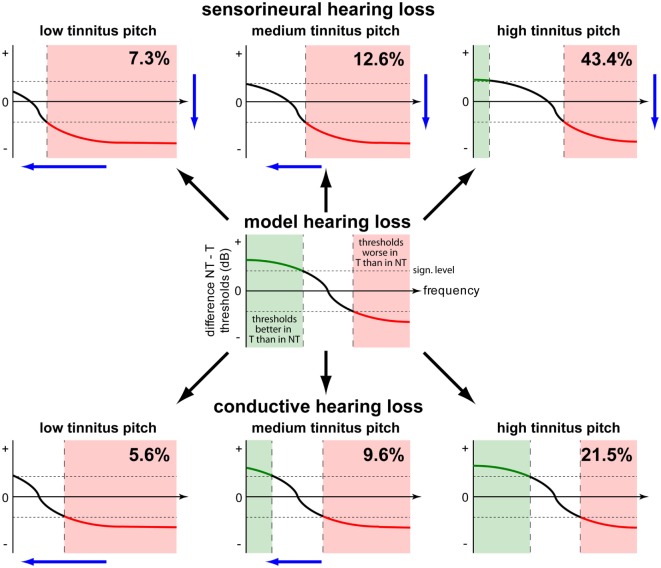
Human hearing loss (HL) and comorbidities like tinnitus pose serious problems for people's daily life, which in most severe cases may lead to social isolation, depression, and suicide. Here, we investigate the relationship between hearing deficits and tinnitus. To this end, we conducted a retrospective study on anonymized pure tone and speech audiometric data from patients of the ENT hospital Erlangen in which we compare audiometric data between patients with and without tinnitus. Overall data from 37,661 patients with sensorineural (SHL) or conductive HL (CHL) with (T, 9.5%) or without (NT, 90.5%) a tinnitus percept in different age groups and with different tinnitus pitches were included in this study. The results of the pure tone audiometry comparisons showed significant differences in T patients compared to NT patients. In young patients, we generally found lower hearing thresholds in T compared to NT patients. In adult patients, differences were more heterogeneous: hearing thresholds in T patients were lower in low frequency ranges, while they were higher at high frequencies. Furthermore, lower thresholds were more often found in CHL patients and could rarely be detected in SHL patients. In speech audiometry, only CHL patients with high-pitched tinnitus showed lower thresholds compared to NT patients' thresholds. The results of this study may point to a biologically plausible functional benefit on hearing thresholds in HL tinnitus patients. We hypothesize that the physiological mechanism of stochastic resonance counteracts HL by adding neuronal noise to the system. This neuronal noise may induce changes in the auditory pathway and finally-as a side effect of threshold improvement-lead to the development of a tinnitus percept. We propose a general model of changed hearing thresholds in T patients, being either decreased or increased compared to NT patients.
Keywords: conductive hearing loss; human; pure tone audiometry; sensorineural hearing loss; speech audiometry; tinnitus model.
Figures
Similar articles
-
Is phase locking crucial to improve hearing thresholds in tinnitus patients?Eur J Neurosci. 2023 Jul;58(1):2361-2366. doi: 10.1111/ejn.16033. Epub 2023 May 24. Eur J Neurosci. 2023. PMID: 37160836
-
Effects of lifetime noise exposure on the middle-age human auditory brainstem response, tinnitus and speech-in-noise intelligibility.Hear Res. 2018 Aug;365:36-48. doi: 10.1016/j.heares.2018.06.003. Epub 2018 Jun 12. Hear Res. 2018. PMID: 29913342
-
Our auditory results using the Vibrant Soundbridge on the long process of the incus: 20 years of data.Auris Nasus Larynx. 2018 Feb;45(1):66-72. doi: 10.1016/j.anl.2017.02.007. Epub 2017 Mar 9. Auris Nasus Larynx. 2018. PMID: 28285827
-
Intratympanic dexamethasone for sudden sensorineural hearing loss after failure of systemic therapy.Laryngoscope. 2007 Jan;117(1):3-15. doi: 10.1097/01.mlg.0000245058.11866.15. Laryngoscope. 2007. PMID: 17202923 Review.
-
[The Erlangen model of tinnitus development-New perspective and treatment strategy].HNO. 2023 Oct;71(10):662-668. doi: 10.1007/s00106-023-01355-1. Epub 2023 Sep 15. HNO. 2023. PMID: 37715002 Free PMC article. Review. German.
Cited by
-
Cross-Modal Stochastic Resonance as a Universal Principle to Enhance Sensory Processing.Front Neurosci. 2018 Aug 21;12:578. doi: 10.3389/fnins.2018.00578. eCollection 2018. Front Neurosci. 2018. PMID: 30186104 Free PMC article. No abstract available.
-
Recurrence Resonance" in Three-Neuron Motifs.Front Comput Neurosci. 2019 Sep 11;13:64. doi: 10.3389/fncom.2019.00064. eCollection 2019. Front Comput Neurosci. 2019. PMID: 31572152 Free PMC article.
-
Comparing Three Established Methods for Tinnitus Pitch Matching With Respect to Reliability, Matching Duration, and Subjective Satisfaction.Trends Hear. 2019 Jan-Dec;23:2331216519887247. doi: 10.1177/2331216519887247. Trends Hear. 2019. PMID: 31805822 Free PMC article.
-
Global 10 year ecological momentary assessment and mobile sensing study on tinnitus and environmental sounds.NPJ Digit Med. 2025 Mar 13;8(1):162. doi: 10.1038/s41746-025-01551-z. NPJ Digit Med. 2025. PMID: 40082697 Free PMC article.
-
Audiological biomarkers of tinnitus in an older Portuguese population.Front Aging Neurosci. 2022 Aug 24;14:933117. doi: 10.3389/fnagi.2022.933117. eCollection 2022. Front Aging Neurosci. 2022. PMID: 36092804 Free PMC article.
References
-
- Coles R. Epidemiology of tinnitus: (2) demographic and clinical features. J Laryngol Otol (1984) 98:195–202.10.1017/S1755146300090466 - DOI
-
- Niskar AS, Kieszak SM, Holmes AE, Esteban E, Rubin C, Brody DJ. Estimated prevalence of noise-induced hearing threshold shifts among children 6 to 19 years of age: the Third National Health and Nutrition Examination Survey, 1988-1994, United States. Pediatrics (2001) 108:40–3.10.1542/peds.108.1.40 - DOI - PubMed
LinkOut - more resources
Full Text Sources
Other Literature Sources
Research Materials
Miscellaneous