

Formation of covalent di-tyrosine dimers in recombinant α-synuclein
- PMID: 28232892
- PMCID: PMC5314896
- DOI: 10.1080/21690707.2015.1071302
Formation of covalent di-tyrosine dimers in recombinant α-synuclein
Abstract
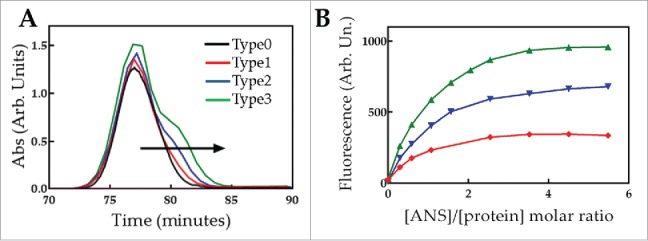
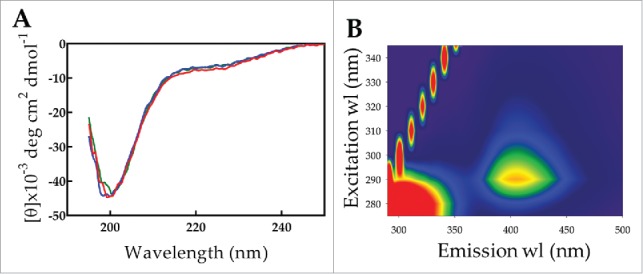
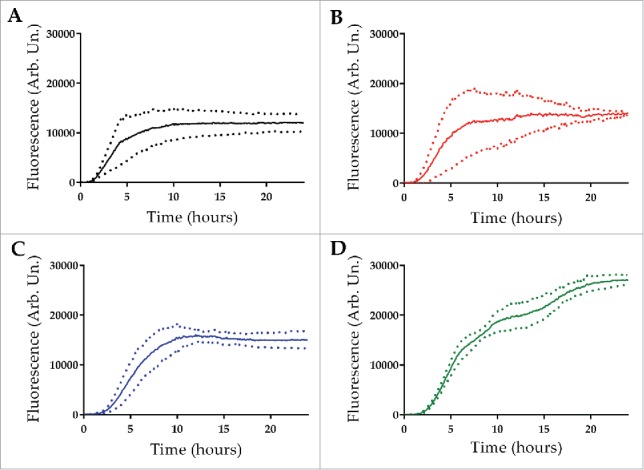
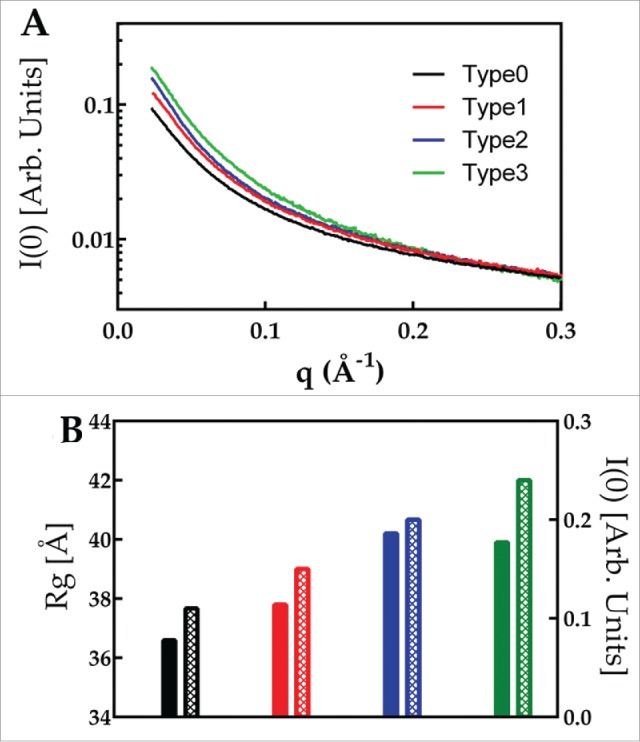
Parkinson's disease is associated with fibril deposition in the diseased brain. Misfolding events of the intrinsically disordered synaptic protein α-synuclein are suggested to lead to the formation of transient oligomeric and cytotoxic species. The etiology of Parkinson's disease is further associated with mitochondrial dysfunction and formation of reactive oxygen species. Oxidative stress causes chemical modification of native α-synuclein, plausibly further influencing misfolding events. Here, we present evidence for the spontaneous formation of covalent di-tyrosine α-synuclein dimers in standard recombinant protein preparations, induced without extrinsic oxidative or nitrative agents. The dimers exhibit no secondary structure but advanced SAXS studies reveal an increased structural definition, resulting in a more hydrophobic micro-environment than the highly disordered monomer. Accordingly, monomers and dimers follow distinct fibrillation pathways.
Keywords: EOM; Parkinson's disease; SAXS; amyloids; di-tyrosine dimers; α-synuclein.
Figures
Similar articles
-
Wild-Type α-Synuclein and Variants Occur in Different Disordered Dimers and Pre-Fibrillar Conformations in Early Stage of Aggregation.Front Mol Biosci. 2022 Jun 28;9:910104. doi: 10.3389/fmolb.2022.910104. eCollection 2022. Front Mol Biosci. 2022. PMID: 35836937 Free PMC article.
-
C-Terminal Tyrosine Residue Modifications Modulate the Protective Phosphorylation of Serine 129 of α-Synuclein in a Yeast Model of Parkinson's Disease.PLoS Genet. 2016 Jun 24;12(6):e1006098. doi: 10.1371/journal.pgen.1006098. eCollection 2016 Jun. PLoS Genet. 2016. PMID: 27341336 Free PMC article.
-
Tyrosine 125 of alpha-synuclein plays a critical role for dimerization following nitrative stress.Brain Res. 2002 May 31;938(1-2):73-80. doi: 10.1016/s0006-8993(02)02498-8. Brain Res. 2002. PMID: 12031537
-
Α-synuclein misfolding and Parkinson's disease.Biochim Biophys Acta. 2012 Feb;1822(2):261-85. doi: 10.1016/j.bbadis.2011.10.002. Epub 2011 Oct 12. Biochim Biophys Acta. 2012. PMID: 22024360 Review.
-
Structural Characteristics of α-Synuclein Oligomers.Int Rev Cell Mol Biol. 2017;329:79-143. doi: 10.1016/bs.ircmb.2016.08.010. Epub 2016 Oct 31. Int Rev Cell Mol Biol. 2017. PMID: 28109332 Review.
Cited by
-
Conformational characterization of nerve growth factor-β reveals that its regulatory pro-part domain stabilizes three loop regions in its mature part.J Biol Chem. 2017 Oct 6;292(40):16665-16676. doi: 10.1074/jbc.M117.803320. Epub 2017 Aug 10. J Biol Chem. 2017. PMID: 28798232 Free PMC article.
-
Modification of Glyceraldehyde-3-Phosphate Dehydrogenase with Nitric Oxide: Role in Signal Transduction and Development of Apoptosis.Biomolecules. 2021 Nov 8;11(11):1656. doi: 10.3390/biom11111656. Biomolecules. 2021. PMID: 34827652 Free PMC article. Review.
-
Opposed Effects of Dityrosine Formation in Soluble and Aggregated α-Synuclein on Fibril Growth.J Mol Biol. 2017 Oct 13;429(20):3018-3030. doi: 10.1016/j.jmb.2017.09.005. Epub 2017 Sep 13. J Mol Biol. 2017. PMID: 28918091 Free PMC article.
-
Structural Basis for Dityrosine-Mediated Inhibition of α-Synuclein Fibrillization.J Am Chem Soc. 2022 Jul 13;144(27):11949-11954. doi: 10.1021/jacs.2c03607. Epub 2022 Jun 24. J Am Chem Soc. 2022. PMID: 35749730 Free PMC article.
-
Megadalton-sized Dityrosine Aggregates of α-Synuclein Retain High Degrees of Structural Disorder and Internal Dynamics.J Mol Biol. 2020 Dec 4;432(24):166689. doi: 10.1016/j.jmb.2020.10.023. Epub 2020 Oct 22. J Mol Biol. 2020. PMID: 33211011 Free PMC article.
References
-
- Eisenberg D, Jucker M. The amyloid state of proteins in human diseases. Cell 2012; 148:1188-203; PMID:22424229; http://dx.doi.org/10.1016/j.cell.2012.02.022 - DOI - PMC - PubMed
-
- Hwang O. Role of oxidative stress in Parkinson's disease. Exp Neurobiol 2013; 22:11-7; PMID:23585717; http://dx.doi.org/10.5607/en.2013.22.1.11 - DOI - PMC - PubMed
-
- Spillantini MG, Schmidt ML, Lee VM, Trojanowski JQ, Jakes R, Goedert M. Alpha-synuclein in Lewy bodies. Nature 1997; 388:839-40; PMID:9278044; http://dx.doi.org/10.1038/42166 - DOI - PubMed
-
- Lashuel HA, Overk CR, Oueslati A, Masliah E. The many faces of alpha-synuclein: from structure and toxicity to therapeutic target. Nat Rev Neurosci 2013; 14:38-48; PMID:23254192; http://dx.doi.org/10.1038/nrn3406 - DOI - PMC - PubMed
-
- Burre J, Vivona S, Diao J, Sharma M, Brunger AT, Sudhof TC. Properties of native brain alpha-synuclein. Nature 2013; 498:107-10; http://dx.doi.org/10.1038/nature12125 - DOI - PMC - PubMed
LinkOut - more resources
Full Text Sources
Other Literature Sources
Molecular Biology Databases