

Mechanical diagnosis of human erythrocytes by ultra-high speed manipulation unraveled critical time window for global cytoskeletal remodeling
- PMID: 28233788
- PMCID: PMC5324053
- DOI: 10.1038/srep43134
Mechanical diagnosis of human erythrocytes by ultra-high speed manipulation unraveled critical time window for global cytoskeletal remodeling
Abstract
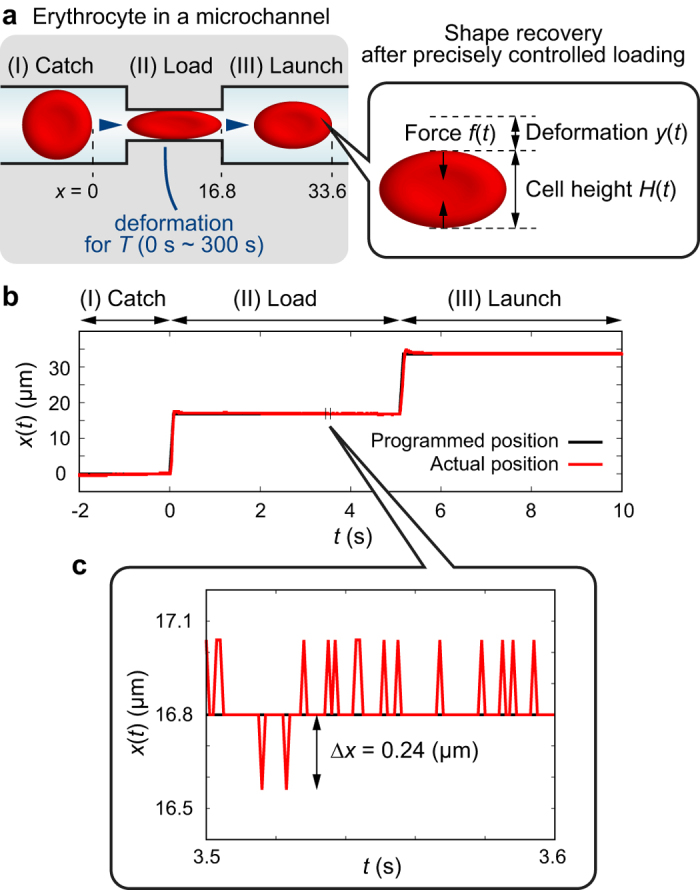
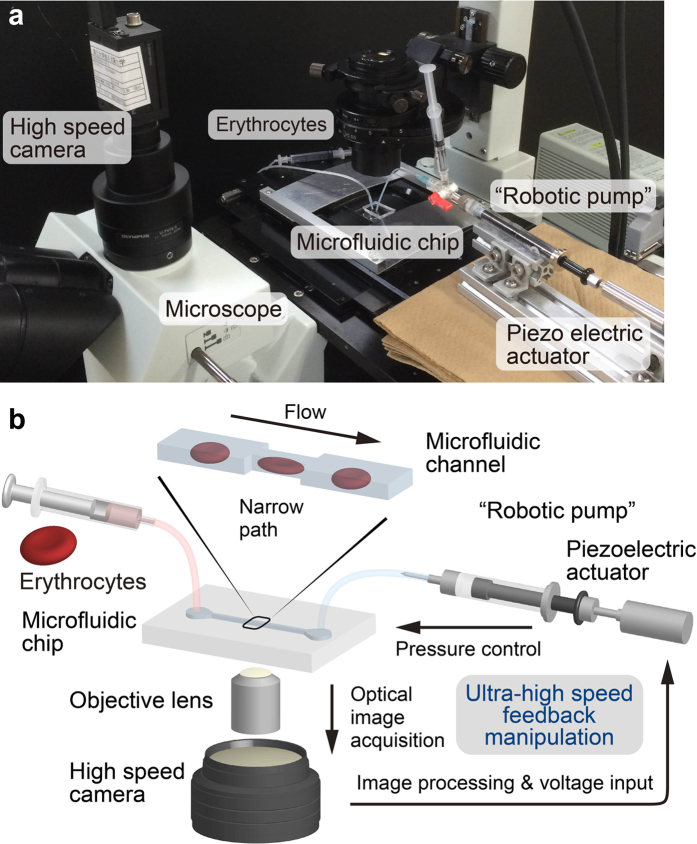
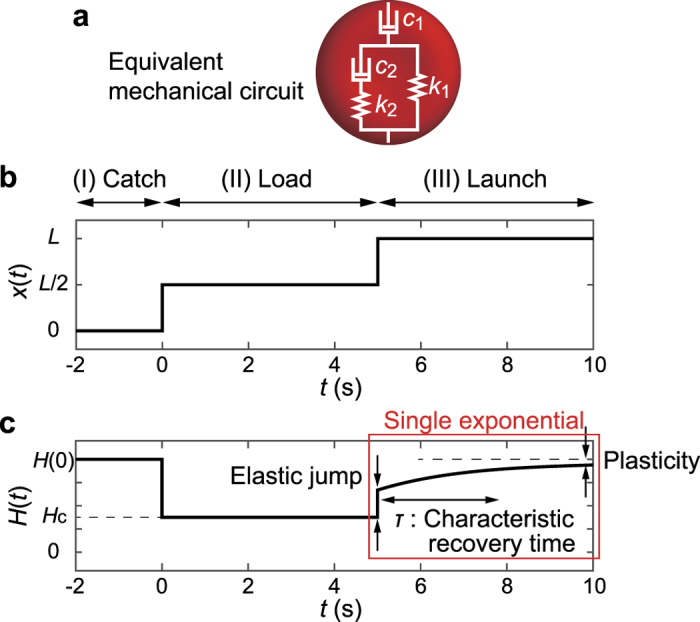
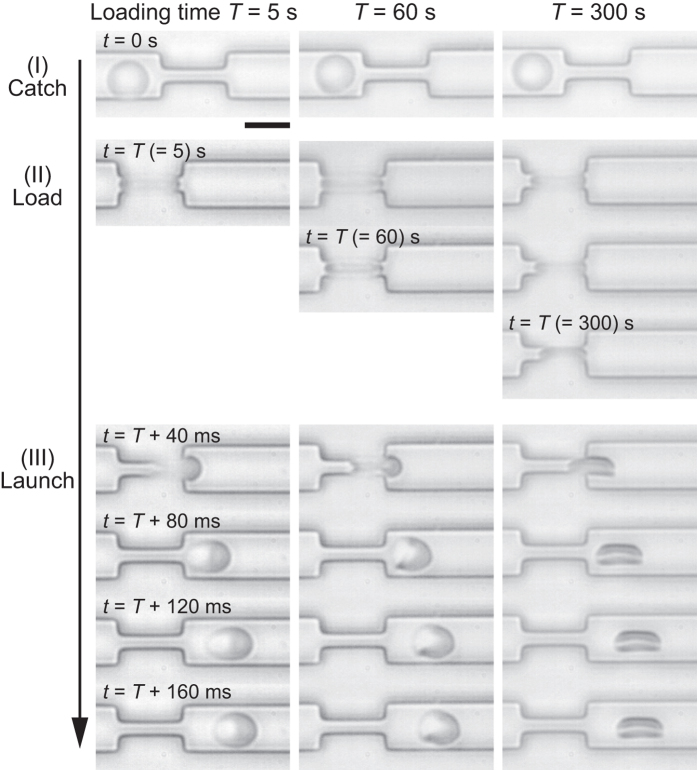
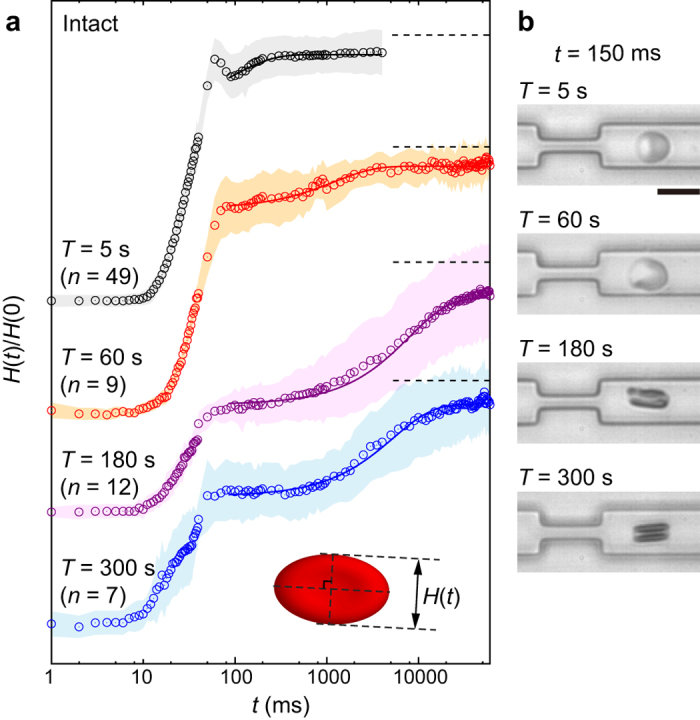
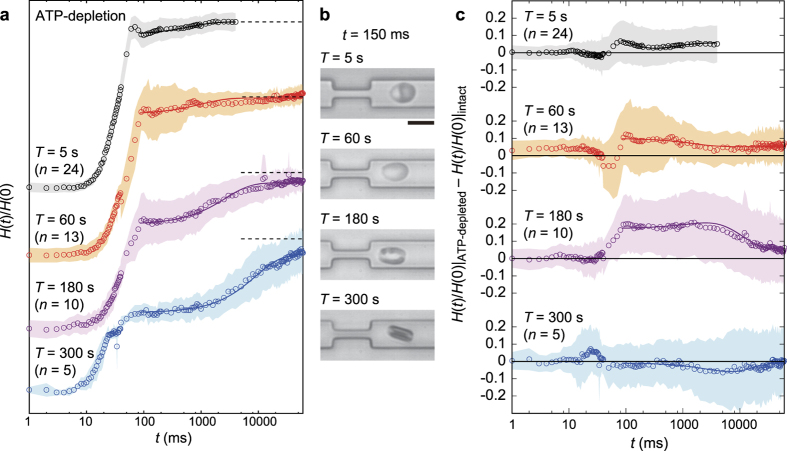
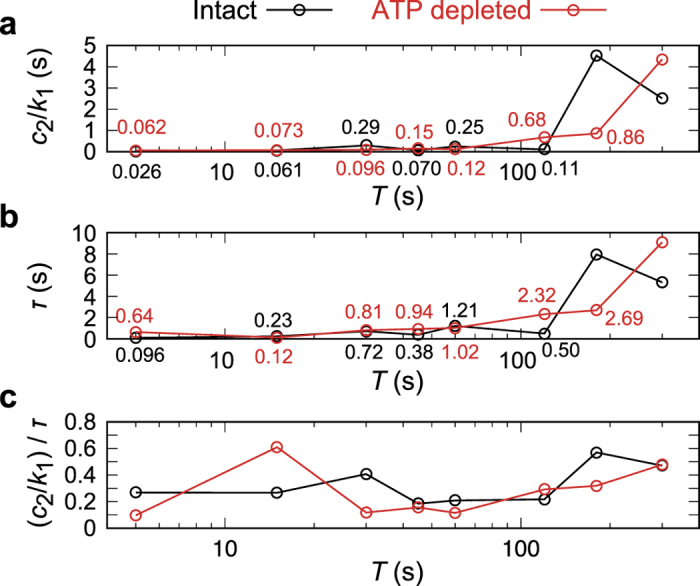
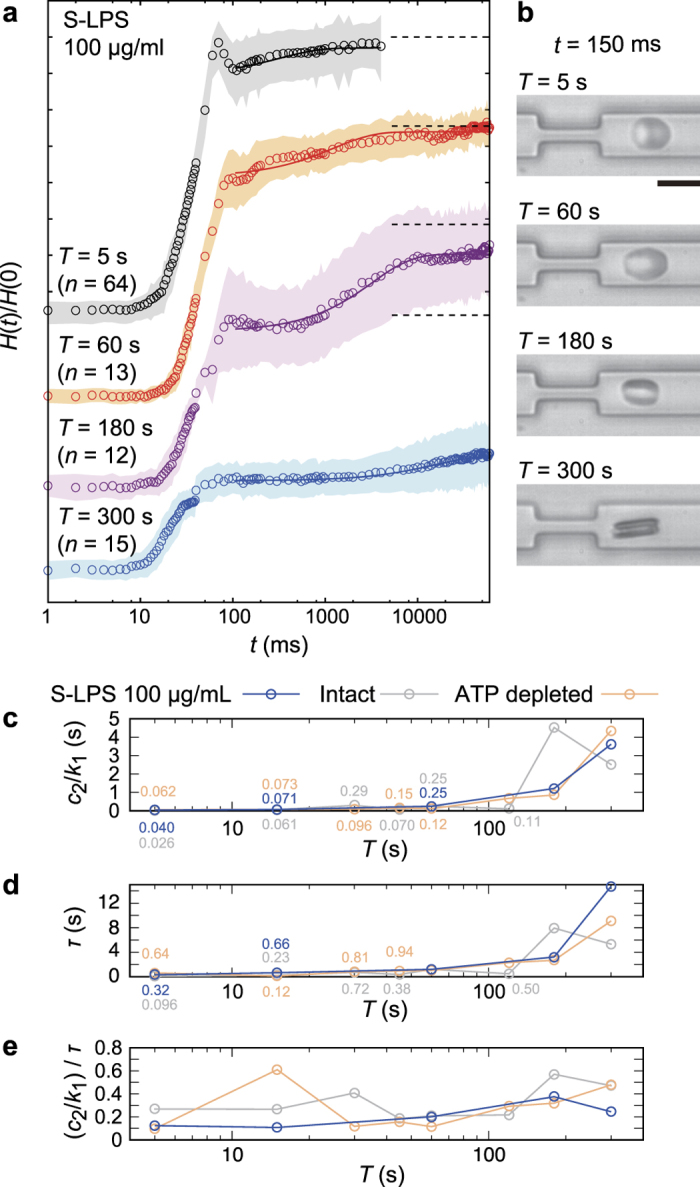
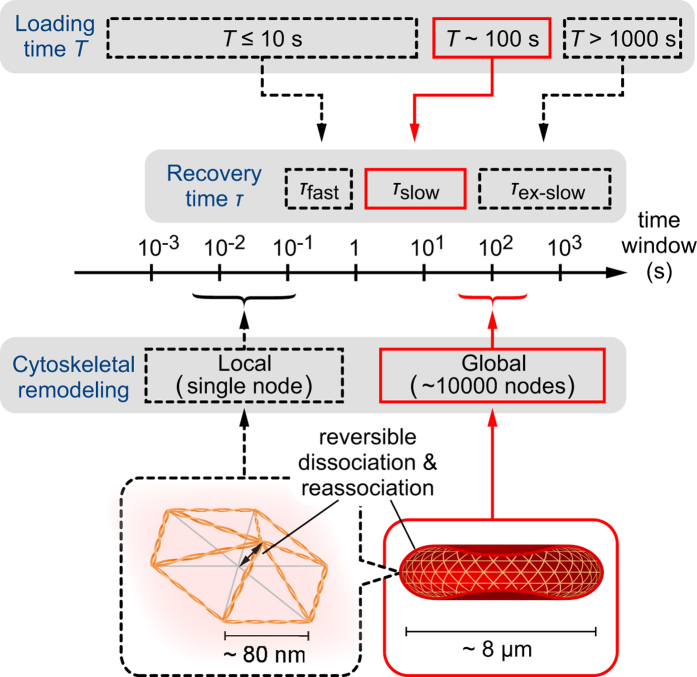
Large deformability of erythrocytes in microvasculature is a prerequisite to realize smooth circulation. We develop a novel tool for the three-step "Catch-Load-Launch" manipulation of a human erythrocyte based on an ultra-high speed position control by a microfluidic "robotic pump". Quantification of the erythrocyte shape recovery as a function of loading time uncovered the critical time window for the transition between fast and slow recoveries. The comparison with erythrocytes under depletion of adenosine triphosphate revealed that the cytoskeletal remodeling over a whole cell occurs in 3 orders of magnitude longer timescale than the local dissociation-reassociation of a single spectrin node. Finally, we modeled septic conditions by incubating erythrocytes with endotoxin, and found that the exposure to endotoxin results in a significant delay in the characteristic transition time for cytoskeletal remodeling. The high speed manipulation of erythrocytes with a robotic pump technique allows for high throughput mechanical diagnosis of blood-related diseases.
Conflict of interest statement
The authors declare no competing financial interests.
Figures
Similar articles
-
Dynamics of shear-induced ATP release from red blood cells.Proc Natl Acad Sci U S A. 2008 Oct 28;105(43):16432-7. doi: 10.1073/pnas.0805779105. Epub 2008 Oct 15. Proc Natl Acad Sci U S A. 2008. PMID: 18922780 Free PMC article.
-
Microconfined flow behavior of red blood cells.Med Eng Phys. 2016 Jan;38(1):11-6. doi: 10.1016/j.medengphy.2015.05.007. Epub 2015 Jun 10. Med Eng Phys. 2016. PMID: 26071649
-
High-Throughput Microfluidic Characterization of Erythrocyte Shapes and Mechanical Variability.Biophys J. 2019 Jul 9;117(1):14-24. doi: 10.1016/j.bpj.2019.05.022. Epub 2019 May 29. Biophys J. 2019. PMID: 31235179 Free PMC article.
-
Dependence of spectrin organization in red blood cell membranes on cell metabolism: implications for control of red cell shape, deformability, and surface area.Semin Hematol. 1979 Jan;16(1):75-93. Semin Hematol. 1979. PMID: 154737 Review. No abstract available.
-
Cellular-scale hydrodynamics.Biomed Mater. 2008 Sep;3(3):034011. doi: 10.1088/1748-6041/3/3/034011. Epub 2008 Sep 3. Biomed Mater. 2008. PMID: 18765900 Review.
Cited by
-
Fatigue of red blood cells under periodic squeezes in ECMO.Proc Natl Acad Sci U S A. 2022 Dec 6;119(49):e2210819119. doi: 10.1073/pnas.2210819119. Epub 2022 Dec 1. Proc Natl Acad Sci U S A. 2022. PMID: 36454755 Free PMC article.
-
Axial and Nonaxial Migration of Red Blood Cells in a Microtube.Micromachines (Basel). 2021 Sep 28;12(10):1162. doi: 10.3390/mi12101162. Micromachines (Basel). 2021. PMID: 34683214 Free PMC article.
-
Rotational manipulation of a microscopic object inside a microfluidic channel.Biomicrofluidics. 2020 Oct 27;14(5):054106. doi: 10.1063/5.0013309. eCollection 2020 Sep. Biomicrofluidics. 2020. PMID: 33163134 Free PMC article.
-
Fabrication of Microparticles with Front-Back Asymmetric Shapes Using Anisotropic Gelation.Micromachines (Basel). 2021 Sep 17;12(9):1121. doi: 10.3390/mi12091121. Micromachines (Basel). 2021. PMID: 34577764 Free PMC article.
-
Deformation of a Red Blood Cell in a Narrow Rectangular Microchannel.Micromachines (Basel). 2019 Mar 21;10(3):199. doi: 10.3390/mi10030199. Micromachines (Basel). 2019. PMID: 30901883 Free PMC article.
References
-
- Evans E. A. & La Celle P. L. Intrinsic material properties of the erythrocyte membrane indicated by mechanical analysis of deformation. Blood 45, 29–43 (1975). - PubMed
Publication types
MeSH terms
Substances
LinkOut - more resources
Full Text Sources
Other Literature Sources
