. 2017 Feb 24:7:43231.
doi: 10.1038/srep43231.

A highly reproducible quantitative viral outgrowth assay for the measurement of the replication-competent latent HIV-1 reservoir

Affiliations

A highly reproducible quantitative viral outgrowth assay for the measurement of the replication-competent latent HIV-1 reservoir

Axel Fun et al. Sci Rep. .

Abstract

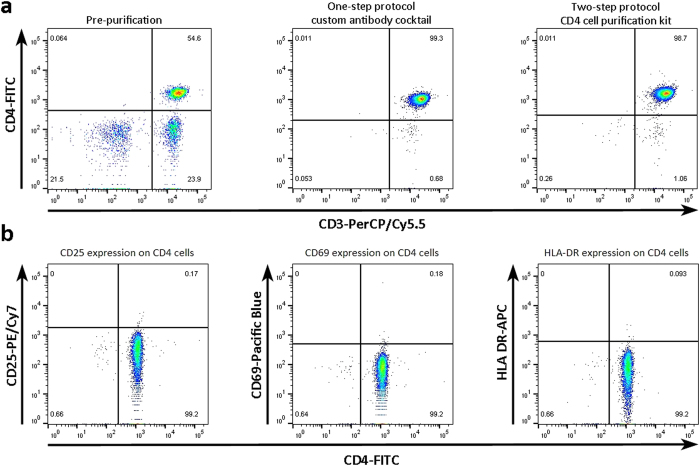
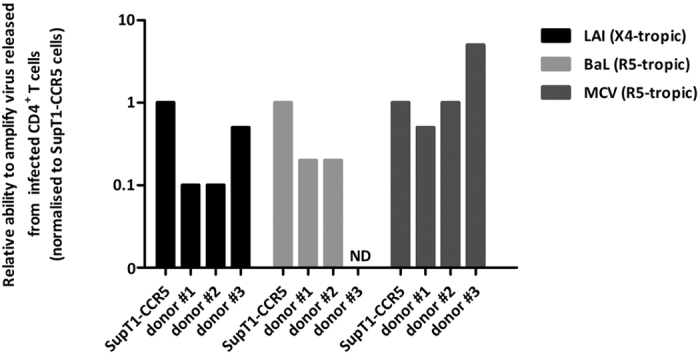
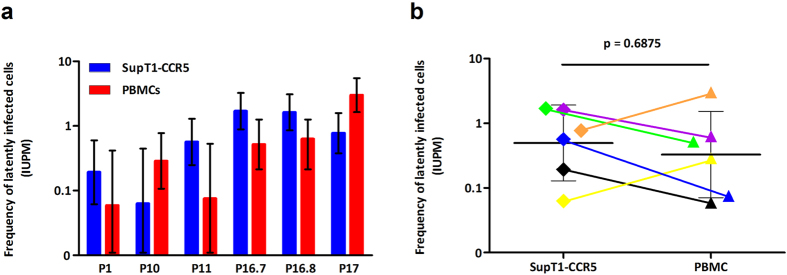
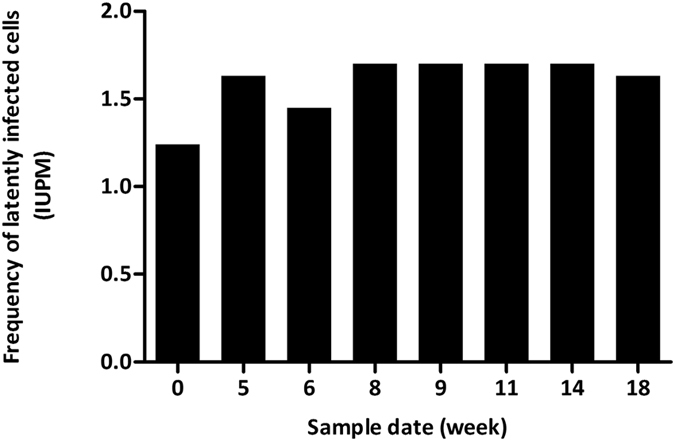
Cure of Human Immunodeficiency Virus (HIV) infection remains elusive due to the persistence of HIV in a latent reservoir. Strategies to eradicate latent infection can only be evaluated with robust, sensitive and specific assays to quantitate reactivatable latent virus. We have taken the standard peripheral blood mononuclear cell (PBMC) based viral outgrowth methodology and from it created a logistically simpler and more highly reproducible assay to quantify replication-competent latent HIV in resting CD4+ T cells, both increasing accuracy and decreasing cost and labour. Purification of resting CD4+ T cells from whole PBMC is expedited and achieved in 3 hours, less than half the time of conventional protocols. Our indicator cell line, SupT1-CCR5 cells (a clonal cell line expressing CD4, CXCR4 and CCR5) provides a readily available standardised readout. Reproducibility compares favourably to other published assays but with reduced cost, labour and assay heterogeneity without compromising sensitivity.


Conflict of interest statement

The authors declare no competing financial interests.

Figures

Figure 1
Figure 1. The custom antibody kit yields highly purified resting CD4+ T cells.
(a) Resting CD4+ T cells obtained with the one-step protocol (middle panel) or total CD4+ T cells with the two-step protocol (right panel) were stained with anti-CD3-PerCP/Cy5.5 and anti-CD4-FITC and their purity was analysed by flow cytometry. Both methods yielded equally pure CD4+ T cell populations. (b) To test if activated CD4+ T cells were efficiently depleted by the custom antibody kit, isolated cells were stained with anti-CD4-FITC, anti-CD25-PE/Cy7, anti-CD69-Pacific Blue and anti-HLA-DR-APC and their purity was analysed by flow cytometry. No activated cell contamination was observed.
Figure 2
Figure 2. Ability of different amplifier cells to support viral replication of virus released from infected cells.
Serial dilutions of infected CD4+ T cells (supplemented to a total of 500000 CD4+ T cells with uninfected CD4+ T cells) were co-cultured with 5 × 105 SupT1-CCR5 cells or 1.34 × 106 CD8-depleted PBMCs from three unselected healthy donors. After 21 days of co-culture mimicking assay conditions, viral production was measured by HIV p24 ELISA. Results were normalised to the lowest number of infected cells that sustained viral replication in SupT1-CCR5 cells. A reading higher than 1 indicates the donor PBMCs were able to amplify virus from fewer infected cells than the SupT1-CCR5 cells and a reading lower than 1 that they required more infected input cells than SupT1-CCR5 cells. (ND - not detected). No viral replication was detected for donor 3 at the highest concentration of BaL infected cells.
Figure 3
Figure 3. Direct comparison of the SupT1-CCR5 cell based assay with the ‘standard’ PBMC based assay.
(a) Purified resting CD4+ T cells were split in half and parallel assays run with SupT1-CCR5 cells (blue bars) and CD8-depleted PBMCs as amplifier cells (red bars). PBMCs were from unselected seronegative donors. Patient identifiers are depicted on the X-axis, P16.7 and P16.8 were samples from the same patient taken at different time points. Error bars indicate the 95% confidence interval (CI) for each individual assay. (b) There was no statistically significant difference in IUPM values between the two types of amplifier cells. Colours indicate the corresponding samples from the same patient and are connected by a coloured line. Horizontal bars represent the geometric mean of each data set and the error bars indicate the 95% CI. P-value was calculated using a Wilcoxon matched pairs test.
Figure 4
Figure 4. The SupT1-CCR5 cell based viral outgrowth assay has excellent reproducibility.
Blood was collected from a patient undergoing regular venesection for the treatment of haemochromatosis (P16, Table 1). SupT1-CCR5 cell-based viral outgrowth assays were performed on a set of 8 blood samples from this patient to assess the reproducibility of the assay. The date of venesection is depicted on the X-axis with the first sample set as week 0.
Figure 5
Figure 5. Size of the replication-competent latent HIV reservoir as determined by the SupT1-CCR5 cell based viral outgrowth assay.
The assay was tested on a cohort of 25 patients, 20 of whom were virologically suppressed and 5 untreated patients (Table 1). Viraemic patients had a statistically significant larger latent HIV reservoir than aviraemic patients. Horizontal bars represent the geometric mean of each data set. LoD indicates the limit of detection. The samples indicated in red were negative and therefore have an IUPM < 0.046–0.052, the LoD of the assay with the number of input cells used in these four assays. P-value was calculated using a Mann-Whitney test.
Figure 6
Figure 6. SupT1-CCR5 cells induce syncytia formation upon HIV infection.
(a) During culture, SupT1-CCR5 cells cluster together in clumps. Mixing the cells disrupts the clumps and creates a single cell suspension which can aid the detection of syncytia. The different stages of progressive infection from non-infected cells to widespread CPE in a SupT1-CCR5 culture infected with HIV from reactivated patient-derived CD4+ T cells. The black arrows in the Stage 1 panel point the first appearances of syncytia in the culture. (b) Correlation between p24 and CPE read-out. From 18/25 assays comprehensive CPE data was available. The number of positive wells scored by observation of syncytia was converted into an IUPM for each assay and compared to the IUPM based on p24 production. There was a strong correlation between the two read-out methods (Pearson’s correlation coefficient, r = 0.9998).

References

    1. Ray M. et al.. The effect of combined antiretroviral therapy on the overall mortality of HIV-infected individuals. Aids 24, 123–137 (2010). - PMC - PubMed
    1. Davey R. T. Jr. et al.. HIV-1 and T cell dynamics after interruption of highly active antiretroviral therapy (HAART) in patients with a history of sustained viral suppression. Proc Natl Acad Sci USA 96, 15109–15114 (1999). - PMC - PubMed
    1. Li J. Z. et al.. The size of the expressed HIV reservoir predicts timing of viral rebound after treatment interruption. Aids 30, 343–353 (2016). - PMC - PubMed
    1. Calin R. et al.. Treatment interruption in chronically HIV-infected patients with an ultralow HIV reservoir. Aids 30, 761–769 (2016). - PubMed
    1. Chun T. W. et al.. Rebound of plasma viremia following cessation of antiretroviral therapy despite profoundly low levels of HIV reservoir: implications for eradication. Aids 24, 2803–2808 (2010). - PMC - PubMed

Publication types