. 2017 Feb 24:7:43228.
doi: 10.1038/srep43228.

Transcriptional mechanism of vascular endothelial growth factor-induced expression of protein kinase CβII in chronic lymphocytic leukaemia cells

Affiliations

Transcriptional mechanism of vascular endothelial growth factor-induced expression of protein kinase CβII in chronic lymphocytic leukaemia cells

Ola Al-Sanabra et al. Sci Rep. .

Abstract

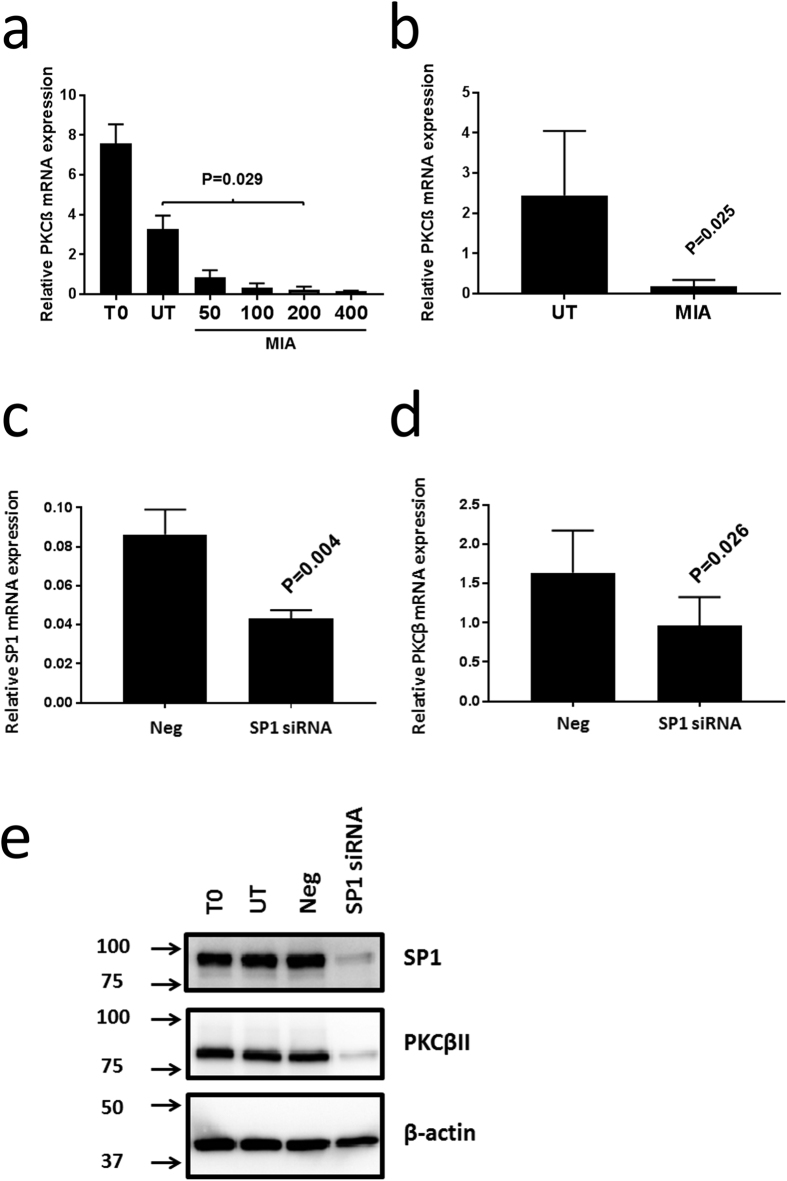
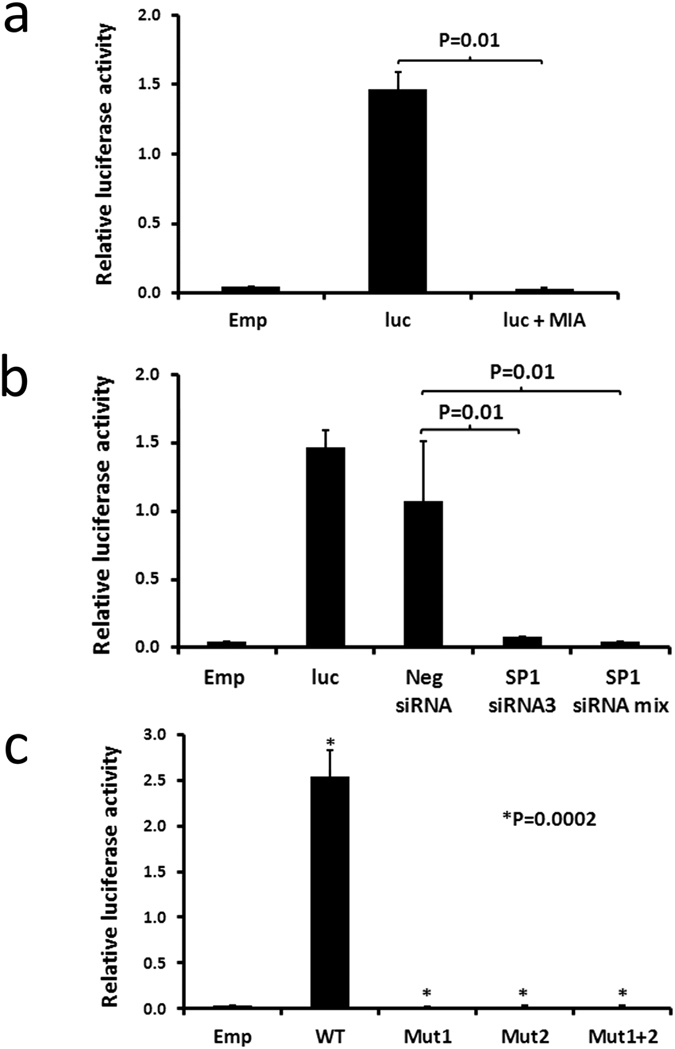
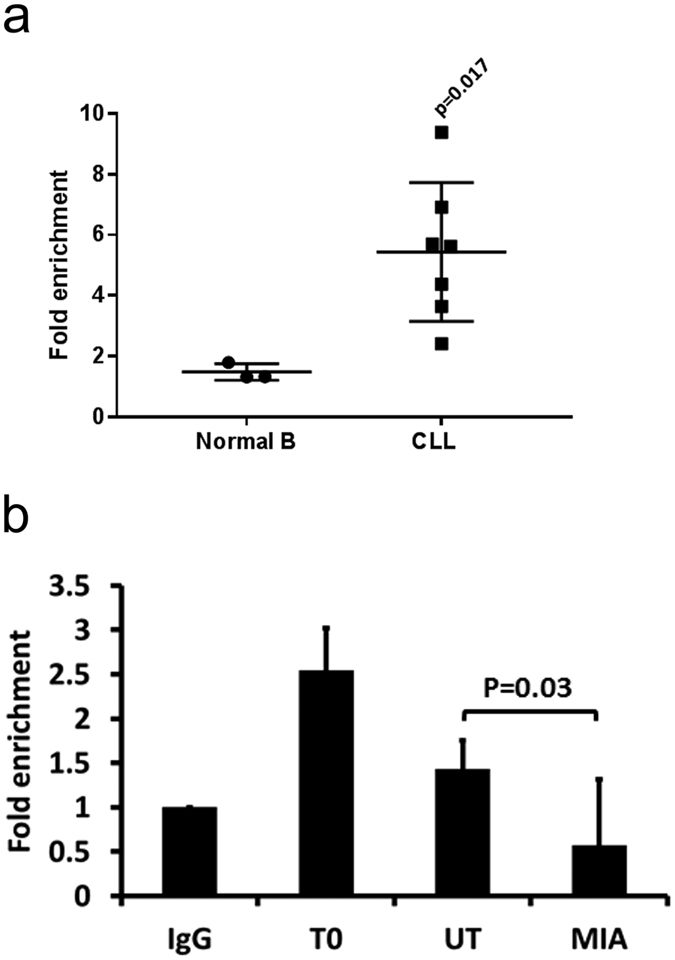
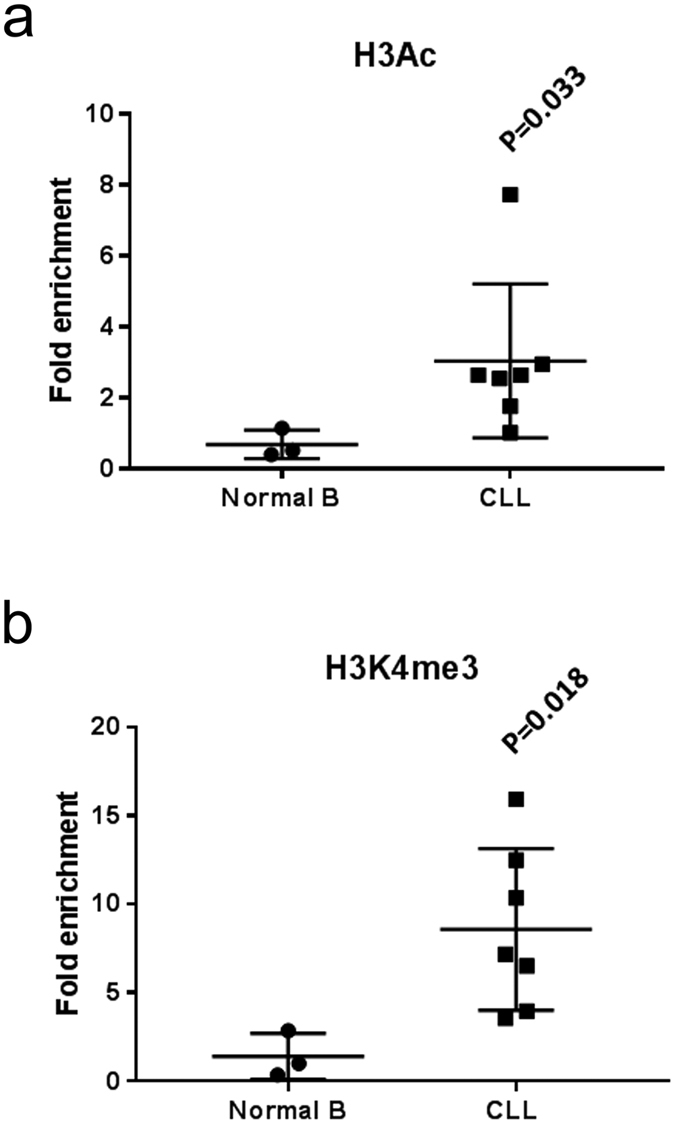
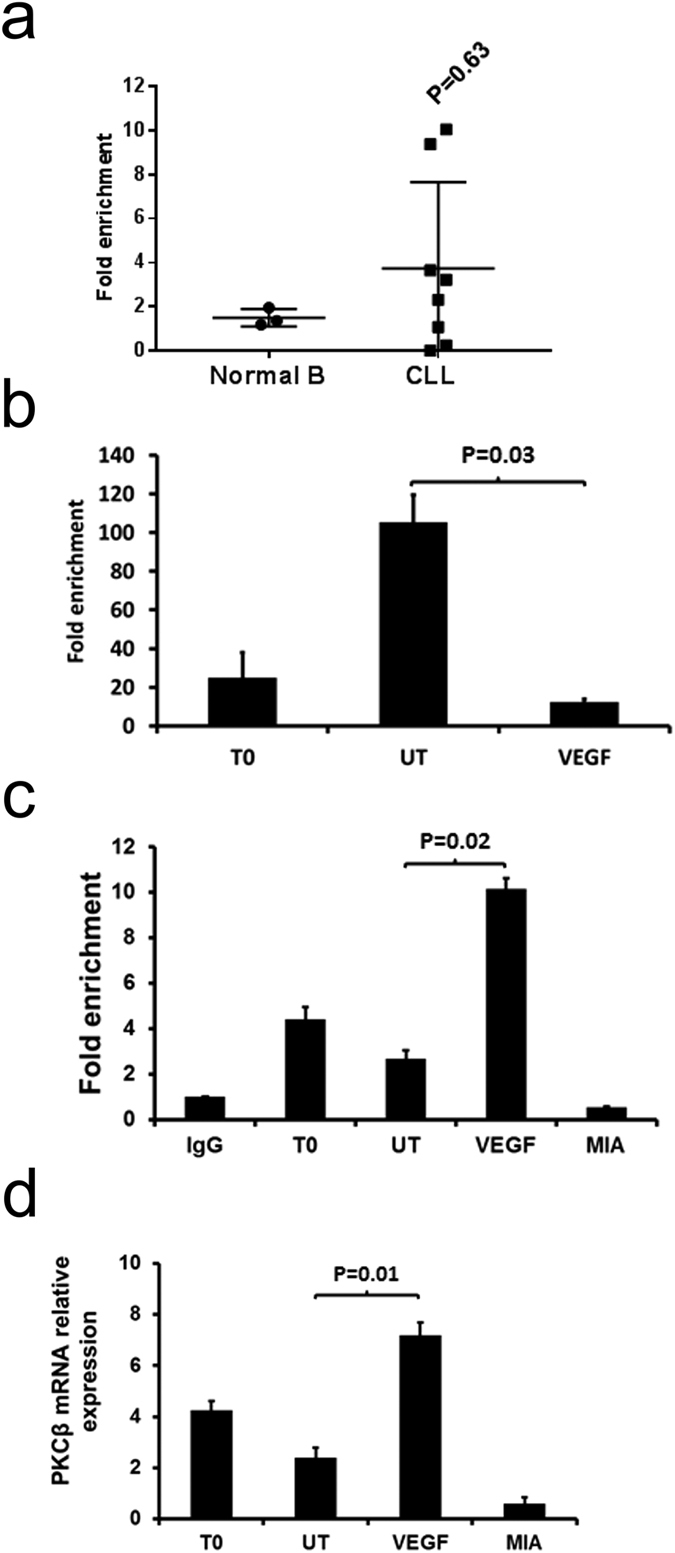
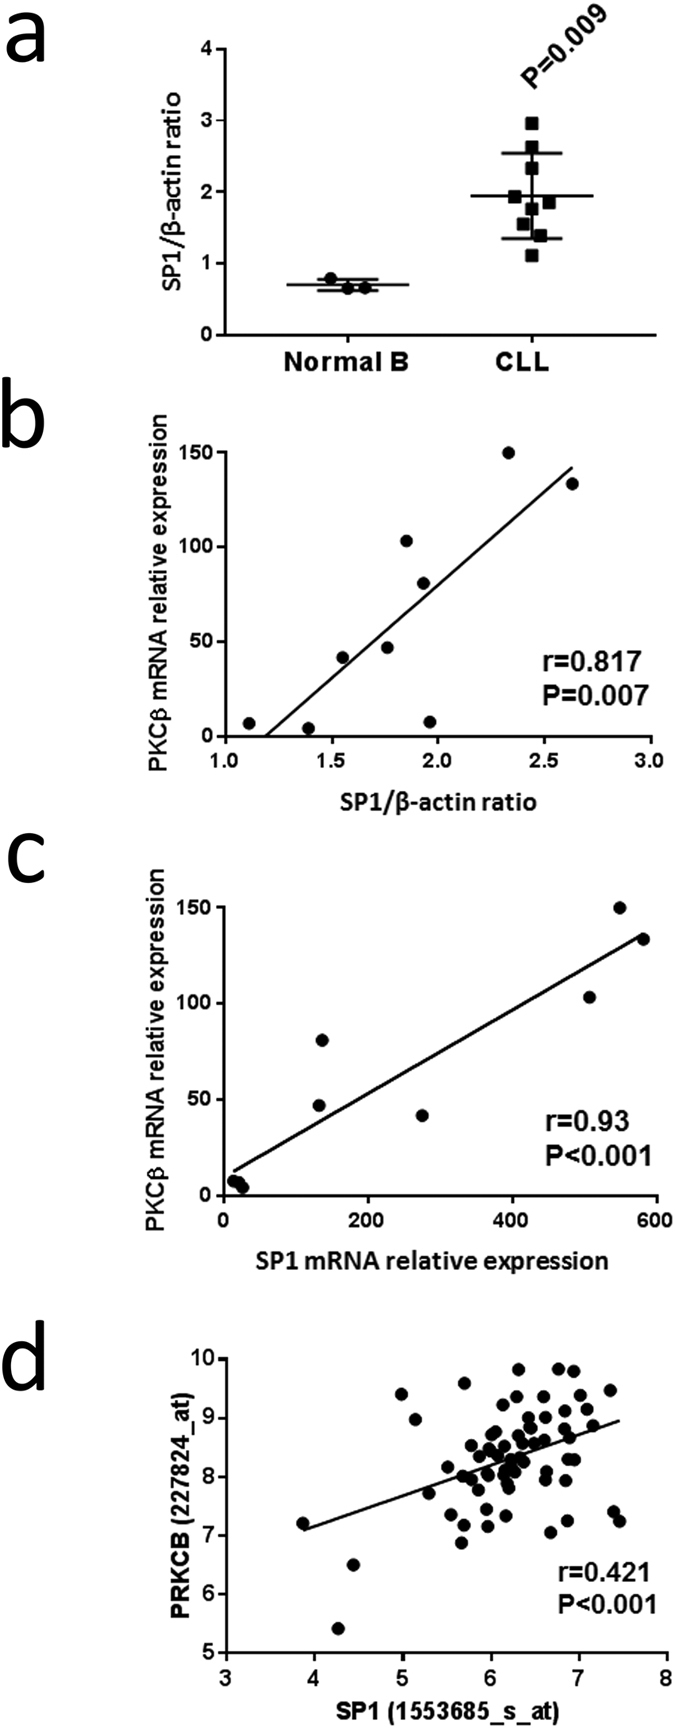
A key feature of chronic lymphocytic leukaemia (CLL) cells is overexpressed protein kinase CβII (PKCβII), an S/T kinase important in the pathogenesis of this and other B cell malignancies. The mechanisms contributing to enhanced transcription of the gene coding for PKCβII, PRKCB, in CLL cells remain poorly described, but could be important because of potential insight into how the phenotype of these cells is regulated. Here, we show that SP1 is the major driver of PKCβII expression in CLL cells where enhanced association of this transcription factor with the PRKCB promoter is likely because of the presence of histone marks permissive of gene activation. We also show how vascular endothelial growth factor (VEGF) regulates PRKCB promoter function in CLL cells, stimulating PKCβ gene transcription via increased association of SP1 and decreased association of STAT3. Taken together, these results are the first to demonstrate a clear role for SP1 in the up regulation of PKCβII expression in CLL cells, and the first to link SP1 with the pathogenesis of this and potentially other B cell malignancies where PKCβII is overexpressed.


Conflict of interest statement

The authors declare no competing financial interests.

Figures

Figure 1
Figure 1. Mithramycin and SP1-specific siRNA reduce PKCβII mRNA and protein levels in CLL cells.
1 × 107 CLL cells were cultured for 24 h in the presence of indicated concentrations of mithramycin (in nmol/L), or were nucleofected with the indicated SP1-specific or control siRNA oligonucleotides (Neg) and then cultured as described in the materials and methods. PKCβII mRNA levels were then measured by qRT-PCR and are reported relative to RNApolII expression. (a) PKCβII mRNA levels in CLL cells from a single patient. T0 indicates CLL cells used directly after thawing. UT indicates CLL cells cultured for 24 h. MIA indicates CLL cells cultured for 24 h with the indicated concentrations of mithramycin (in nmol/L). The results show mean ± SE of n = 3 separate experiments. (b) Effect of 200 nM mithramycin on PKCβII mRNA levels in CLL cells taken from 5 patients (mean ± SD). (c) Effect of SP1 siRNA compared to negative control siRNA (Neg) on primary CLL cells with respect to SP1 mRNA (mean ± SD of n = 4 experiments). (d) Effect of SP1 siRNA compared to negative control siRNA (Neg) on primary CLL cells with respect to PKCβ mRNA (mean ± SD of n = 3 experiments). (e) Western blot showing the effect of SP1 siRNA and negative control siRNA (Neg) on primary CLL cells with respect to SP1 and PKCβII protein levels (n = 1 experiment). Western blots (cropped images) were performed using 10 μg of total cellular protein derived from CLL cell lysates. In Parts a and b mithramycin treatment had no effect on overall CLL cell viability. In Parts c and d, CLL cell viability was equivalent between control and SP1-specific siRNA treated cells. Statistical analysis for this figure was performed using a student’s t-test for paired data.
Figure 2
Figure 2. PRKCB promoter-driven luciferase expression in MEC1 cells is mediated by SP1.
2 × 106 MEC1 cells were transfected either with empty pGL3 and pRL (Emp), or with pGL3-pkcβ-0.5 and pRL (luc) according to the procedure outlined in the materials and methods. (a) Effect of mithramycin. Cells were cultured for 24 h under serum-rich conditions, and then transferred into serum-free conditions for a further 48 h. For the final 24 h, 200 nM mithramycin (MIA) was added where indicated. (b) The effect of siRNA knockdown of SP1 expression was performed by co-transfection of the cells with either control or SP1-specific siRNA as indicated. Following culture for 72 h, the cells were harvested and a luciferase assay was performed. (c) The effects of site directed mutagenesis of the SP1 binding sites in the PRKCB promoter was investigated. MEC1 cells were transfected with pGL3 (Emp), wt pGL3-pkcβ-0.5 (WT), or with pGL3-pkcβ-0.5 containing a mutation within the SP1 binding site 1 (Mut 1), site 2 (Mut 2) or site 1 and 2 (Mut 1 + 2). Luciferase assays were performed following 72 h culture of the cells under serum-rich conditions. In all parts of this figure the data presented represent mean ± SE of n = 3 replicate experiments. Statistical analysis was performed using a students t-test for paired data.
Figure 3
Figure 3. SP1 binds to the PRKCB promoter sequence in CLL cells.
ChIP analysis of SP1 binding to the PRKCB promoter. (a) CLL and normal B cell extracts from 5 × 106 cells were prepared and SP1 was immunoprecipitated. PRKCB promoter sequences associated with SP1 were detected by qPCR and are presented as fold enrichment compared to the PRKCB promoter sequences associated with the non-specific IgG immunoprecipitation control. The mean ± SD of these experiments is displayed. Statistical analysis was performed using a Mann-Whitney U-test. (b) 5 × 106 CLL cells were used either immediately after thawing (T0), or were incubated for 24 h in the absence (UT) or presence of 200 nM mithramycin (MIA). SP1 was immunoprecipitated from prepared extracts and the presence of the PRKCB promoter was detected using qPCR. The results are presented as fold enrichment of PRKCB promoter sequences associated with SP1 compared to the IgG immunoprecipitation control (IgG). The data presented represent mean ± SE of n = 3 replicate experiments using cells from the same patient. Statistical anlaysis was performed using a students t-test for paired data.
Figure 4
Figure 4. The PRKCB promoter of CLL cells contains histone marks permissive of gene activation.
Purified normal B cells and CLL cells were analysed by ChIP for H3Ac and H3K4me3 histone mark association with the promoter region of PRKCB upstream of the transcriptional start site. (a) Comparison of H3Ac histone mark association with PRKCB promoter in normal B and CLL cells. (b) Comparison of H3K4me3 histone mark association with PRKCB promoter in normal B and CLL cells. The results are presented as fold enrichment of PRKCB promoter sequences associated with H3Ac or H3K4me3 compared to the IgG immunoprecipitation control, and represent the mean ± SD using cells from different patients. Statistical analysis was performed using a Mann-Whitney U-test.
Figure 5
Figure 5. VEGF stimulates SP1 association with the PRKCB promoter sequence in CLL cells.
5 × 106 CLL cells were used directly (T0) or cultured overnight in the absence (UT) or presence of 100 ng/mL VEGF or 200 nM mithramycin (MIA). (a) ChIP analysis of STAT3 association with the PRKCB promoter in CLL and normal B cells in individual samples. The mean ± SD of these experiments is displayed. Statistical analysis was performed using a Mann-Whitney U-test. (b) ChIP analysis of STAT3 association with the PRKCB promoter in CLL cells incubated overnight ± VEGF. (c) ChIP analysis of SP1 association with the PRKCB promoter using the same CLL samples as in part (b). IgG is the immunoprecipitation control. (d) qRT-PCR analysis of PKCβII mRNA levels in CLL cells measured in comparison to RNApolII. For ChIP analyses PRKCB promoter sequences associated with STAT3/SP1 were detected by qPCR and are presented as fold enrichment compared to the PRKCB promoter sequences associated with the non-specific IgG immunoprecipitation control. In parts (b,c and d) the data presented represent the mean ± SE of n = 3 experiments using CLL cells from different patients. Statistical analysis was performed using a students t-test for paired data.
Figure 6
Figure 6. SP1 is overexpressed in CLL cells, and expression correlates with PRKCB transcription.
(a) SP1 protein expression relative to β-actin was determined in lysates of purified normal B and CLL cells by Western blot analysis. 10 μg of protein was used for each sample, and the ratio of SP1 to β-actin was determined following imaging of chemoluminescence. Statistical analysis was performed using a Mann-Whitney U-test. (b) Graph showing the relationship between SP1 protein expression and PKCβ mRNA levels, determined by qRT-PCR, in purified CLL cells. (c) Graph showing the relationship between SP1 and PKCβ mRNA levels, determined by qRT-PCR, in purified CLL cells. (d) Graph showing relationship between SP1 and PRKCB gene expression in CLL cells taken from publically-available data stored on the Immuno-Navigator database.

References

    1. Watson L., Wyld P. & Catovsky D. Disease burden of chronic lymphocytic leukaemia within the European Union. Eur J Haematol 81, 253–258 (2008). - PubMed
    1. Dighiero G. & Hamblin T. J. Chronic lymphocytic leukaemia. Lancet 371, 1017–1029 (2008). - PubMed
    1. Abrams S. T. et al.. B-cell receptor signaling in chronic lymphocytic leukemia cells is regulated by overexpressed active protein kinase CβII. Blood 109, 1193–1201 (2007). - PubMed
    1. Newton A. C. Protein kinase C: poised to signal. Am J Physiol Endocrinol Metab 298, E395–402 (2010). - PMC - PubMed
    1. Saijo K. et al.. Protein kinase Cβ controls nuclear factor κactivation in B cells through selective regulation of the IκB kinaseas. J. Exp. Med. 195, 1647–1652 (2002). - PMC - PubMed

Publication types

MeSH terms

LinkOut - more resources