. 2017 Jun;11(6):1412-1422.
doi: 10.1038/ismej.2017.4. Epub 2017 Feb 24.

Annual community patterns are driven by seasonal switching between closely related marine bacteria

Affiliations

Annual community patterns are driven by seasonal switching between closely related marine bacteria

Christopher S Ward et al. ISME J. 2017 Jun.

Erratum in

Abstract

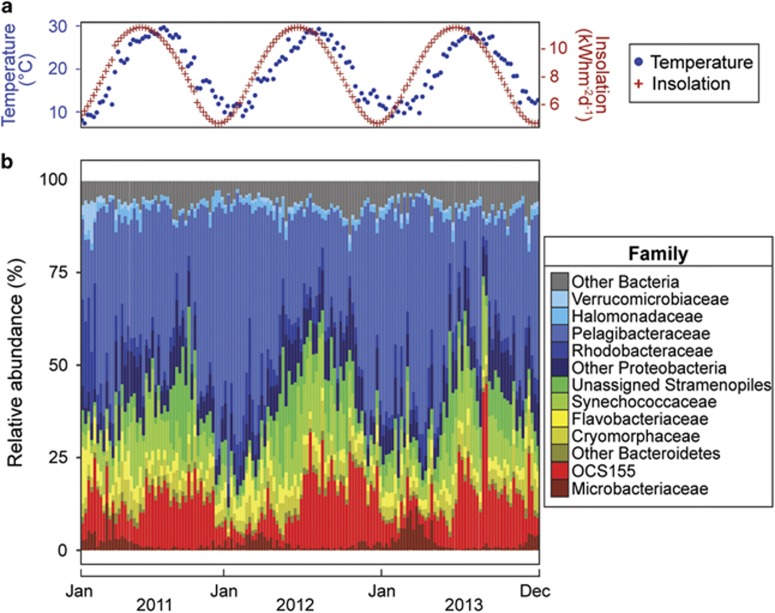
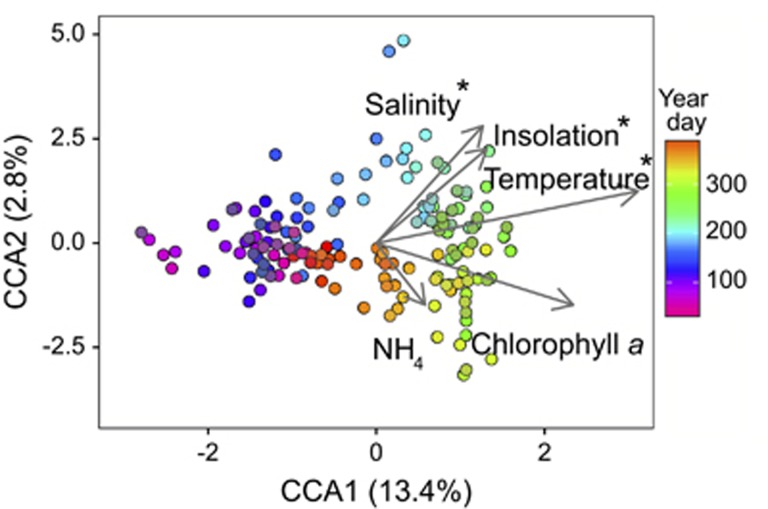
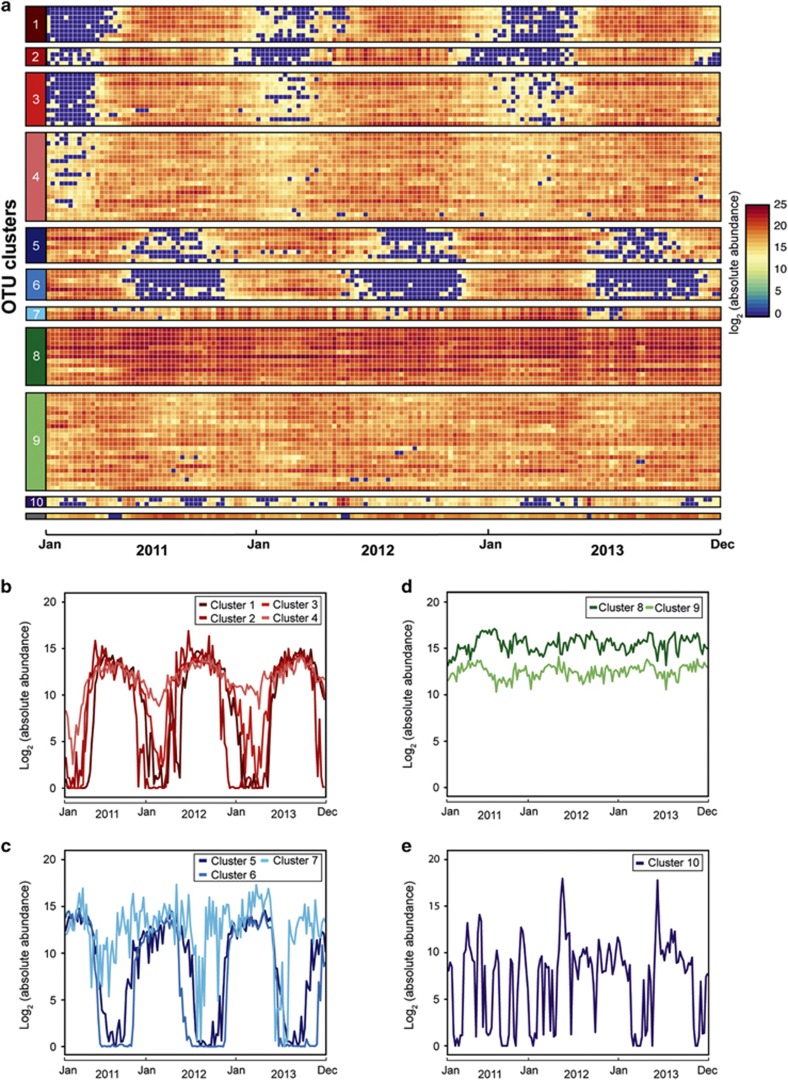
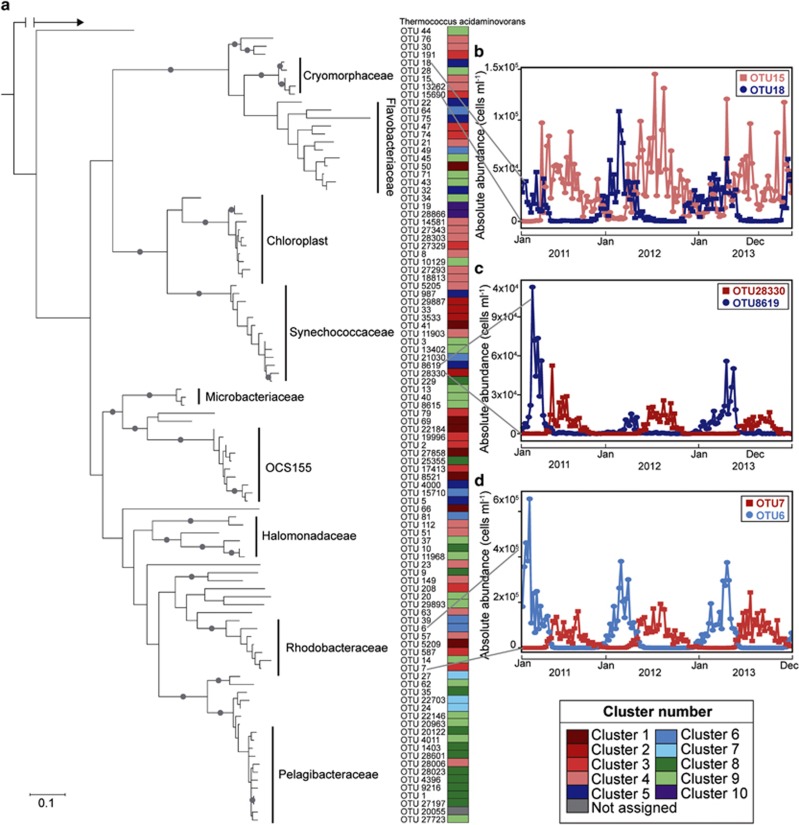
Marine microbes exhibit seasonal cycles in community composition, yet the key drivers of these patterns and microbial population fidelity to specific environmental conditions remain to be determined. To begin addressing these questions, we characterized microbial dynamics weekly for 3 years at a temperate, coastal site with dramatic environmental seasonality. This high-resolution time series reveals that changes in microbial community composition are not continuous; over the duration of the time series, the community instead resolves into distinct summer and winter profiles with rapid spring and fall transitions between these states. Here, we show that these community shifts involve switching between closely related strains that exhibit either summer or winter preferences. Moreover, taxa repeat this process annually in both this and another temperate coastal time series, suggesting that this phenomenon may be widespread in marine ecosystems. To address potential biogeochemical impacts of these community changes, PICRUSt-based metagenomes predict seasonality in transporters, photosynthetic proteins, peptidases and carbohydrate metabolic pathways in spite of closely related summer- and winter-associated taxa. Thus, even small temperature shifts, such as those predicted by climate change models, could affect both the structure and function of marine ecosystems.


Conflict of interest statement

The authors declare no conflict of interest.

Figures

Figure 1
Figure 1
Changes in environmental parameters and the microbial community at the Pivers Island Coastal Observatory (PICO). (a) Plot showing water temperature (°C) and predicted blue-sky isolation (kWh m−2 d−1) for weekly measurements over 3 years (January 2011–December 2013). (b) 16S rRNA gene sequence library composition based on RDP Classifier taxonomic identification of operational taxonomic units (OTUs; 97% sequence similarity). Taxonomy is displayed at the level of family. Families compromising less than 1% of total relative abundance over the entire data set and OTUs that were not identified at the family level are grouped at the phylum level, except for chloroplast sequences that are grouped at the order level. Taxonomic groups comprising an average of less than 1% relative abundance over the entire data set are labeled as ‘Other Bacteria'.
Figure 2
Figure 2
Canonical correspondence analysis (CCA) biplot. CCA relating community composition to environmental variables for each sample from the PICO time series. The percent of variation in the microbial community explained by each axis is indicated in parentheses after the axis label. Environmental variables used in the CCA are represented by vectors, labels used in the figure are indicated by parentheses: water temperature (temperature), projected no-sky daily insolation (insolation), salinity, chlorophyll a and ammonium (NH4). Each circle represents the microbial community composition at a specific time point and the color gradient indicates the year day. Environmental variables marked with asterisks are statistically significant (P<0.001), as assessed by the marginal effects of terms.
Figure 3
Figure 3
Seasonal patterns for the 100 most abundant OTUs over the 3-year PICO time series. (a) The heat map depicts the log2 (absolute abundance; cells ml−1) for each OTU, obtained by taking rRNA operon corrected relative library abundance and total prokaryotic cell counts to calculate a ‘cell count' for each OTU. OTUs are ordered based on patterns observed in soft clustering, shown as numbered boxes on the left side of the figure. The unnumbered gray OTU was not assigned to a cluster. (be) Show the centroids of the 10 soft clusters identified for the 100 most abundant OTUs over the entire PICO time series. Plots show the temporal dynamics of clusters that were visually assigned to (b) summer-associated, (c) winter-associated, (d) ubiquitous and (e) episodic groups.
Figure 4
Figure 4
Seasonal patterns of closely related taxa. (a) Partial 16S rRNA gene maximum-likelihood phylogenetic tree showing the 100 most abundant OTUs from the weekly PICO time series rooted with Thermococcus acidaminovorans. Bootstrap values greater than 80% are indicated by a gray circle at the node. Colored boxes on the right show the assigned clusters (from Figure 3). Larger clades are also labeled with the family assigned by RDP Classifier. (b) Absolute abundances of two OTUs within the genus Phaeocystidibacter (OTUs 15 and 18) in the family Cryomorphaceae over three years of weekly 16S rRNA gene libraries at the PICO time series. (c) Absolute abundances of two OTUs within the genus Synechococcus (OTUs 8619 and 28830). (d) Absolute abundances of two OTUs within the family Rhodobacteraceae, one identified as the dominant OTU within the genus Octadecabacter (OTU 6) and the other a Phaeobacter-like genus (OTU 7).

References

    1. Alonso-Sáez L, Díaz-Pérez L, Morán XAG. (2015). The hidden seasonality of the rare biosphere in coastal marine bacterioplankton. Environ Microbiol 17: 3766–3780. - PubMed
    1. Baltar F, Palovaara J, Vila-Costa M, Salazar G, Calvo E, Pelejero C et al. (2015). Response of rare, common and abundant bacterioplankton to anthropogenic perturbations in a Mediterranean coastal site. FEMS Microbiol Ecol 91: fiv058. - PubMed
    1. Brown JH, Gillooly JF, Allen AP, Savage VM, West GB. (2004). Toward a metabolic theory of ecology. Ecology 85: 1771–1789.
    1. Caporaso JG, Kuczynski J, Stombaugh J, Bittinger K, Bushman FD, Costello EK et al. (2010). QIIME allows analysis of high-throughput community sequencing data. Nat Methods 7: 335–336. - PMC - PubMed
    1. Caporaso JG, Paszkiewicz K, Field D, Knight R, Gilbert JA. (2011). The Western English Channel contains a persistent microbial seed bank. ISME J 6: 1089–1093. - PMC - PubMed