

Toward deterministic and semiautomated SPADE analysis
- PMID: 28234411
- PMCID: PMC5410769
- DOI: 10.1002/cyto.a.23068
Toward deterministic and semiautomated SPADE analysis
Abstract
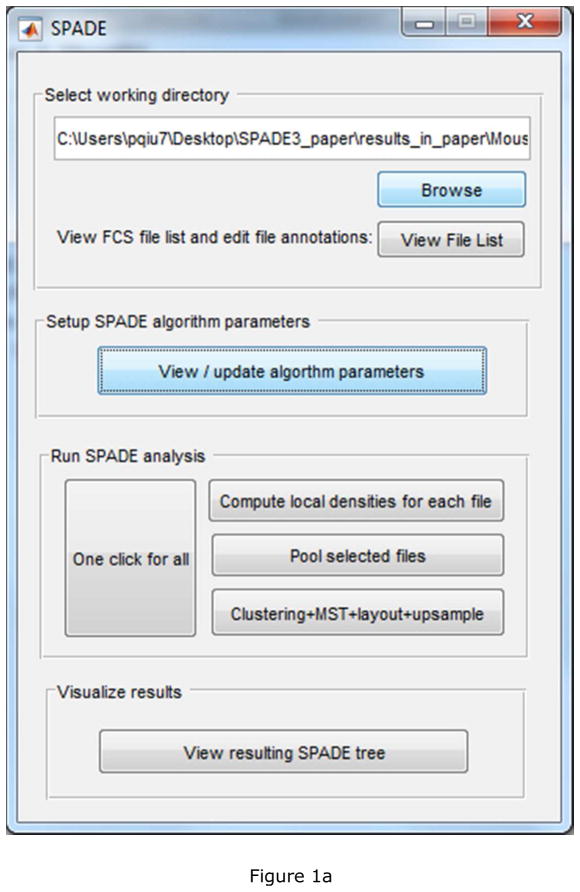
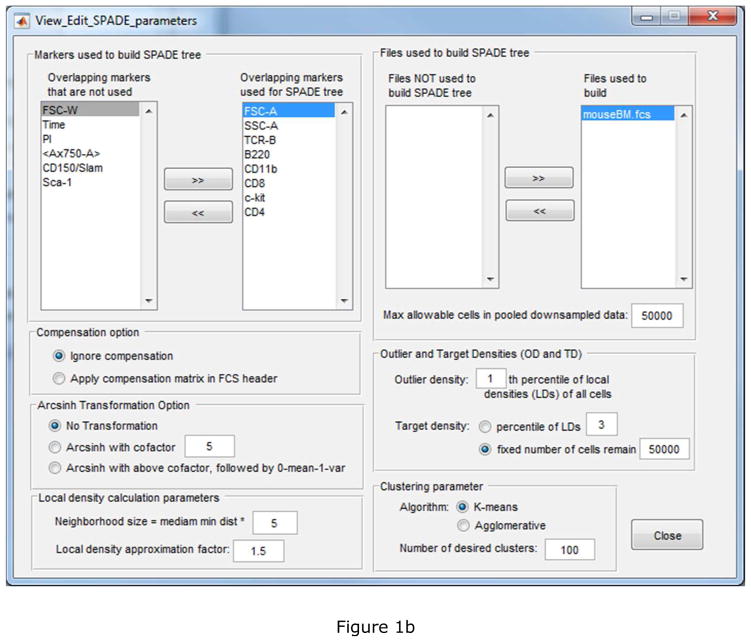
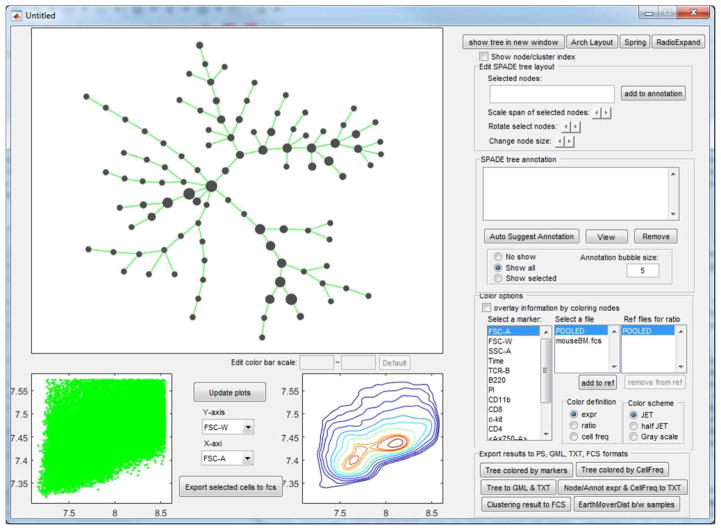
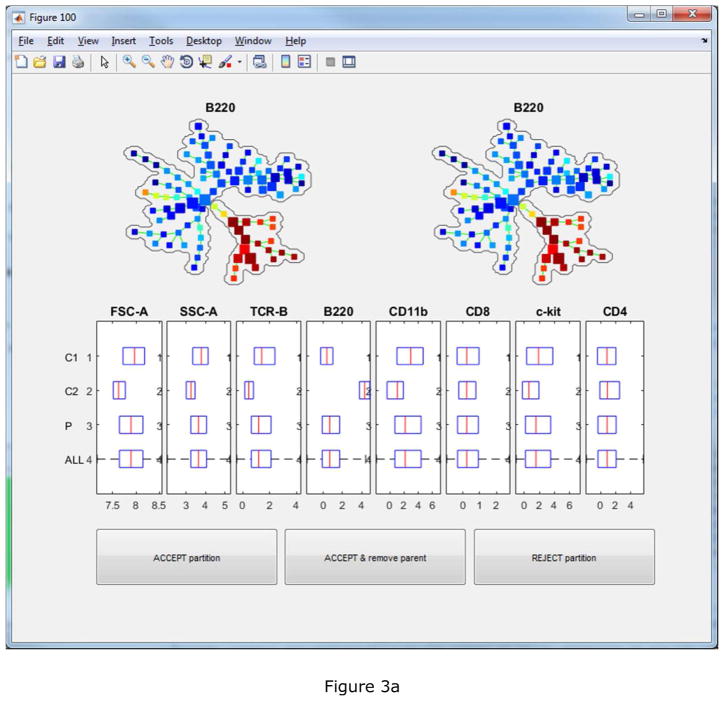
SPADE stands for spanning-tree progression analysis for density-normalized events. It combines downsampling, clustering and a minimum-spanning tree to provide an intuitive visualization of high-dimensional single-cell data, which assists with the interpretation of the cellular heterogeneity underlying the data. SPADE has been widely used for analysis of high-content flow cytometry data and CyTOF data. The downsampling and clustering components of SPADE are both stochastic, which lead to stochasticity in the tree visualization it generates. Running SPADE twice on the same data may generate two different tree structures. Although they typically lead to the same biological interpretation of subpopulations present in the data, robustness of the algorithm can be improved. Another avenue of improvement is the interpretation of the SPADE tree, which involves visual inspection of multiple colored versions of the tree based on expression of measured markers. This is essentially manual gating on the SPADE tree and can benefit from automated algorithms. This article presents improvements of SPADE in both aspects above, leading to a deterministic SPADE algorithm and a software implementation for semiautomated interpretation. © 2017 International Society for Advancement of Cytometry.
Keywords: SPADE; deterministic.
© 2017 International Society for Advancement of Cytometry.
Figures
Similar articles
-
Automatically generate two-dimensional gating hierarchy from clustered cytometry data.Cytometry A. 2018 Oct;93(10):1039-1050. doi: 10.1002/cyto.a.23577. Epub 2018 Sep 3. Cytometry A. 2018. PMID: 30176185
-
Visualization and cellular hierarchy inference of single-cell data using SPADE.Nat Protoc. 2016 Jul;11(7):1264-79. doi: 10.1038/nprot.2016.066. Epub 2016 Jun 16. Nat Protoc. 2016. PMID: 27310265
-
SPADEVizR: an R package for visualization, analysis and integration of SPADE results.Bioinformatics. 2017 Mar 1;33(5):779-781. doi: 10.1093/bioinformatics/btw708. Bioinformatics. 2017. PMID: 27993789 Free PMC article.
-
The end of gating? An introduction to automated analysis of high dimensional cytometry data.Eur J Immunol. 2016 Jan;46(1):34-43. doi: 10.1002/eji.201545774. Epub 2015 Nov 30. Eur J Immunol. 2016. PMID: 26548301 Review.
-
Current trends in flow cytometry automated data analysis software.Cytometry A. 2021 Oct;99(10):1007-1021. doi: 10.1002/cyto.a.24320. Epub 2021 Feb 19. Cytometry A. 2021. PMID: 33606354 Review.
Cited by
-
Immune Cell Profiling During Switching from Natalizumab to Fingolimod Reveals Differential Effects on Systemic Immune-Regulatory Networks and on Trafficking of Non-T Cell Populations into the Cerebrospinal Fluid-Results from the ToFingo Successor Study.Front Immunol. 2018 Jul 9;9:1560. doi: 10.3389/fimmu.2018.01560. eCollection 2018. Front Immunol. 2018. PMID: 30050529 Free PMC article.
-
Comparison of CyTOF assays across sites: Results of a six-center pilot study.J Immunol Methods. 2018 Feb;453:37-43. doi: 10.1016/j.jim.2017.11.008. Epub 2017 Nov 23. J Immunol Methods. 2018. PMID: 29174717 Free PMC article.
-
Dual delivery of IL-10 and AT-RvD1 from PEG hydrogels polarize immune cells towards pro-regenerative phenotypes.Biomaterials. 2021 Jan;268:120475. doi: 10.1016/j.biomaterials.2020.120475. Epub 2020 Nov 28. Biomaterials. 2021. PMID: 33321293 Free PMC article.
-
Single-cell technologies in reproductive immunology.Am J Reprod Immunol. 2019 Sep;82(3):e13157. doi: 10.1111/aji.13157. Epub 2019 Jun 26. Am J Reprod Immunol. 2019. PMID: 31206899 Free PMC article. Review.
-
Mass Cytometry Defines Virus-Specific CD4+ T Cells in Influenza Vaccination.Immunohorizons. 2020 Dec 11;4(12):774-788. doi: 10.4049/immunohorizons.1900097. Immunohorizons. 2020. PMID: 33310880 Free PMC article.
References
-
- Perfetto SP, Chattopadhyay PK, Roederer M. Seventeen-colour flow cytometry: unravelling the immune system. Nat Rev Immunol. 2004;4:648–655. - PubMed
-
- Singh S, Clarke I, Terasaki M, Bonn V, Hawkins C, et al. Identification of a cancer stem cell in human brain tumors. Cancer Res. 2003;63:5821–8. - PubMed
Publication types
MeSH terms
Grants and funding
LinkOut - more resources
Full Text Sources
Other Literature Sources
