

Imputation for transcription factor binding predictions based on deep learning
- PMID: 28234893
- PMCID: PMC5345877
- DOI: 10.1371/journal.pcbi.1005403
Imputation for transcription factor binding predictions based on deep learning
Abstract
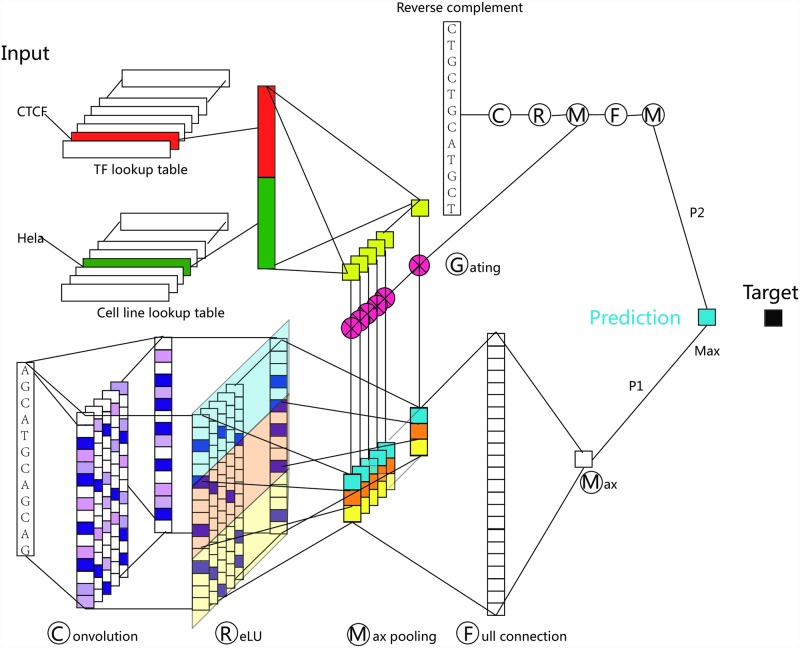
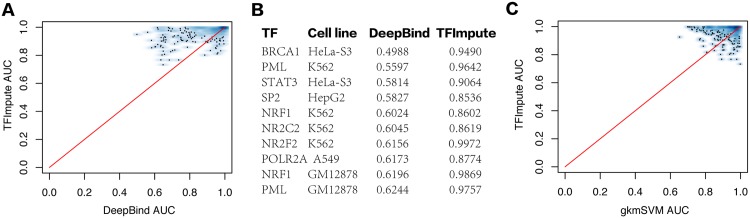
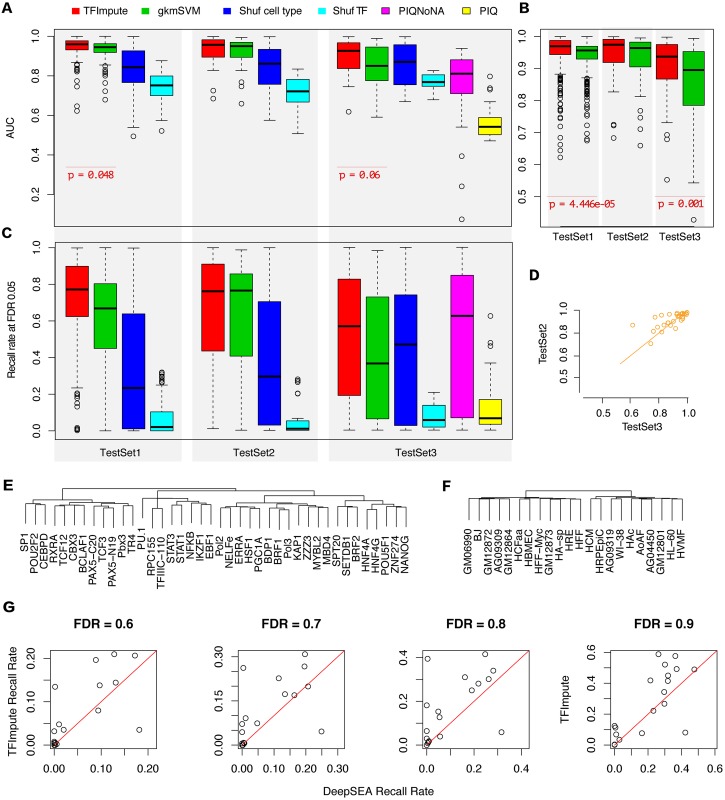
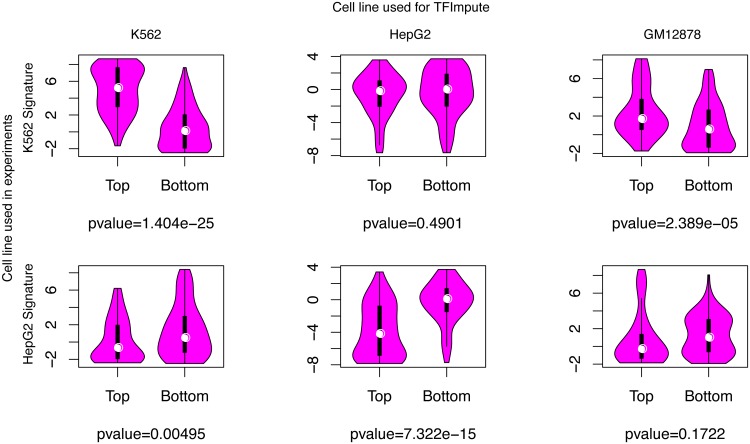
Understanding the cell-specific binding patterns of transcription factors (TFs) is fundamental to studying gene regulatory networks in biological systems, for which ChIP-seq not only provides valuable data but is also considered as the gold standard. Despite tremendous efforts from the scientific community to conduct TF ChIP-seq experiments, the available data represent only a limited percentage of ChIP-seq experiments, considering all possible combinations of TFs and cell lines. In this study, we demonstrate a method for accurately predicting cell-specific TF binding for TF-cell line combinations based on only a small fraction (4%) of the combinations using available ChIP-seq data. The proposed model, termed TFImpute, is based on a deep neural network with a multi-task learning setting to borrow information across transcription factors and cell lines. Compared with existing methods, TFImpute achieves comparable accuracy on TF-cell line combinations with ChIP-seq data; moreover, TFImpute achieves better accuracy on TF-cell line combinations without ChIP-seq data. This approach can predict cell line specific enhancer activities in K562 and HepG2 cell lines, as measured by massively parallel reporter assays, and predicts the impact of SNPs on TF binding.
Conflict of interest statement
The authors have declared that no competing interests exist.
Figures
Similar articles
-
BinDNase: a discriminatory approach for transcription factor binding prediction using DNase I hypersensitivity data.Bioinformatics. 2015 Sep 1;31(17):2852-9. doi: 10.1093/bioinformatics/btv294. Epub 2015 May 7. Bioinformatics. 2015. PMID: 25957350
-
TICA: Transcriptional Interaction and Coregulation Analyzer.Genomics Proteomics Bioinformatics. 2018 Oct;16(5):342-353. doi: 10.1016/j.gpb.2018.05.004. Epub 2018 Dec 19. Genomics Proteomics Bioinformatics. 2018. PMID: 30578913 Free PMC article.
-
MixChIP: a probabilistic method for cell type specific protein-DNA binding analysis.BMC Bioinformatics. 2015 Dec 24;16:413. doi: 10.1186/s12859-015-0834-3. BMC Bioinformatics. 2015. PMID: 26703974 Free PMC article.
-
ChIP-Seq Data Analysis to Define Transcriptional Regulatory Networks.Adv Biochem Eng Biotechnol. 2017;160:1-14. doi: 10.1007/10_2016_43. Adv Biochem Eng Biotechnol. 2017. PMID: 28070596 Review.
-
On the problem of confounders in modeling gene expression.Bioinformatics. 2019 Feb 15;35(4):711-719. doi: 10.1093/bioinformatics/bty674. Bioinformatics. 2019. PMID: 30084962 Free PMC article. Review.
Cited by
-
Opportunities and obstacles for deep learning in biology and medicine.J R Soc Interface. 2018 Apr;15(141):20170387. doi: 10.1098/rsif.2017.0387. J R Soc Interface. 2018. PMID: 29618526 Free PMC article. Review.
-
DeepARG: a deep learning approach for predicting antibiotic resistance genes from metagenomic data.Microbiome. 2018 Feb 1;6(1):23. doi: 10.1186/s40168-018-0401-z. Microbiome. 2018. PMID: 29391044 Free PMC article.
-
Landscape of transcriptional deregulation in lung cancer.BMC Genomics. 2018 Jun 5;19(1):435. doi: 10.1186/s12864-018-4828-1. BMC Genomics. 2018. PMID: 29866045 Free PMC article.
-
Deep Learning for Genomics: From Early Neural Nets to Modern Large Language Models.Int J Mol Sci. 2023 Nov 1;24(21):15858. doi: 10.3390/ijms242115858. Int J Mol Sci. 2023. PMID: 37958843 Free PMC article. Review.
-
DeepD2V: A Novel Deep Learning-Based Framework for Predicting Transcription Factor Binding Sites from Combined DNA Sequence.Int J Mol Sci. 2021 May 24;22(11):5521. doi: 10.3390/ijms22115521. Int J Mol Sci. 2021. PMID: 34073774 Free PMC article.
References
MeSH terms
Substances
LinkOut - more resources
Full Text Sources
Other Literature Sources
Miscellaneous
