. 2017 Feb 24;12(2):e0172073.
doi: 10.1371/journal.pone.0172073. eCollection 2017.

The role of the interaction network in the emergence of diversity of behavior

Affiliations

The role of the interaction network in the emergence of diversity of behavior

Alan Godoy et al. PLoS One. .

Abstract

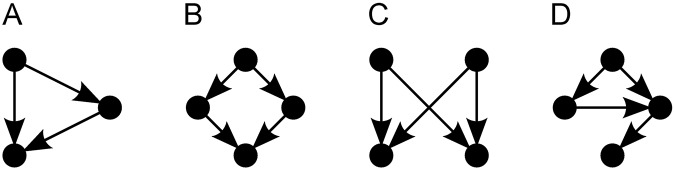
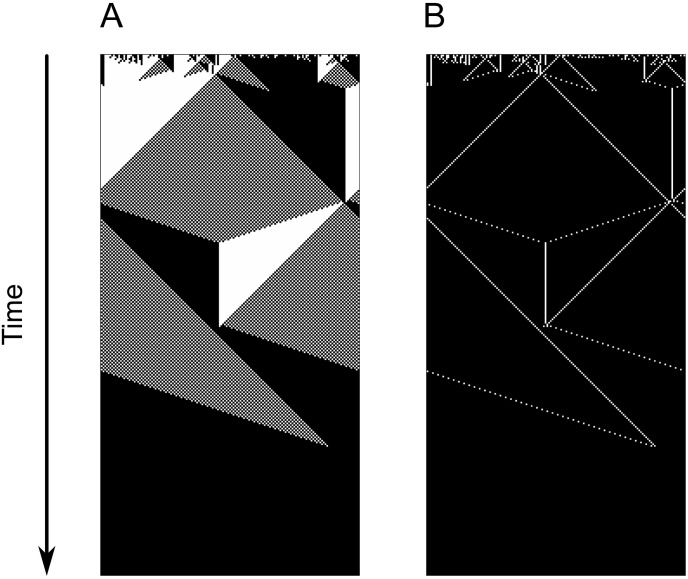
How can systems in which individuals' inner workings are very similar to each other, as neural networks or ant colonies, produce so many qualitatively different behaviors, giving rise to roles and specialization? In this work, we bring new perspectives to this question by focusing on the underlying network that defines how individuals in these systems interact. We applied a genetic algorithm to optimize rules and connections of cellular automata in order to solve the density classification task, a classical problem used to study emergent behaviors in decentralized computational systems. The networks used were all generated by the introduction of shortcuts in an originally regular topology, following the small-world model. Even though all cells follow the exact same rules, we observed the existence of different classes of cells' behaviors in the best cellular automata found-most cells were responsible for memory and others for integration of information. Through the analysis of structural measures and patterns of connections (motifs) in successful cellular automata, we observed that the distribution of shortcuts between distant regions and the speed in which a cell can gather information from different parts of the system seem to be the main factors for the specialization we observed, demonstrating how heterogeneity in a network can create heterogeneity of behavior.


Conflict of interest statement

Competing Interests: The authors have declared that no competing interests exist.

Figures

Fig 1
Fig 1. Motifs found in the neural network of the worm C. elegans.
Motifs names: (A) Feed-forward loop, (B) Bi-fan and (C) Bi-parallel; motif (D) has no common alias. After Milo et al. [23].
Fig 2
Fig 2. How elementary cellular automata work.
Notice that all cells follow the same set of rules. The state of each cell is black (0) or white (1). The cellular automaton is uniform in the sense that all cells follow the same rule table to update their states.
Fig 3
Fig 3. Space-time diagram of an ECA composed of 20 cells, each following the rule 110.
See subsection “Searching good CAs” for an explanation on rule numbering. The initial state is exhibited at the top row. Cells 1 and 20 are neighbors.
Fig 4
Fig 4. Graphs generated using the small-world model with different rewiring probabilities p.
(A) p = 0.00, (B) p = 0.15 and (C) p = 1.00.
Fig 5
Fig 5. Relative average path length and clustering coefficient in networks generated with the small-world model, according to the rewiring probability p.
Fig 6
Fig 6. Space-time diagram of executions of the best cellular automaton found with p = 0.01 rewired connections, for three different initial configurations.
In (A), (B) and (C), limits and flow directions are indicated, respectively, by the vertical lines and diagonal arrows. In (D), darker colors indicate that a cell acted more frequently as a limit.
Fig 7
Fig 7. Space-time diagram for an execution of the GKL rule [35] (with regular ring topology) and particles observed during such execution.
Fig 8
Fig 8. Evolution of fitness during the searches with different rewiring probabilities p.
The plots indicate, for each epoch, the best and the median fitness of the population, calculated with initial configurations with densities evenly distributed in the range ρ0 ∈ (0, 1). We also show the results achieved by the best individuals in each epoch when initial configurations are sampled with density ρ0 ≈ 0.5.
Fig 9
Fig 9. Space-time diagram of executions of the best cellular automaton found at each execution.
Above each space-time diagram is depicted a bar graph indicating how often each cell acted as a limit. To improve visualization the bar graphs were scaled so the maximum height is equal across all CAs, so that bar heights should be compared solely within each graph. (A) p = 0.00, (B) p = 0.01, (C) p = 0.02, (D) p = 0.03, (E) p = 0.04, (F) p = 0.05, (G) p = 0.06, (H) p = 0.07, (I) p = 0.08, (J) p = 0.09 and (K) p = 0.10.
Fig 10
Fig 10. Evolution of the Gini coefficient.
Evolution of median inequality of frequencies that cells in each CA acted as limits during the search with different rewiring probabilities p.
Fig 11
Fig 11. Evolution of the ratio between the maximum and minimum frequencies a cell acted as a limit.
Evolution of median ratio between the maximum and minimum frequencies that cells in each CA acted as limits during the search with different rewiring probabilities p.
Fig 12
Fig 12. Distribution of spearman’s rank correlation, calculated for each CA, between the frequency a cell acts as a limit and the cell’s structural metrics.
The black vertical line indicates median value and the red vertical lines indicate, respectively, the 10th and the 90th percentiles (N = 51000).
Fig 13
Fig 13. Motifs identified in the best topologies found in each search.
Nreal is the average count of the respective subgraph in each network. Nrandom is the average number of occurrences of such subgraph in similar networks, but with random rewires.

References

    1. Orwell G. Animal Farm: a fairy story. Secker & Warburg; 1945.
    1. Seung S. Connectome: How the brain’s wiring makes us who we are. A Mariner Book. Houghton Mifflin Harcourt; 2012.
    1. Preston SD, de Waal FBM. Empathy: Its ultimate and proximate bases. Behavioral and Brain Sciences. 2002;25:1–20. - PubMed
    1. Quiroga RQ, Reddy L, Kreiman G, Koch C, Fried I. Invariant visual representation by single neurons in the human brain. Nature. 2005;435(7045):1102–1107. 10.1038/nature03687 - DOI - PubMed
    1. Page SE. The difference: How the power of diversity creates better groups, firms, schools, and societies. Princeton University Press; 2007.

LinkOut - more resources