

Plasma nevirapine concentrations predict virological and adherence failure in Kenyan HIV-1 infected patients with extensive antiretroviral treatment exposure
- PMID: 28235021
- PMCID: PMC5325546
- DOI: 10.1371/journal.pone.0172960
Plasma nevirapine concentrations predict virological and adherence failure in Kenyan HIV-1 infected patients with extensive antiretroviral treatment exposure
Abstract
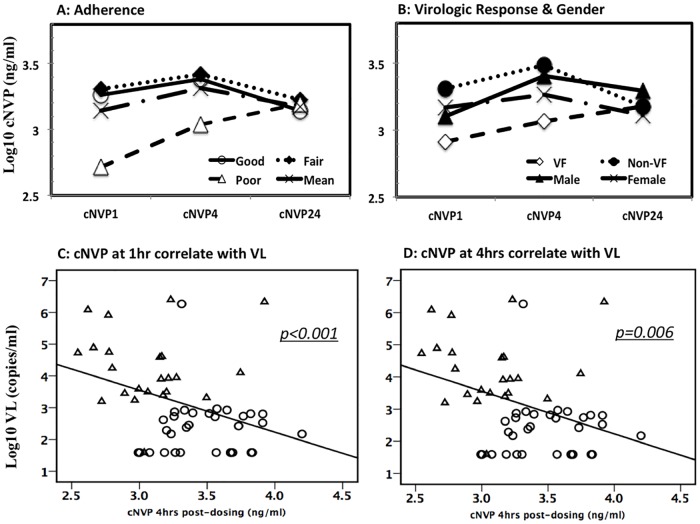
Treatment failure is a key challenge in the management of HIV-1 infection. We conducted a mixed-model survey of plasma nevirapine (NVP) concentrations (cNVP) and viral load in order to examine associations with treatment and adherence outcomes among Kenyan patients on prolonged antiretroviral therapy (ART). Blood plasma was collected at 1, 4 and 24 hours post-ART dosing from 58 subjects receiving NVP-containing ART and used to determine cNVP and viral load (VL). Median duration of treatment was 42 (range, 12-156) months, and 25 (43.1%) of the patients had virologic failure (VF). cNVP was significantly lower for VF than non- VF at 1hr (mean, 2,111ng/ml vs. 3,432ng/ml, p = 0.003) and at 4hr (mean 1,625ng/ml vs. 3,999ng/ml, p = 0.001) but not at 24hr post-ART dosing. Up to 53.4%, 24.1% and 22.4% of the subjects had good, fair and poor adherence respectively. cNVP levels peaked and were > = 3μg.ml at 4 hours in a majority of patients with good adherence and those without VF. Using a threshold of 3μg/ml for optimal therapeutic nevirapine level, 74% (43/58), 65.5% (38/58) and 86% (50/58) of all patients had sub-therapeutic cNVP at 1, 4 and 24 hours respectively. cNVP at 4 hours was associated with adherence (p = 0.05) and virologic VF (p = 0.002) in a chi-square test. These mean cNVP levels differed significantly in non-parametric tests between adherence categories at 1hr (p = 0.005) and 4hrs (p = 0.01) and between ART regimen categories at 1hr (p = 0.004) and 4hrs (p<0.0001). Moreover, cNVP levels correlated inversely with VL (p< = 0.006) and positively with adherence behavior. In multivariate tests, increased early peak NVP (cNVP4) was independently predictive of lower VL (p = 0.002), while delayed high NVP peak (cNVP24) was consistent with increased VL (p = 0.033). These data strongly assert the need to integrate plasma concentrations of NVP and that of other ART drugs into routine ART management of HIV-1 patients.
Conflict of interest statement
Figures
References
-
- NASCOP. Guidelines on Use of Antiretroviral Drugs for Treating and Preventing HIV Infection in Kenya. In: Ministry of Health GoK, editor. 2016.
-
- NASCOP. National AIDS and STI Control Programme (NASCOP). Guidelines for antiretroviral therapy in Kenya, 4th edition Nairobi, Kenya: Print2011.
-
- Parienti J-J, Massari Véronique, Descamps Diane, Vabret Astrid, Bouvet Elisabeth, Larouzé Bernard, and Verdon Renaud. Predictors of virologic failure and resistance in HIV-infected patients treated with nevirapine-or efavirenz-based antiretroviral therapy. Clinical Infectious Diseases. 2004;38(9):1311–6. 10.1086/383572 - DOI - PubMed
-
- de Vries-Sluijs TE, Dieleman Jeanne P., Arts Dennis, Huitema Alwin DR, Beijnen Jos H., Schutten Martin, and van der Ende Marchina E.. Low nevirapine plasma concentrations predict virological failure in an unselected HIV-1-infected population. Clinical pharmacokinetics. 2003;42(6):599–605. 10.2165/00003088-200342060-00009 - DOI - PubMed
Publication types
MeSH terms
Substances
LinkOut - more resources
Full Text Sources
Other Literature Sources
Medical
