. 2017 Feb 24;13(2):e1006235.
doi: 10.1371/journal.ppat.1006235. eCollection 2017 Feb.

Extra-epitopic hepatitis C virus polymorphisms confer resistance to broadly neutralizing antibodies by modulating binding to scavenger receptor B1

Affiliations

Extra-epitopic hepatitis C virus polymorphisms confer resistance to broadly neutralizing antibodies by modulating binding to scavenger receptor B1

Ramy El-Diwany et al. PLoS Pathog. .

Abstract

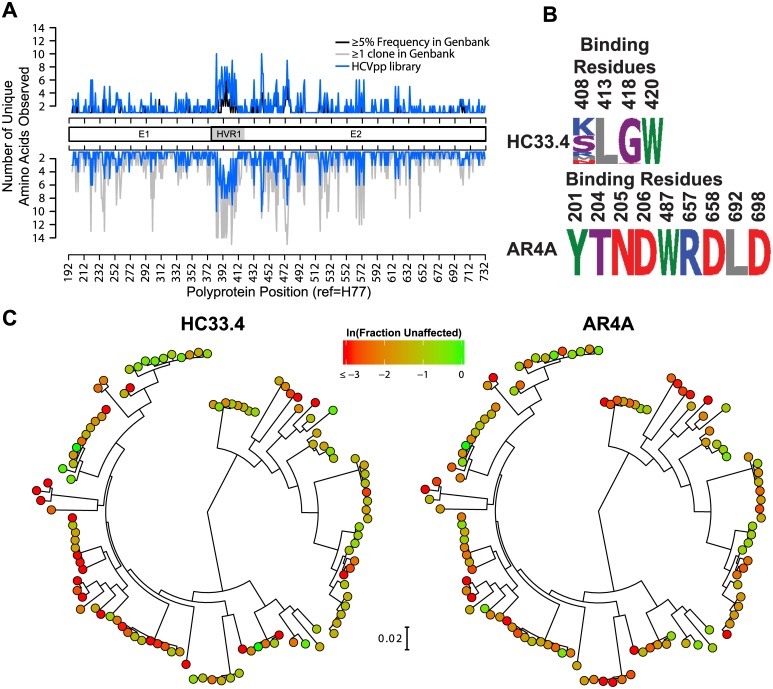
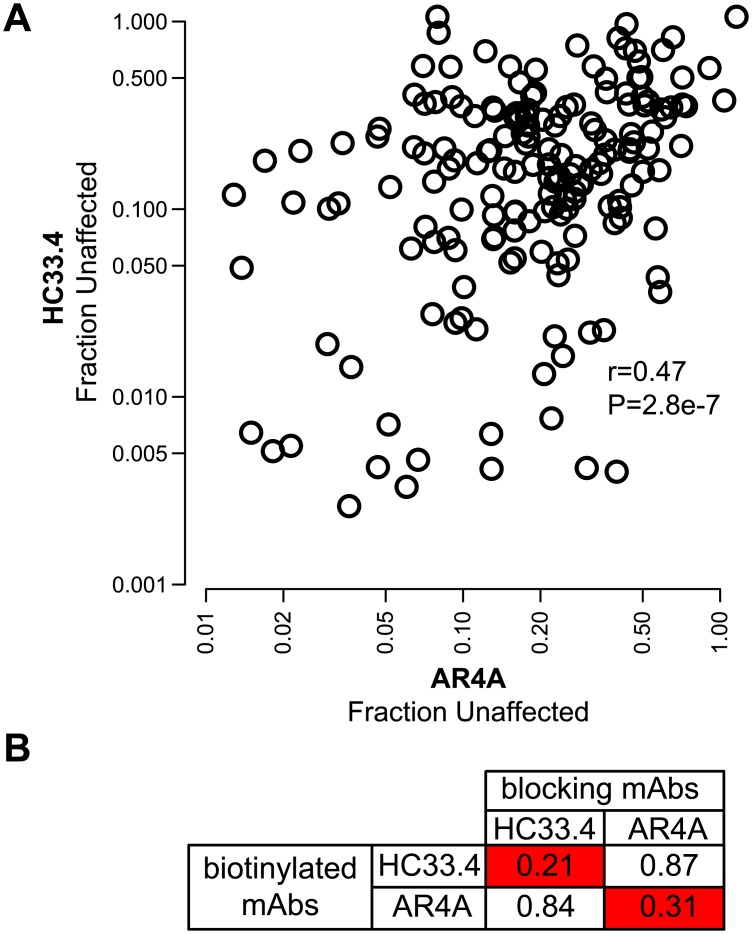
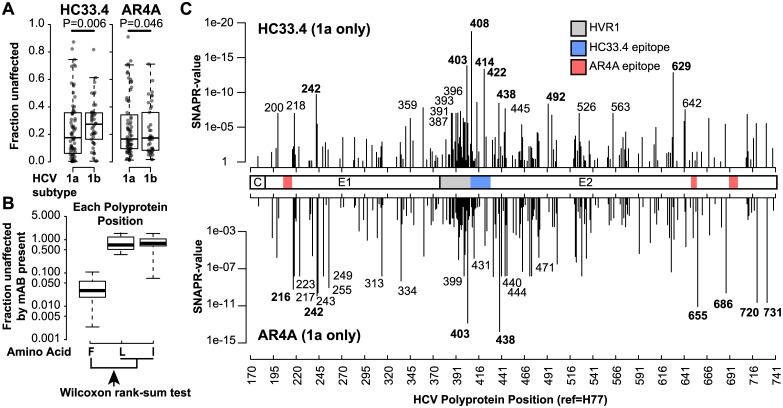
Broadly-neutralizing monoclonal antibodies (bNAbs) may guide vaccine development for highly variable viruses including hepatitis C virus (HCV), since they target conserved viral epitopes that could serve as vaccine antigens. However, HCV resistance to bNAbs could reduce the efficacy of a vaccine. HC33.4 and AR4A are two of the most potent anti-HCV human bNAbs characterized to date, binding to highly conserved epitopes near the amino- and carboxy-terminus of HCV envelope (E2) protein, respectively. Given their distinct epitopes, it was surprising that these bNAbs showed similar neutralization profiles across a panel of natural HCV isolates, suggesting that some viral polymorphisms may confer resistance to both bNAbs. To investigate this resistance, we developed a large, diverse panel of natural HCV envelope variants and a novel computational method to identify bNAb resistance polymorphisms in envelope proteins (E1 and E2). By measuring neutralization of a panel of HCV pseudoparticles by 10 μg/mL of each bNAb, we identified E1E2 variants with resistance to one or both bNAbs, despite 100% conservation of the AR4A binding epitope across the panel. We discovered polymorphisms outside of either binding epitope that modulate resistance to both bNAbs by altering E2 binding to the HCV co-receptor, scavenger receptor B1 (SR-B1). This study is focused on a mode of neutralization escape not addressed by conventional analysis of epitope conservation, highlighting the contribution of extra-epitopic polymorphisms to bNAb resistance and presenting a novel mechanism by which HCV might persist even in the face of an antibody response targeting multiple conserved epitopes.


Conflict of interest statement

The authors have declared that no competing interests exist.

Figures

Fig 1
Fig 1. Construction of an HCV E1E2 panel for neutralizing antibody breadth testing and sequence prediction of neutralizing antibody resistance polymorphisms.
(A) Number of different amino acids present at each position in the 113 variant E1E2 panel (blue line). Regions spanning E1, hypervariable region 1 (HVR1), and E2 are indicated. For comparison, black line in the upper plot shows the number amino acids represented at each position by at least 5% of the sequences in a reference panel of 643 HCV genotype 1 isolates from GenBank. Gray line in the lower plot shows the number amino acids represented at each position by at least one sequence in the reference panel of 634 HCV genotype 1 isolates from GenBank. (B) Variation in the E1E2 panel of known critical binding residues for HC33.4 and AR4A. Numbers indicate the polyprotein position of each amino acid. Height of each amino acid is proportional to its frequency in the panel. Letters are standard IUPAC amino acid abbreviations. (C) Phylogenetic tree of E1E2 amino acid sequences of the 113 variant panel, determined by maximum likelihood, shown with the distances drawn to scale. Clones are colored according to their sensitivity to neutralization: ln(Fraction Unaffected (Fu) by 10 μg/mL of HC33.4 (left) and AR4A (right)). Fu is infection in the presence of 10 μg/mL of bNAb/infection in the presence of nonspecific human IgG.
Fig 2
Fig 2. Relative resistance of diverse HCVpp to neutralization by HC33.4 and AR4A shows a significant positive correlation, which is not the result of shared binding sites.
(A) Each point indicates mean fraction unaffected (Fu) of a single HCvpp by 10 μg/mL of HC33.4 on the x-axis and AR4A on the y-axis, measured in duplicate. Fu is infection in the presence of 10 μg/mL of bNAb/infection in the presence of nonspecific human IgG. R- and p-values determined by Spearman correlation. (B) HC33.4 and AR4A do not compete for binding to E1E2. Values represent binding of biotinylated bNAbs to 1a154 (H77) E1E2 in an ELISA in the presence of the indicated blocking antibody relative to binding in the absence of blocking antibody. Combinations showing >50% reduction in binding of the biotinylated bNAb are marked in red.
Fig 3
Fig 3. Subject-adjusted Neutralizing Antibody Prediction of Resistance-polymorphisms (SNAPR): Prediction of polymorphisms mediating neutralization resistance.
(A) Differences in HC33.4 and AR4A neutralization of HCVpp by subtype. Each data point indicates the mean Fu of an individual HCVpp, measured in duplicate. Boxes are interquartile range, and horizontal lines are medians. P-values calculated by Wilcoxon rank sum test. (B) Illustration of the SNAPR method: At each E1E2 alignment position, isolates were divided into groups according to amino acid present. Fraction unaffected (Fu, infection in the presence of bNAb/infection in the presence of nonspecific IgG) values of HCVpp from the most sensitive group (as determine by the medians) was compared to the Fu of HCVpp with any other amino acid at that position by Wilcoxon rank-sum test to generate SNAPR-values. (C) SNAPR-values across E1E2 determined using only subtype 1a HCVpp neutralized by HC33.4 or AR4A. The 8 positions with lowest SNAPR-values for HC33.4 and AR4A are in bold print. Previously defined HC33.4 and AR4A binding epitopes are indicated (blue and pink), as is hypervariable region 1 (HVR1) (gray).
Fig 4
Fig 4. Comparison of Fu of HCVpp segregated by the amino acid present at positions predicted by SNAPR to influence bNAb resistance.
Boxplots showing the Fu values for all isolates grouped by amino acid present at the indicated position in the presence of HC33.4 (A) and AR4A (B) in order of their polyprotein position. Each data point indicates the mean Fu of an individual HCVpp, measured in duplicate. Boxes are interquartile range, and horizontal lines are medians. The eight positions with lowest SNAPR-values for each bNAb are shown. The letters shown are standard IUPAC amino acid abbreviations. Fu of HCVpp with the indicated polymorphisms were compared by Wilcoxon rank-sum test. (*, p<0.05).
Fig 5
Fig 5. Site-directed mutagenesis confirms multiple SNAPR-predicted resistance polymorphisms.
Putative resistance polymorphisms were introduced by site-directed mutagenesis into multiple distinct wild type (WT) E1E2 variants in which they were not naturally present. These WT variants were each from subtype 1a and differed from each other prior to mutagenesis by an average of 42 amino acids (7%). WT and mutated E1E2 variants were used to produce HCVpp, which were tested for neutralization by 10 μg/mL of HC33.4 (A) or AR4A (B). Fraction unaffected is the infection in the presence of 10 μg/mL of neutralizing antibody/infection in the presence of nonspecific IgG. Each mutation was introduced into 2–3 distinct E1E2 variants and neutralization effect of each mutation was tested in at least 4 independent experiments performed in duplicate. Each line indicates an independent experiment comparing a WT HCVpp to the corresponding mutant version, and different colors indicate different E1E2 variants. WT HCVpp and corresponding mutant HCVpp neutralization were compared by paired, two-sided T test. (ns, not significant; *, p<0.05; **, p<0.005).
Fig 6
Fig 6. Reversion of naturally-existing resistance polymorphisms confirms their phenotype.
Putative resistance polymorphisms that were already validated by introduction into neutralization sensitive E1E2 variants were reverted in other E1E2 variants where they were already naturally present. Wild type (WT) and mutated E1E2 variants were used to produce HCVpp, which were tested for neutralization by 10 μg/mL of HC33.4 (A) or AR4A (B). Fraction unaffected is the infection in the presence of 10 μg/mL of neutralizing antibody/infection in the presence of nonspecific IgG. Each mutation was introduced into 2–5 distinct E1E2 variants, except T686S, which could be introduced into only one E1E2 variant, and neutralization effect of each mutation was tested in at least 4 independent experiments performed in duplicate. Each line indicates an independent experiment comparing a WT HCVpp to the corresponding mutant version, and different colors indicate different E1E2 variants. Wild type (WT) and corresponding mutant HCVpp neutralization were compared by paired, two-sided T test. (ns, not significant; *, p<0.05; **, p<0.005).
Fig 7
Fig 7. L403F and L438V confer similar-magnitude changes in HCVpp and HCVcc neutralization sensitivity to HC33.4 and AR4A, but no changes in bNAb binding.
(A) L403F confers neutralization resistance and L438V confers increased neutralization sensitivity to both HC33.4 and AR4A. The indicated mutations were introduced into E1E2 variant 1a154 (H77), and HCVpp were generated. Neutralization of wild type and mutant HCVpp by serial dilutions of HC33.4 or AR4A was measured. Each point is the mean of two replicate values, and error bars indicate standard deviations. 50% inhibitory concentration (IC50) of each bNAb/HCVpp combination and fold change in IC50 relative to 1a154_L438V are indicated. (B) Neutralization of replication competent cell culture virus (HCVcc) generated with wild type 1a154 (H77) or mutant E1E2. Each point is the mean of triplicate values, and error bars indicate standard deviations. 50% inhibitory concentration (IC50) of each bNAb/HCVcc combination and fold change in IC50 relative to 1a154_L438V are indicated. (C) L403F and L438V do not change binding of HC33.4 or AR4A to E1E2 protein. Binding to wild type and mutant E1E2 protein by serial dilutions of HC33.4 or AR4A was measured in an ELISA. Each point is the mean binding measured in two independent experiments performed in duplicate, with error bars indicating standard deviations between experiments, except binding at the lowest 7 bNAb concentrations, which was tested in only one experiment. BNAb concentration resulting in half-maximal binding (EC50) of each bNAb/E1E2 combination and fold change in EC50 relative to 1a154_L438V are indicated.
Fig 8
Fig 8. L403F and L438V modulate bNAb resistance by altering binding to SR-B1.
(A) Binding of serial dilutions of strain 1a154 (H77) soluble E2 (sE2) to CHO cells expressing human CD81 (blue peaks) or to wild type CHO cells that do not express HCV receptors (pink peaks), measured by flow cytometry. (B) Binding of serial dilutions of 1a154, 1a154_L403F, or 1a154_L438V sE2 to SR-B1-CHO cells or CD81-CHO cells. Each point was calculated from 10e4 events. Background binding to wild type CHO cells was subtracted from mean fluorescence intensity (MFI) values. sE2 supernatants were normalized for relative sE2 concentration (shown in S3 Fig) prior to dilution. One experiment that is representative of two independent experiments is shown. The second experiment is shown in S4 Fig. (C) Percent inhibition of sE2 binding to SR-B1 or CD81 by HC33.4. MFI of binding of a fixed, equivalent concentration of 1a154 or 1a154_L403F sE2 to SR-B1-CHO or CD81-CHO cells in the presence of serial dilutions of mAb HC33.4 or nonspecific human IgG was used to calculate percent inhibition of binding. Each point was calculated from 10e4 events. Background binding to wild type CHO cells was subtracted from mean fluorescence intensity (MFI) values. IC50 was calculated by nonlinear regression. (D) Binding of equivalent concentrations of sE2 to SR-B1-CHO cells in the presence of serial dilutions of HC33.4. Each point was calculated from 10e4 events. Background binding to wild type CHO cells was subtracted from mean fluorescence intensity (MFI) values. Binding after incubation of each sE2 with 100 μg/mL of nonspecific IgG is shown for reference. (E) Binding of serial dilutions of 1a154, 1a154_L403F, or 1a154_L438V sE2 to SR-B1-CHO cells after preincubation of sE2 with 40 μg/mL of HC33.4. Each point was calculated from 10e4 events. Background binding to wild type CHO cells was subtracted from mean fluorescence intensity (MFI) values. sE2 supernatants were normalized for relative sE2 concentration prior to dilution.

Similar articles

Cited by

References

    1. Thomas DL, Astemborski J, Rai RM, et al. The natural history of hepatitis c virus infection: Host, viral, and environmental factors. JAMA. 2000;284: 450–456. - PubMed
    1. Holmberg SD, Spradling PR, Moorman AC, Denniston MM. Hepatitis C in the United States. N Engl J Med. 2013;368: 1859–1861. 10.1056/NEJMp1302973 - DOI - PMC - PubMed
    1. Zibbell JE, Iqbal K, Patel RC, Suryaprasad A, Sanders KJ, Moore-Moravian L, et al. Increases in hepatitis C virus infection related to injection drug use among persons aged ≤30 years—kentucky, tennessee, virginia, and west virginia, 2006–2012. MMWR Morb Mortal Wkly Rep. 2015;64: 453–458. - PMC - PubMed
    1. Conrad C, Bradley HM, Broz D, Buddha S, Chapman EL, Galang RR, et al. Community Outbreak of HIV Infection Linked to Injection Drug Use of Oxymorphone—Indiana, 2015. MMWR Morb Mortal Wkly Rep. 2015;64: 443–444. - PMC - PubMed
    1. Five–Year Risk of Late Relapse or Reinfection With Hepatitis C After Sustained Virological Response: Meta-analysis of 49 Studies in 8534 Patients [Internet]. [cited 7 Jun 2015]. http://www.croiconference.org/sessions/five%E2%80%93year-risk-late-relap...

Publication types

MeSH terms

Substances

LinkOut - more resources