. 2017 Feb 24;11(1):28.
doi: 10.1186/s12918-016-0382-0.

Network topology of NaV1.7 mutations in sodium channel-related painful disorders

Collaborators, Affiliations

Network topology of NaV1.7 mutations in sodium channel-related painful disorders

Dimos Kapetis et al. BMC Syst Biol. .

Abstract

Background: Gain-of-function mutations in SCN9A gene that encodes the voltage-gated sodium channel NaV1.7 have been associated with a wide spectrum of painful syndromes in humans including inherited erythromelalgia, paroxysmal extreme pain disorder and small fibre neuropathy. These mutations change the biophysical properties of NaV1.7 channels leading to hyperexcitability of dorsal root ganglion nociceptors and pain symptoms. There is a need for better understanding of how gain-of-function mutations alter the atomic structure of Nav1.7.

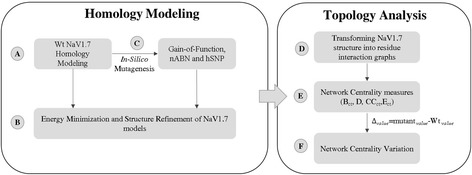
Results: We used homology modeling to build an atomic model of NaV1.7 and a network-based theoretical approach, which can predict interatomic interactions and connectivity arrangements, to investigate how pain-related NaV1.7 mutations may alter specific interatomic bonds and cause connectivity rearrangement, compared to benign variants and polymorphisms. For each amino acid substitution, we calculated the topological parameters betweenness centrality (B ct ), degree (D), clustering coefficient (CC ct ), closeness (C ct ), and eccentricity (E ct ), and calculated their variation (Δ value = mutant value -WT value ). Pathogenic NaV1.7 mutations showed significantly higher variation of |ΔB ct | compared to benign variants and polymorphisms. Using the cut-off value ±0.26 calculated by receiver operating curve analysis, we found that ΔB ct correctly differentiated pathogenic NaV1.7 mutations from variants not causing biophysical abnormalities (nABN) and homologous SNPs (hSNPs) with 76% sensitivity and 83% specificity.

Conclusions: Our in-silico analyses predict that pain-related pathogenic NaV1.7 mutations may affect the network topological properties of the protein and suggest |ΔB ct | value as a potential in-silico marker.

Keywords: Network analysis; Neuropathic pain; Sodium channel; Structural modeling.


Figures

Fig. 1
Fig. 1
NaV1.7 computational protocol overview. A NaV1.7 WT homology modelling of based on the bacterial NavAb sodium channel template. B Energy minimization and structure refinement of the protein structure with YAMBER force field and FG-MD server. C In-silico mutagenesis for pathogenetic and control group (nABN/hSNPs) mutations. D Transforming NaV1.7 structure into residue interaction graphs. The construction of inter-residue network was based on interatomic bonds (hydrophobic, hydrogen bonds, salt-bridges, cation-π and π-π stacking interactions) using the commands “ListIntAtom” and “ListIntBo” via YASARA software. The de novo network construction for each mutant and WT models is achieved considering the predicted binary interatomic bonds. E-F. Network centrality calculation and their relative variation between mutant and WT (Δvalue = mutant value-WT value)
Fig. 2
Fig. 2
NaV1.7 structure and inter-atomic network features. a View of the sodium channel α-subunit from the intracellular side of the membrane NaV1.7 is folded into four repeated domains (DI–DIV); helices S1–S4 comprise the voltage-sensing domain (VSD); helices S5–S6 and their intracellular linker comprise the pore domain (PD). b Intramembrane view of the folded model of NaV1.7. c The graph shows the topology of the mutations found in patients with inherited erythromelalgia (IEM; red), paroxysmal extreme pain disorder (PEPD; green), small-fibre neuropathy (SFN; purple) and the amino acid substitution with no biophysical abnormalities (nABN) and homologous SNPs (light blue). Nodes represent the residues and edges of the interatomic bonds. Red and black edges represent high (red) or low (grey) edge betweenness centrality (EBct) values, respectively. Edge thickness are proportional to EBct and reveal that a high number of shortest paths pass through few edges. *This mutation associates with clinical features of IEM and SFN. ǂThis mutation causes in vitro biophysics changes and in vivo symptoms common both to IEM and PEPD. The NaV1.7 amino acid network were visualized using Cytoscape’s Organic layout, which is a force-directed layout algorithm similar to the Fruchterman-Reingold approach
Fig. 3
Fig. 3
Topological parameter profiles of NaV1.7 gain-of-function mutations and nABN and hSNPs. a The upper panel shows the Bct profile of gain-of-function mutation; the lower panel show the Bct profile of nABN and hSNPs. Squares indicates Bct values of WT amino acids, circles indicate Bct values of mutated amino acids. The graphs highlight that the difference between Bct value of mutated amino acids and Bct value of WT amino acids is higher in the cohort of gain-of-function (GF) mutations (upper panel) compared to control (Ctrl) nABN and hSNPs (lower panel). Bct values are multipled by 100. b The box plot shows the |ΔBct| difference between gain-of-function mutations and the cohort of nABN and hSNP variants (mean gain-of-function |∆Bct| = 1.14 ± 1.40; nABN and hSNP ∆Bct = 0.19 ± 0.28; ***p < 0.001 by Wilcoxon signed-ranked test). |∆Bct| values are multipled by 100; dark horizontal lines and the triangular symbol represent median and mean values respectively, with the box representing the 25th and 75th percentiles, the whiskers the 5th and 95th percentiles, and the dots the outliers. c The upper panel shows the Degree (D) profile of gain-of-function mutations; the lower panel show the D profile of nABN and hSNPs. Squares indicates D values of WT amino acids, circles indicate D values of mutated amino acids. The box plot shows the |ΔD| difference between gain-of-function (GF) mutations and the cohort of nABN and hSNP (Ctrl) variants (gain-of-function mean |∆D| = 4.3 ± 5.15; nABN and hSNP |∆D| = 2.37 ± 2.10; p > 0.05 by Wilcoxon signed-ranked test); dark horizontal lines and the triangular symbol represent median and mean values respectively, with the box representing the 25th and 75th percentiles, the whiskers the 5th and 95th percentiles, and the dots the outliers. d The upper panel shows the Clustering Coefficient (CC) profile of gain-of-function mutations; the lower panel show the CC profile of nABN and hSNPs. Squares indicates CC values of WT amino acids; circles indicate CC values of mutated amino acids. The box plot shows the |ΔCCct| difference between gain-of-function (GF) mutations and the cohort of nABN and hSNP (Ctrl) variants (mean gain-of-function |∆CCct| = 0.15 ± 0.20; nABN and hSNP |∆CCct| = 0.20 ± 0.25; p > 0.05 by Wilcoxon signed-ranked test); dark horizontal lines and the triangular symbol represent median and mean values respectively, with the box representing the 25th and 75th percentiles, the whiskers the 5th and 95th percentiles, and the dots the outliers. e The upper panel shows the Closeness (Cct) profile of gain-of-function mutations; the lower panel show the Cct profile of nABN and hSNPs. Squares indicates Cct values of WT amino acids, circles indicate Cct values of mutated amino acids. The box plot shows the ΔCct difference between gain-of-function (GF) mutations and the cohort of nABN and hSNP (Ctrl) variants (mean gain-of-function |∆Cct| = 0.6 ± 0.9; nABN and hSNP |∆Cct| = 0.7 ± 1.4; p > 0.05 by Wilcoxon signed-ranked test). Cct and ∆Cct values are multipled by 100; dark horizontal lines and the triangular symbol represent median and mean values respectively, with the box representing the 25th and 75th percentiles, the whiskers the 5th and 95th percentiles, and the dots the outliers. f The upper panel shows the Eccentricity (Ect) profile of gain-of-function mutations; the lower panel show the Ect profile of nABN and hSNPs. Squares indicates Ect values of WT amino acids, circles indicate Ect values of mutated amino acids. The box plot shows the |ΔEct| difference between gain-of-function (GF) mutations and the cohort of nABN and hSNP (Ctrl) variants (mean gain-of-function |∆Ect| = 1.53 ± 3.75; nABN and hSNP |∆Ect| = 2.05 ± 4.62; p > 0.05 by Wilcoxon signed-ranked test); dark horizontal lines and the triangular symbol represent median and mean values respectively, with the box representing the 25th and 75th percentiles, the whiskers the 5th and 95th percentiles, and the dots the outliers
Fig. 4
Fig. 4
Structural modelling of NaV1.7 variants and their interatomic bonds. a The graph shows the NaV1.7 sodium channel topology and highlights the IEM associated mutation F216S and its intra-domain bond interaction (S3 and S4; depicted in red). b Upper left inset shows the intramembrane view of the NaV1.7 channel and the amino acid F216. Upper right inset shows network view of the four NaV1.7 channel domains (DI, purple; DII, green; DIII, light blue; DIV, orange); the topology of amino acid F216 is showed as grey node. Lower insets show the bonds of WT amino acid F216 (left) and mutated amino acid S216 (right). Hydrophobic bonds are showed in green solid lines. H-bonds are showed with yellow dashed lines. F216 (DI, red) interacts with V194, V195, F198, T202 (S3, DI) and L219 (S4, DI) via hydrophobic bonds. F216 interact via H-bonds with L213 (formed by F216[NH] and L213[CO]) and L219 (F216[CO] with L219[NH]) located in S4, DI. The mutation F216S (right) interrupts all the hydrophobic interactions with S3 residues and created new H-bonds (S216[NH] with A212[CO]) causing a decrease of Bct and EBct values. c The graph shows the NaV1.7 sodium channel topology and highlights the IEM associated mutation L858H and its inter-domain bond interaction (S4-S5 and S4; depicted in red). d Upper left inset shows the intramembrane view of the NaV1.7 channel and the amino acid L858. Upper right insets show network view of the four NaV1.7 channeldomains (DI, purple; DII, green; DIII, light blue; DIV, orange); the topology of amino acid L858 is showed as grey node. Lower inset shows the bonds of WT amino acid L858 (left) and mutated amino acid H858 (right). Hydrophobic bonds are showed in green solid lines. H-bonds are indicated by yellow dashed lines. L858 residue (red, S4-S5; DII) interacts with I234 (DI; S4-S5), V861 (DII; S4-S5), N950, L951 and V947 (DII; S6) through hydrophobic bonds and through H-bonds with L862 (formed by L858[CO] and L862[NH]) located in DII; S4-S5. L858H mutation interrupts hydrophobic interaction with I234 (DI; S4-S5), V861 (DII; S4-S5), N950 and forms new H-bonds with A854 (formed by H858[NH] and A854[CO]) (DII; S4-S5) and V947 (formed by H858[NE2] and V947[CO]) (DII; S6). These changes decrease Bct value of amino acid 858 from 2.2 to 0.39. e The graph shows the NaV1.7 sodium channel topology and highlights the nABN mutation L1267V that is located in the domain DIII; S3 depicted in red. f Upper left inset show the intramembrane view of the NaV1.7 channel and the amino acid L1267. Upper right inset shows network view of the four NaV1.7 channel domains (DI, purple; DII, green; DIII, light blue; DIV, orange); the topology of amino acid L1267 is showed as grey node. Lower inset show the bonds of WT amino acid L1267 (left) and mutated amino acid V1267 (right). Hydrophobic bonds are showed in green solid lines. H-bonds are indicated by yellow dashed lines. L1267[NH] (VSD in DIII) interacts through H-bonds with V1263[CO]. V1267mutation interacts with V1263 through a hydrophobic bond. This change does not modify Bct value of the residue 1267
Fig. 5
Fig. 5
Network inter-residue connectivity of the IEM-associated mutations I848T and N395K. a The graph shows the NaV1.7 sodium channel topology and highlights the amino acids I848 (DI; S4-S5) and N395 (DI; S6). Inter-domain bond interaction are depicted in red for the IEM associated mutation I848T and in green for the IEM associated mutation N395K. b Upper panels show I848 and T848 networks, lower panels show N395 and K395 network. Bct and EBct evidence interatomic traffic over the network. Red-to-white color gradient of amino acids (nodes) represents Bct value (red represents high Bct and white low Bct). Red-to-black color gradient of edges (amino acid interatomic interactions) corresponds to EBct value (red represents high EBct and black low EBct). Hydrophobic bonds are showed in solid lines and H-bonds are indicated by dashed lines. I848 present high EBct of connecting different parts of the NaV1.7 network. Upper right panels show that I848 interacts through hydrophobic interactions with S4-S5 (DII) and pore (DIII) through I845 and F1435 that are two residues having very high Bct values (3.4 and 6.6, respectively) and H-bonds with V852 and L844 (I848[CO] with V852[NH]; I848[NH] with L844[CO]). Note the difference of Bct of the upper left panel (I848Bct = 7.36) compared to the upper right panel (T848Bct = 1.52). I848T mutation interrupts the shortest paths within the network between DII (S4-S5) and DIII (pore) and therefore ΔBct shifts to a negative value (-5.84). T848 interacts with F1435 through hydrophobic interactions and with S851 and L844 through H-bonds (T848[CO] with S851[NH]; T848[NH] with L844[CO]; T848[HG1] with L844[CO]). Lower panels show that N395 amino acid (red, S6 in pore module in DI) interacts with L1626 (S4-S5) via hydrophobic bond and via H-bonds formed by N395[CO] and A399[NH]and N395[NH]and F391[CO]. K395 mutation creates new hydrophobic bonds with V248 (S4-S5, DI), K398 (S6, DI), V1747 (S6, DIV), L1622 (S4-S5, DIV) and new H-bonds formed by K395[NZ] with N1751[CG] (S6, DIV) and K395[NZ] with A1625[CO] (S4-S5, DIV). These new bonds create a novel communication path within the network and thus increase Bct value of the residue 395 (K395Bct = 7.76 compared to the left panel N395Bct = 2.44). Edge thickness are proportional to EBct and reveal that a high number of shortest paths pass through few edges
Fig. 6
Fig. 6
Summary of ∆Bct values for all nABN and hSNP variants and gain-of-function mutations. a ∆Bct values of all the nABN and hSNP variants (light blue circles) and all the gain-of-function mutations (red circles) analysed in this study. Dashed lines indicates the cut-off value (ΔBct ± 0.26) that maximizes sensitivity and specificity. b Intra- and extracellular view of the NaV1.7 and locations of amino acids affected by gain-of-function mutations (red) that are linked with IEM, SFN and PEPD and control group variants (nABN and hSNPs; light blue). Localization of IEM, SFN and PEPD related mutation showed in red (red). *The M1532 residue shares the same position with the SFN-related M1532I mutation which causes in vitro biophysics changes and M1532V variant belongs to the control group.c Receiver operating curve (ROC) of gain-of-function mutations and control mutations (nABN and hSNPs) as a function of ΔBct. Using a cut-off value of ± 0.26, ΔBct correctly classified 44 out of 53 controls and 23 of 30 gain-of-function mutations yielding 76% sensitivity and 83% specificity. The area under the curve is 0.81 (95% Confidence Interval = 0.70 to 0.91)

References

    1. Catterall WA. Voltage-gated sodium channels at 60: structure, function and pathophysiology. J Physiol. 2012;590:2577–2589. doi: 10.1113/jphysiol.2011.224204. - DOI - PMC - PubMed
    1. Chanda B, Bezanilla F. Tracking voltage-dependent conformational changes in skeletal muscle sodium channel during activation. J Gen Physiol. 2002;120:629–645. doi: 10.1085/jgp.20028679. - DOI - PMC - PubMed
    1. Dib-Hajj SD, Yang Y, Black JA, Waxman SG. The Na(V)1.7 sodium channel: from molecule to man. Nat Rev Neurosci. 2013;14:49–62. doi: 10.1038/nrn3404. - DOI - PubMed
    1. Cummins TR, Dib-Hajj SD, Waxman SG. Electrophysiological properties of mutant Nav1.7 sodium channels in a painful inherited neuropathy. J Neurosci. 2004;24:8232–8236. doi: 10.1523/JNEUROSCI.2695-04.2004. - DOI - PMC - PubMed
    1. Han C, Rush AM, Dib-Hajj SD, Li S, Xu Z, Wang Y, et al. Sporadic onset of erythermalgia: a gain-of-function mutation in Nav1.7. Ann Neurol. 2006;59:553–558. doi: 10.1002/ana.20776. - DOI - PubMed

Publication types

Substances