

Pediatric Trauma Assessment and Management Database: Leveraging Existing Data Systems to Predict Mortality and Functional Status after Pediatric Injury
- PMID: 28235647
- PMCID: PMC6475528
- DOI: 10.1016/j.jamcollsurg.2017.01.061
Pediatric Trauma Assessment and Management Database: Leveraging Existing Data Systems to Predict Mortality and Functional Status after Pediatric Injury
Abstract
Background: Efforts to improve pediatric trauma outcomes need detailed data, optimally collected at lowest cost, to assess processes of care. We developed a novel database by merging 2 national data systems for 5 pediatric trauma centers to provide benchmarking metrics for mortality and non-mortality outcomes and to assess care provided throughout the care continuum.
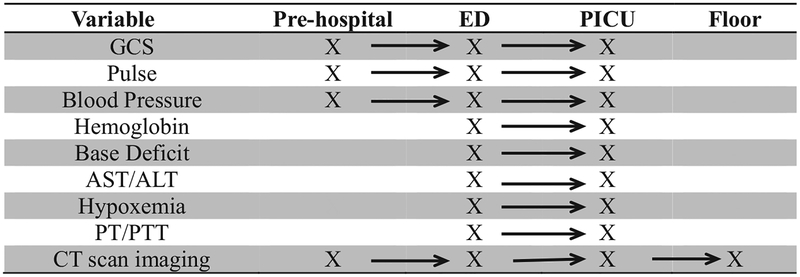
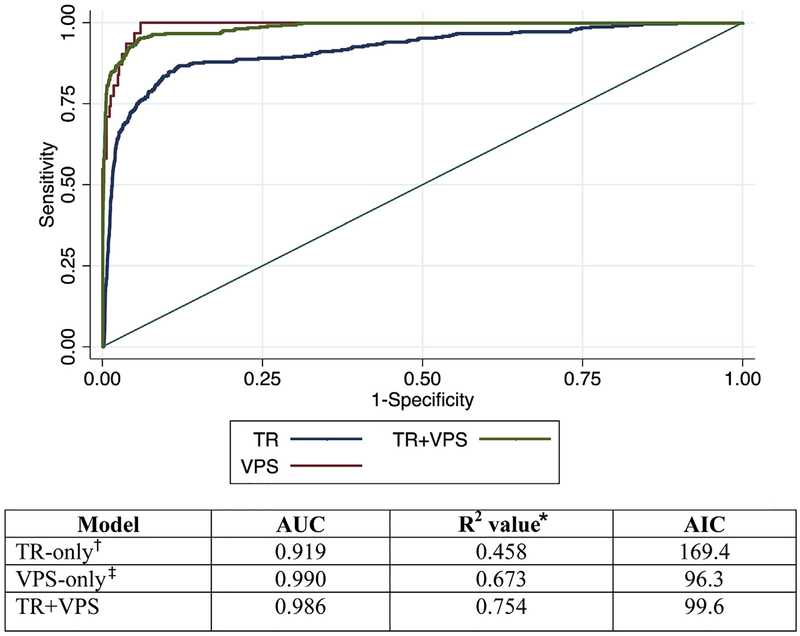
Study design: Trauma registry and Virtual Pediatric Systems, LLC (VPS) from 5 pediatric trauma centers were merged for children younger than 18 years discharged in 2013 from a pediatric ICU after traumatic injury. For inpatient mortality, we compared risk-adjusted models for trauma registry only, VPS only, and a combination of trauma registry and VPS variables (trauma registry+VPS). To estimate risk-adjusted functional status, we created a prediction model de novo through purposeful covariate selection using dichotomized Pediatric Overall Performance Category scale.
Results: Of 688 children included, 77.3% were discharged from the ICU with good performance or mild overall disability and 17.6% with moderate or severe overall disability or coma. Inpatient mortality was 5.1%. The combined dataset provided the best-performing risk-adjusted model for predicting mortality, as measured by the C-statistic, pseudo-R2, and Akaike Information Criterion, when compared with the trauma registry-only model. The final Pediatric Overall Performance Category model demonstrated adequate discrimination (C-statistic = 0.896) and calibration (Hosmer-Lemeshow goodness-of-fit p = 0.65). The probability of poor outcomes varied significantly by site (p < 0.0001).
Conclusions: Merging 2 data systems allowed for improved risk-adjusted modeling for mortality and functional status. The merged database allowed for patient evaluation throughout the care continuum on a multi-institutional level. Merging existing data is feasible, innovative, and has potential to impact care with minimal new resources.
Copyright © 2017 American College of Surgeons. Published by Elsevier Inc. All rights reserved.
Figures


References
-
- Centers for Disease Control and Prevention. Web-based Injury Statistics Query and Reporting System (WISQARS). National Center for Injury Prevention and Control; Available at: http://www.cdc.gov/injury/wisqars/index.html. Published 2014. Accessed March 27, 2016.
-
- American College of Surgeons, Committee on Trauma. Resources for Optimal Care of the Injured Patient 2014. Vol 10 Chicago, IL: American College of Surgeons; 2014.
-
- American College of Surgeons. The Committee on Trauma. Available at: https://www.facs.org/quality-programs/trauma. Accessed February 2, 2015.
-
- Hemmila MR, Nathens AB, Shafi S, et al. The Trauma Quality Improvement Program: pilot study and initial demonstration of feasibility. J Trauma 2010;68:253–262. - PubMed
-
- Performance Improvement Subcommittee of the American College of Surgeons Committee on Trauma. Trauma Performance Improvement Reference Manual. Chicago, IL: American College of Surgeons; 2002.
MeSH terms
Grants and funding
LinkOut - more resources
Full Text Sources
Other Literature Sources
Medical
