

Cellular Hierarchy as a Determinant of Tumor Sensitivity to Chemotherapy
- PMID: 28235762
- PMCID: PMC5487257
- DOI: 10.1158/0008-5472.CAN-16-2434
Cellular Hierarchy as a Determinant of Tumor Sensitivity to Chemotherapy
Abstract
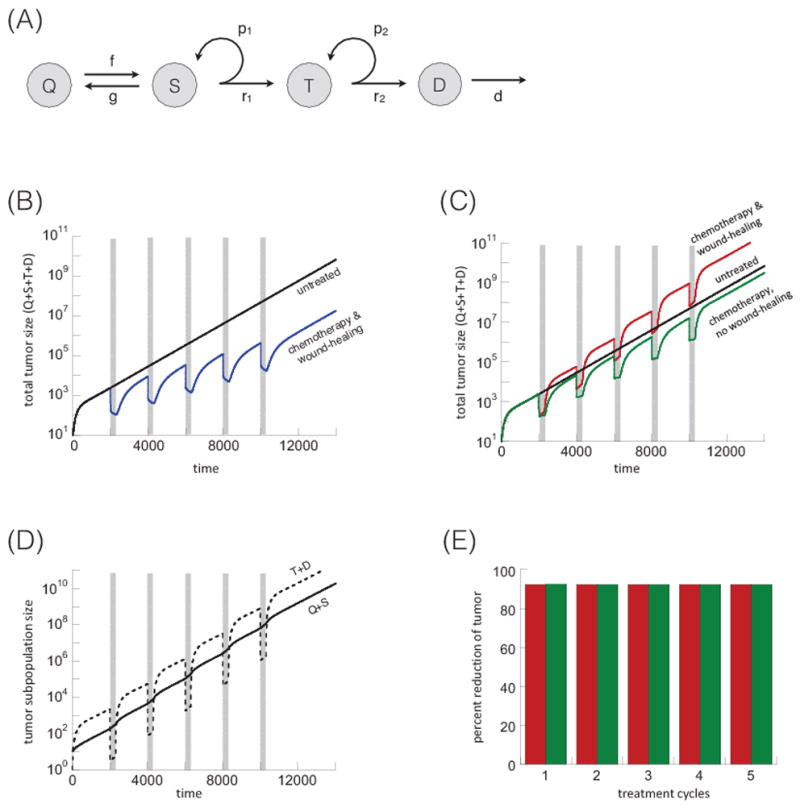
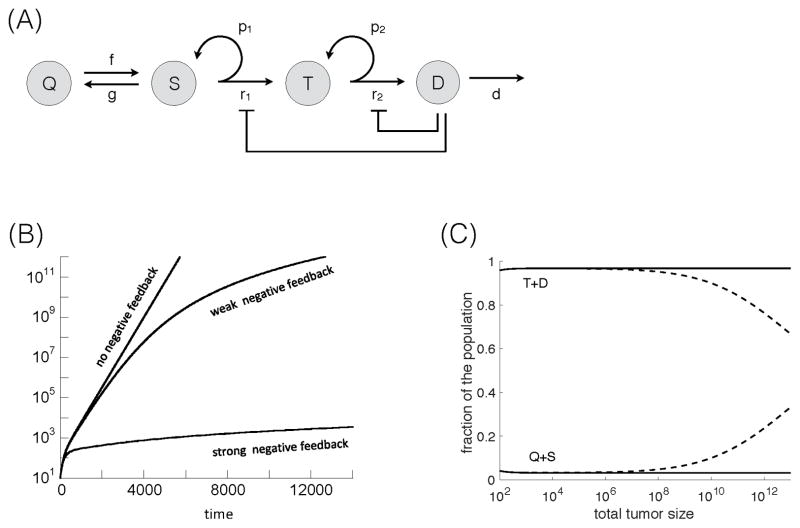
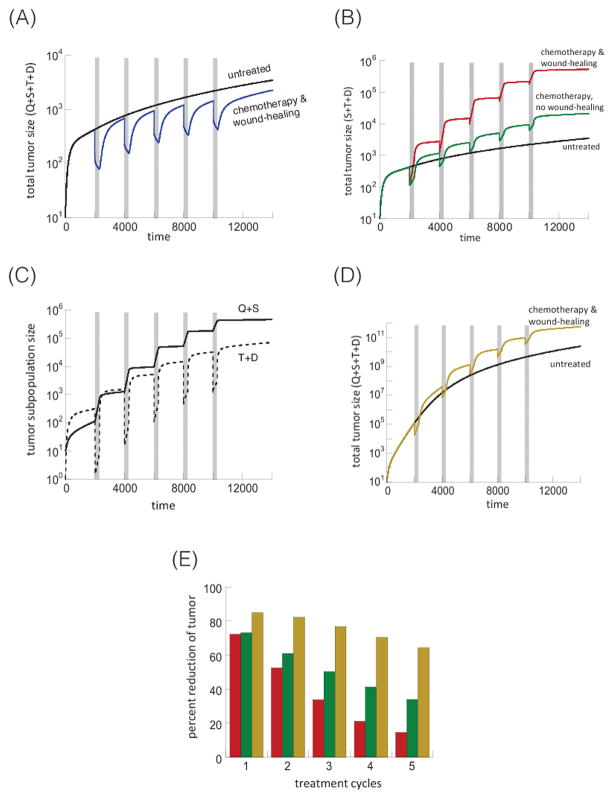
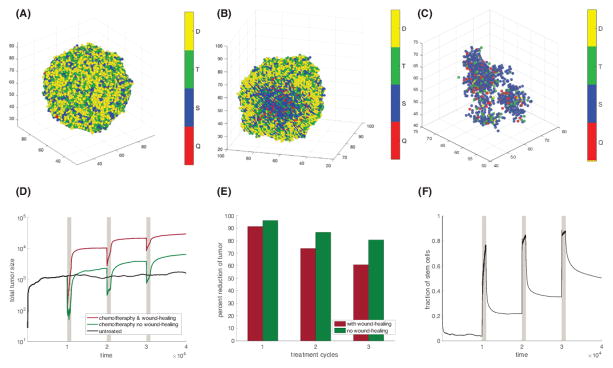
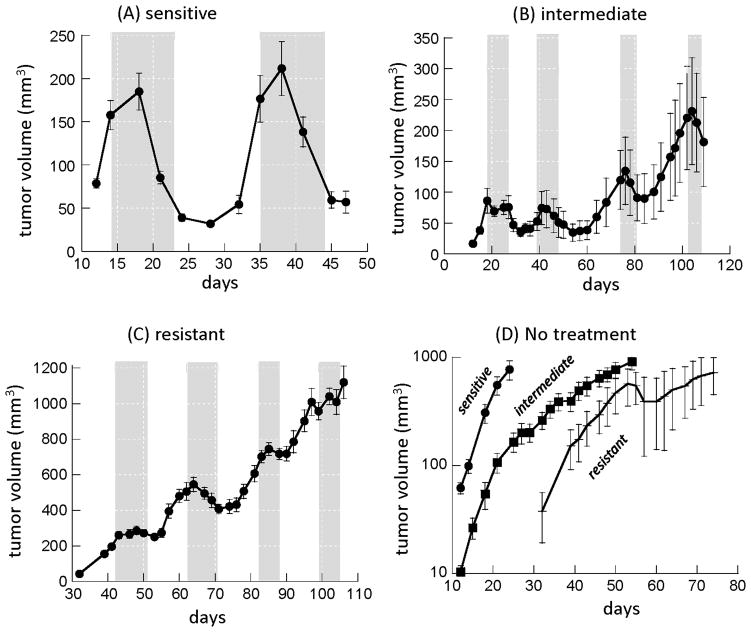
Chemotherapy has been shown to enrich cancer stem cells in tumors. Recently, we demonstrated that administration of chemotherapy to human bladder cancer xenografts could trigger a wound-healing response that mobilizes quiescent tumor stem cells into active proliferation. This phenomenon leads to a loss of sensitivity to chemotherapy partly due to an increase in the number of tumor stem cells, which typically respond to chemotherapy-induced cell death less than more differentiated cells. Different bladder cancer xenografts, however, demonstrate differential sensitivities to chemotherapy, the basis of which is not understood. Using mathematical models, we show that characteristics of the tumor cell hierarchy can be crucial for determining the sensitivity of tumors to drug therapy, under the assumption that stem cell enrichment is the primary basis for drug resistance. Intriguingly, our model predicts a weaker response to therapy if there is negative feedback from differentiated tumor cells that inhibits the rate of tumor stem cell division. If this negative feedback is less pronounced, the treatment response is predicted to be enhanced. The reason is that negative feedback on the rate of tumor cell division promotes a permanent rise of the tumor stem cell population over time, both in the absence of treatment and even more so during drug therapy. Model application to data from chemotherapy-treated patient-derived xenografts indicates support for model predictions. These findings call for further research into feedback mechanisms that might remain active in cancers and potentially highlight the presence of feedback as an indication to combine chemotherapy with approaches that limit the process of tumor stem cell enrichment. Cancer Res; 77(9); 2231-41. ©2017 AACR.
©2017 American Association for Cancer Research.
Conflict of interest statement
Figures
Similar articles
-
Tyr1068-phosphorylated epidermal growth factor receptor (EGFR) predicts cancer stem cell targeting by erlotinib in preclinical models of wild-type EGFR lung cancer.Cell Death Dis. 2015 Aug 6;6(8):e1850. doi: 10.1038/cddis.2015.217. Cell Death Dis. 2015. PMID: 26247735 Free PMC article.
-
Blocking PGE2-induced tumour repopulation abrogates bladder cancer chemoresistance.Nature. 2015 Jan 8;517(7533):209-13. doi: 10.1038/nature14034. Epub 2014 Dec 3. Nature. 2015. PMID: 25470039 Free PMC article.
-
Cisplatin-enriching cancer stem cells confer multidrug resistance in non-small cell lung cancer via enhancing TRIB1/HDAC activity.Cell Death Dis. 2017 Apr 13;8(4):e2746. doi: 10.1038/cddis.2016.409. Cell Death Dis. 2017. PMID: 28406482 Free PMC article.
-
Lung cancer stem cells: The root of resistance.Cancer Lett. 2016 Mar 28;372(2):147-56. doi: 10.1016/j.canlet.2016.01.012. Epub 2016 Jan 18. Cancer Lett. 2016. PMID: 26797015 Review.
-
The Role of Cancer Stem Cells in Recurrent and Drug-Resistant Lung Cancer.Adv Exp Med Biol. 2016;890:57-74. doi: 10.1007/978-3-319-24932-2_4. Adv Exp Med Biol. 2016. PMID: 26703799 Review.
Cited by
-
Predicting Survival Signature of Bladder Cancer Related to Cancer-Associated Fibroblast (CAF) Constructed by Intersecting Genes in TCGA and GEO.Mol Biotechnol. 2024 Sep;66(9):2532-2547. doi: 10.1007/s12033-023-00892-y. Epub 2023 Sep 25. Mol Biotechnol. 2024. PMID: 37749482
-
Effect of cellular de-differentiation on the dynamics and evolution of tissue and tumor cells in mathematical models with feedback regulation.J Theor Biol. 2018 Jul 7;448:86-93. doi: 10.1016/j.jtbi.2018.03.036. Epub 2018 Mar 30. J Theor Biol. 2018. PMID: 29605227 Free PMC article.
-
Evolution of cancer stem cell lineage involving feedback regulation.PLoS One. 2021 May 20;16(5):e0251481. doi: 10.1371/journal.pone.0251481. eCollection 2021. PLoS One. 2021. PMID: 34014979 Free PMC article.
-
WDR76 regulates 5-fluorouracil sensitivity in colon cancer via HRAS.Discov Oncol. 2023 Apr 20;14(1):45. doi: 10.1007/s12672-023-00656-9. Discov Oncol. 2023. PMID: 37081180 Free PMC article.
-
Spatial dynamics of feedback and feedforward regulation in cell lineages.PLoS Comput Biol. 2022 May 6;18(5):e1010039. doi: 10.1371/journal.pcbi.1010039. eCollection 2022 May. PLoS Comput Biol. 2022. PMID: 35522694 Free PMC article.
References
-
- Rodriguez-Brenes IA, Wodarz D, Komarova NL. Characterizing inhibited tumor growth in stem-cell-driven non-spatial cancers. Mathematical biosciences. 2015;270:135–41. - PubMed
-
- Gottesman MM. Mechanisms of cancer drug resistance. Annual review of medicine. 2002;53:615–27. - PubMed
-
- Holohan C, Van Schaeybroeck S, Longley DB, Johnston PG. Cancer drug resistance: an evolving paradigm. Nature reviews Cancer. 2013;13:714–26. - PubMed
Publication types
MeSH terms
Grants and funding
LinkOut - more resources
Full Text Sources
Other Literature Sources
Medical
Miscellaneous
