. 2017 Apr 15;77(8):2040-2051.
doi: 10.1158/0008-5472.CAN-16-1577. Epub 2017 Feb 24.

Armed Oncolytic Adenovirus-Expressing PD-L1 Mini-Body Enhances Antitumor Effects of Chimeric Antigen Receptor T Cells in Solid Tumors

Affiliations

Armed Oncolytic Adenovirus-Expressing PD-L1 Mini-Body Enhances Antitumor Effects of Chimeric Antigen Receptor T Cells in Solid Tumors

Kiyonori Tanoue et al. Cancer Res. .

Abstract

Chimeric antigen receptor-modified T cells (CAR T cells) produce proinflammatory cytokines that increase expression of T-cell checkpoint signals such as PD-L1, which may inhibit their functionality against solid tumors. In this study, we evaluated in human tumor xenograft models the proinflammatory properties of an oncolytic adenovirus (Onc.Ad) with a helper-dependent Ad (HDAd) that expresses a PD-L1 blocking mini-antibody (mini-body; HDPDL1) as a strategy to enhance CAR T-cell killing. Coadministration of these agents (CAd-VECPDL1) exhibited oncolytic effects with production of PD-L1 mini-body locally at the tumor site. On their own, HDPDL1 exhibited no antitumor effect and CAd-VECPDL1 alone reduced tumors only to volumes comparable to Onc.Ad treatment. However, combining CAd-VECPDL1 with HER2.CAR T cells enhanced antitumor activity compared with treatment with either HER2.CAR T cells alone or HER2.CAR T cells plus Onc.Ad. The benefits of locally produced PD-L1 mini-body by CAd-VECPDL1 could not be replicated by infusion of anti-PD-L1 IgG plus HER2.CAR T cells and coadministration of Onc.Ad in an HER2+ prostate cancer xenograft model. Overall, our data document the superiority of local production of PD-L1 mini-body by CAd-VECPDL1 combined with administration of tumor-directed CAR T cells to control the growth of solid tumors. Cancer Res; 77(8); 2040-51. ©2017 AACR.


Conflict of interest statement

Conflict of Interest: The authors disclose no potential conflicts of interest.

Figures

Figure 1
Figure 1. HDAd-derived PD-L1 mini-body functions similarly to commercial anti-PD-L1 IgG
(A) PC-3 and SiHa were co-cultured with HER2.CAR T-cells generated from 3 different donors (effector:target ratio of 1:20). Cells were harvested at 8, 24, 72 and 120 hours post-co-culture, and PD-1 on HER2.CAR T-cells and PD-L1 on cancer cells were analyzed by flow cytometry. Data are presented as means ± SD (n=3). (B) Schematic structure of HDAd encodes an anti-PD-L1 mini-body expression cassette (HDPD-L1). A549 cells were infected with different dosages of HDPD-L1. Media and cells were collected at 48 hours post-infection. Samples were subjected to western blotting, and PD-L1 mini-body in media was detected by anti-HA antibody. Human GAPDH in cells was detected by anti-human GAPDH antibody, HDeGFP encoding an EGFP expression cassette was used as a control. (C) A549 media infected with 1,000 vp/cell of HDPD-L1 or HDeGFP were collected at 48 hours post-infection, and binding of PD-L1 mini-body to recombinant human PD-L1 was assessed by enzyme-linked immunosorbent assay (ELISA). Anti-PD-L1 IgG or Isotype IgG were controls (10 μg/mL; highest concentration). Data are presented as means ± SD (n=3). (D) Purified CD4+ T-cells were co-cultured with irradiated allogeneic mature DCs in the presence of PD-L1 mini-body-containing medium, 10 μg/mL anti-PD-L1 IgG or isotype IgG for 5 days (T-cell:DC ratio of 10:1). IFNγ levels in the medium were measured by ELISA. Data are presented as means ± SD (n=4). *P= 0.005. The experiment was triplicated with similar results.
Figure 2
Figure 2. Blockade of PD-L1:PD-1 interaction enhances cancer cell killing by HER2.CAR T-cells
PC-3 expressing eGFP (A) and SiHa expressing eGFP (B) were infected with 1,000 vp/cell of HDAd0 or HDPD-L1. HER2.CAR T-cells were added at 24 hours post-infection (effector:target ratio of 1:20). The same co-culture experiments were performed in the presence of 10 μg/mL anti-PD-L1 IgG or isotype IgG. Cells were harvested 120 hours post-co-culture, and viable cells (7AAD-) per 5,000 counting beads were analyzed by flow cytometry. Data are presented as means ± SD (n=4). *P < 0.05, **P < 0.01, ***P=0.006, ****P=0.004, *****P < 0.001 for (A). *P < 0.03, **P < 0.01, ***P < 0.005, ****P<0.0001 for (B). The experiments were repeated with a HER2.CAR T-cells derived from a different donor with similar results.
Figure 3
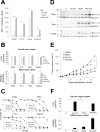
Figure 3. Co-infection of Onc.Ad with HDPD-L1 (CAd-VECPD-L1) amplified PD-L1 mini-body while maintaining oncolysis in vitro and in vivo
(A) A549, PC-3, SiHa and HepG2 were infected with a total 10 Vp/cell of HDPD-L1, Onc.Ad or with an CAd-VECPD-L1 (Onc.Ad:HDAd; 1:10). Medium samples were collected at 48 hours post-infection. Levels of PD-L1 mini-body in medium samples were quantified by ELISA-based assay for HA-tagged protein. Data are presented as means ± SD (n=4). *P =0.003, **P=0.002, ***P<0.001. (B) DNA samples were extracted 48 hr post-infection, and Onc.Ad and HDAd vector copy numbers were measured by quantitative PCR. Data were normalized with human genomic GAPDH. Data are presented as means ± SD (n=4). *P < 0.03, **P< 0.001. (C) Cancer cell lines were infected with increasing doses of HDPD-L1, Onc.Ad or with CAd-VECPD-L1 (Onc.Ad:HDAd= 1:10). Viable cells were analyzed at 96 hours by MTS assay. Data are presented as means ± SD (n=6). (D) PC-3 cells were transplanted into the right flanks of nude mice. A total of 1×10⁸ Vp of Onc.Ad, HDAd or CAd-VECPD-L1 (Onc.Ad:HDAd= 1:20) were injected intratumorally. Tumors were collected and harvested at 3, 7 and 21 days post-injection. PD-L1 mini-body in tumor lysates was detected by western blotting. (E) Tumor volumes were measured at different time points. Data are presented as means ± SD (n=4). *P = 0.006. (F) Total DNA was extracted from tumors at 35 days post-injection of Ads, and the copy number of each vector determined by quantitative PCR. Data were normalized with human genomic GAPDH. Data are presented as means ± SD (n=4). *P< 0.02, **P =0.008.
Figure 4
Figure 4. CAd-VECPD-L1 enhanced the anti-tumor effects of HER2.CAR T-cells in vivo
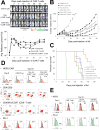
(A) PC-3 cells were transplanted into the right flanks of NSG mice. A total of 1×10⁷ Vp of Onc.Ad or CAd-VECPD-L1 (Onc.Ad:HDAd= 1:20) were injected intra-tumorally. A total of 1×10⁶ HER2.CAR T-cells expressing firefly luciferase (ffLuc) were systemically administered 3 days post-injection of Ads. Bioluminescence of HER2.CAR T-cells was monitored at different time points. Data are presented as means ± SD (n=8). *P =0.002, **P < 0.001. (B) Tumor volumes were measured at different time points. Data are presented as means ± SD (n=8). *P = 0.002. (C) Kaplan-Meier survival curve after administration of Ad gene therapy. The end point was established at tumor volume of > 1,500 mm3. Data are presented as means ± SD (n=8). *P < 0.001. (D) T-cells at tumor site were isolated at 84 days post-infusion, and phenotype was analyzed by flow cytometry. (E) Tumor cells were isolated at 84 days post-infusion of HER2.CAR T-cells and were cultured in vitro. Cells were harvested at 72 hours, and phenotype was analyzed by flow cytometry.
Figure 5
Figure 5. CAd-VECPD-L1 enhanced the anti-tumor effects of HER2.CAR T-cells in SiHa xenograft model
(A) SiHa cells were transplanted into the right flanks of NSG mice. A total of 1×10⁷ Vp of Onc.Ad or CAd-VECPD-L1 (Onc.Ad:HDAd= 1:20) were injected intra-tumorally. A total of 1×10⁶ HER2.CAR T-cells expressing firefly luciferase (ffLuc) were systemically administered 3 days post-injection of Ads. Bioluminescence of HER2.CAR T-cells was monitored at different time points. Data are presented as means ± SD (n=5). (B) Tumor volumes were measured at different time points. Data are presented as means ± SD (n=5). *P < 0.001. (C) Kaplan-Meier survival curve after administration of Ad gene therapy. The end point was established at tumor volume of > 1,500 mm3. Data are presented as means ± SD (n=5). *P = 0.003. (D) T-cells at tumor site were isolated at 32 or 42 days post-infusion, and phenotype was analyzed by flow cytometry. (E) Tumor cells were isolated at 32 or 42 days post- HER2.CAR T-cell infusion and were cultured in vitro. Cells were harvested at 72 hrs, and phenotype was analyzed by flow cytometry.
Figure 6
Figure 6. CAd-VECPD-L1 had better anti-tumor effects than systemic PD-L1 IgG treatment
(A) PC-3 cells were transplanted subcutaneously into the right flanks of NSG mice. A total of 1×10⁷ Vp of Onc.Ad or CAd-VEC (Onc.Ad:HDAd; 1:20) were injected intra-tumorally. A total of 1×10⁶ HER2.CAR T-cells expressing ffLuc were systemically administered at 3 days post-injection of Ads. Mice treated with Onc.Ad with HER2.CAR T-cells or HER2.CAR T-cells alone received 3 intraperitoneal injections of 100 μg anti-PD-L1 IgG at day 0, 3 and 6 post-infusion of HER2.CAR T-cells. (B) Tumor volumes were measured at different time points. Data are presented as means ± SD (n=8 or 7). *P < 0.001. (C) Kaplan-Meier survival curve after administration of Ad gene therapy. The end point was established at tumor volume of > 1,500 mm3. Data are presented as means ± SD (n=8 or 7). *P < 0.001. (D) Bioluminescence of HER2.CAR T-cells was monitored at different time points. Data are presented as means ± SD (n=7 or 8). *P = 0.001.

Similar articles

Cited by

References

    1. Lichty BD, Breitbach CJ, Stojdl DF, Bell JC. Going viral with cancer immunotherapy. Nature reviews Cancer. 2014;14:559–67. - PubMed
    1. Bett AJ, Prevec L, Graham FL. Packaging capacity and stability of human adenovirus type 5 vectors. Journal of virology. 1993;67:5911–21. - PMC - PubMed
    1. Cerullo V, Koski A, Vaha-Koskela M, Hemminki A. Chapter eight–Oncolytic adenoviruses for cancer immunotherapy: data from mice, hamsters, and humans. Advances in cancer research. 2012;115:265–318. - PubMed
    1. Farzad L, Cerullo V, Yagyu S, Bertin T, Hemminki A, Rooney C, et al. Combinatorial treatment with oncolytic adenovirus and helper-dependent adenovirus augments adenoviral cancer gene therapy. Molecular Therapy — Oncolytics. 2014;1:14008. - PMC - PubMed
    1. Kershaw MH, Westwood JA, Darcy PK. Gene-engineered T cells for cancer therapy. Nature reviews Cancer. 2013;13:525–41. - PubMed

Publication types

MeSH terms