. 2017 May 1;77(9):2266-2278.
doi: 10.1158/0008-5472.CAN-16-2310. Epub 2017 Feb 24.

Cellular and Molecular Identity of Tumor-Associated Macrophages in Glioblastoma

Affiliations

Cellular and Molecular Identity of Tumor-Associated Macrophages in Glioblastoma

Zhihong Chen et al. Cancer Res. .

Abstract

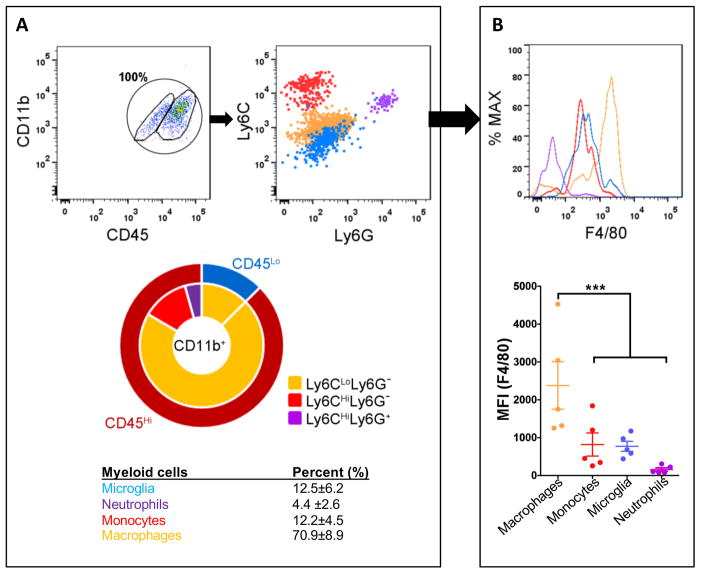
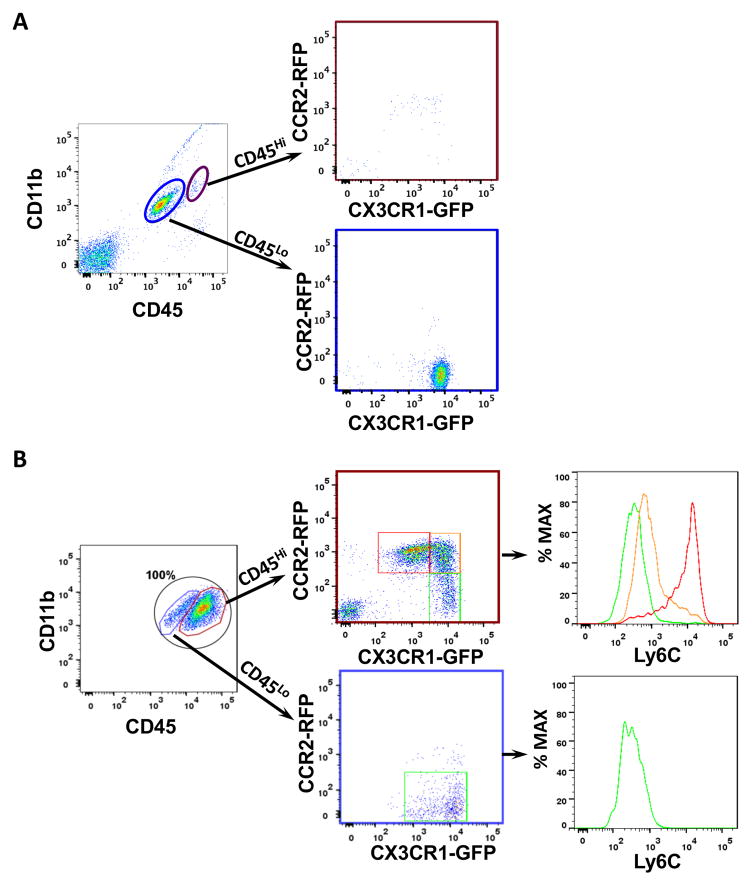
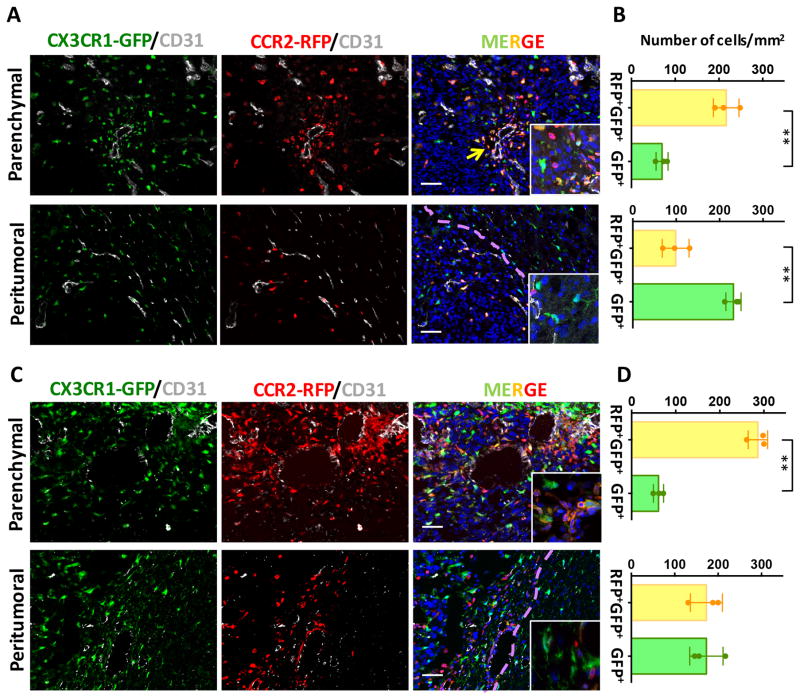
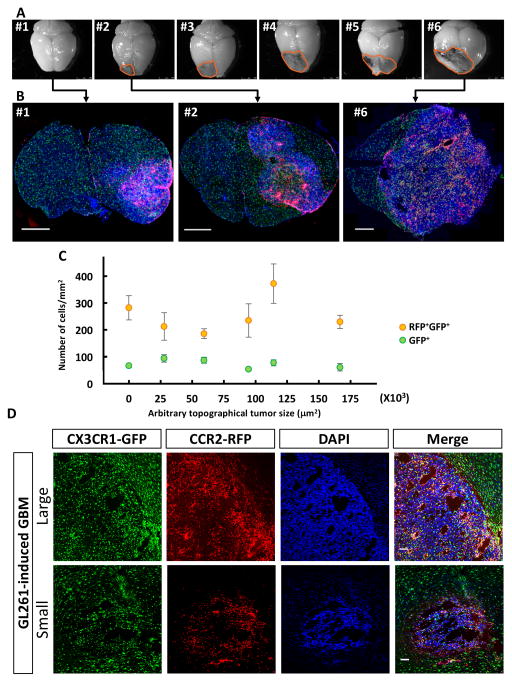
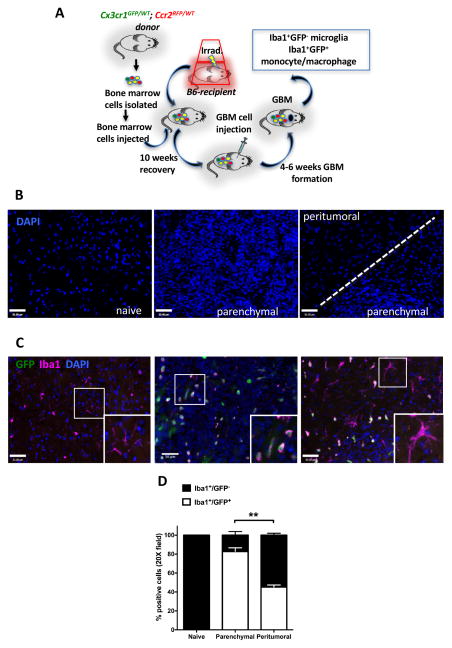
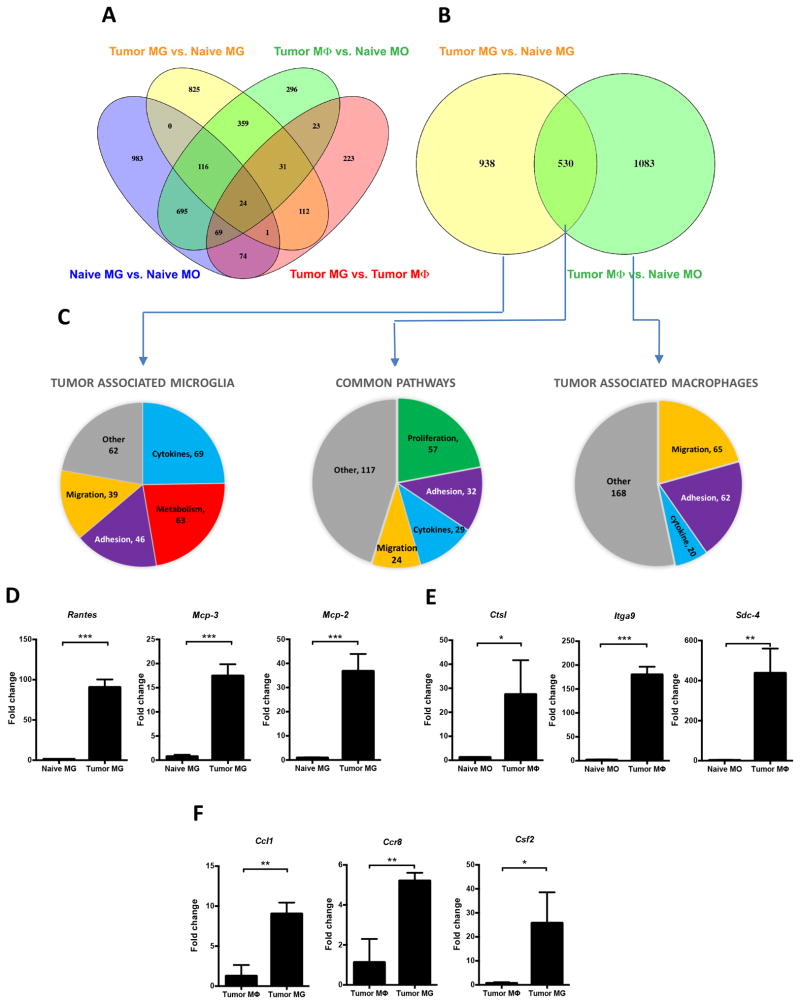
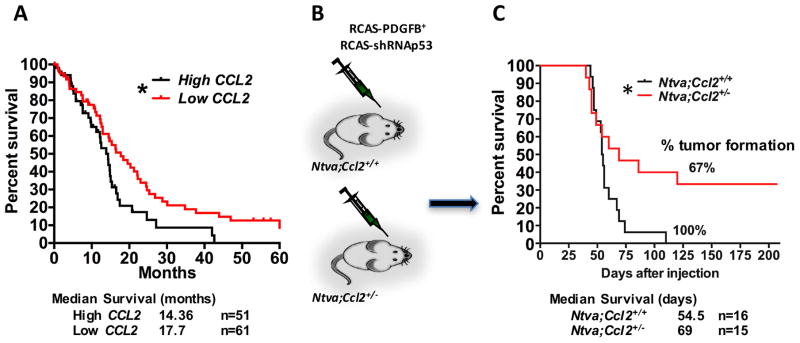
In glioblastoma (GBM), tumor-associated macrophages (TAM) represent up to one half of the cells of the tumor mass, including both infiltrating macrophages and resident brain microglia. In an effort to delineate the temporal and spatial dynamics of TAM composition during gliomagenesis, we used genetically engineered and GL261-induced mouse models in combination with CX3CR1GFP/WT;CCR2RFP/WT double knock-in mice. Using this approach, we demonstrated that CX3CR1LoCCR2Hi monocytes were recruited to the GBM, where they transitioned to CX3CR1HiCCR2Lo macrophages and CX3CR1HiCCR2- microglia-like cells. Infiltrating macrophages/monocytes constituted approximately 85% of the total TAM population, with resident microglia accounting for the approximately 15% remaining. Bone marrow-derived infiltrating macrophages/monocytes were recruited to the tumor early during GBM initiation, where they localized preferentially to perivascular areas. In contrast, resident microglia were localized mainly to peritumoral regions. RNA-sequencing analyses revealed differential gene expression patterns unique to infiltrating and resident cells, suggesting unique functions for each TAM population. Notably, limiting monocyte infiltration via genetic Ccl2 reduction prolonged the survival of tumor-bearing mice. Our findings illuminate the unique composition and functions of infiltrating and resident myeloid cells in GBM, establishing a rationale to target infiltrating cells in this neoplasm. Cancer Res; 77(9); 2266-78. ©2017 AACR.


Conflict of interest statement

The authors declare no Conflict of Interests.

Figures

Figure 1
Figure 1. The majority of TAMs are infiltrating CD45Hi leukocytes from the blood circulation
(A) Representative dot plots gated on the CD11b+CD45+ cells from tumors generated in B6 mice. The total population of CD11b+CD45+ cells is considered to be 100%, with CD11b+CD45Hi (blood-derived monocytes and macrophages) and CD11+CD45Lo (resident brain microglia) populations gated separately. Their expression of Ly6C and Ly6G were analyzed and the percentage of each subpopulation quantified. (B) Quantification of F4/80 intensity for all the subpopulations. N=5. ***P<0.001 by ANOVA.
Figure 2
Figure 2. Cx3cr1GFP/WT;Ccr2RFP/WT knock-in mice distinguish resident microglia from BM-derived macrophages
Representative dot plots gated on CD11b+CD45+ cells from (A) naïve and (B) tumors generated in Cx3cr1GFP/WT;Ccr2RFP/WT mice. (A) Magenta and blue circles delineate the CD11b+CD45Hi (blood-derived monocytes and macrophages) and CD11+CD45Lo (resident brain microglia) populations. Their CX3CR1-GFP and CCR2-RFP profiles are shown. (B) TAMs were identified by their CD11b and CD45 expression, and the CD45Hi and CD45Lo cells are further gated on RFP (CCR2) and GFP (CX3CR1) positivity. The CD45Hi population can be stratified into three related but distinct populations, whose Ly6C expression is examined. The CD45low population (microglia) expressed high level of CX3CR1-GFP, but little to no CCR2-RFP. Quantification of the subpopulations of CD45Hi or CD45Lo myeloid cells are described in the Result. N=3 for naïve mice and N=5 tumor bearing mice.
Figure 3
Figure 3. BM-derived monocyte/macrophages were predominant within the glioblastoma
Brain tumor sections from Cx3cr1GFP/WT;Ccr2RFP/WT mice were visualized with GFP reporter (green), staining with anti-RFP (red) and anti-CD31 (gray) antibodies, and counterstained with DAPI (blue). Representative images demonstrate that the majority of GFP+RFP+ cells are localized in perivascular areas (yellow arrow) within the tumor, whereas in the peritumoral areas the majority myeloid cells are single GFP+ cells (A). (B) Quantification of GFP+RFP+ double positive or GFP+ single positive cells. (C) Immunofluorescence of GFP, RFP and CD31 in and around GL261-induced tumors. (D) Quantification of GFP+RFP+ double positive or GFP+ single positive cells in GL261-induced tumors. Scale bar represents 50 μm. **P<0.01 by t-test. N=3 for each group. Dotted lines mark tumor margin.
Figure 4
Figure 4. Bone marrow-derived cells infiltrate GBM early during initial tumor formation stage
(A) Gross examination of brains dissected from Cx3cr1GFP/WT;Ccr2RFP/WT mice euthanized 25 days after transplantation of tumors isolated form RCAS/Ntva donors. (B) Immunofluorescence of coronal brain sections containing tumors at different stages as manifested by small to large sizes. Scale bar = 1 mm. (C) Quantification of GFP+RFP+ double positive or GFP+ single positive cells inside the tumors. One-way ANOVA test does not detect statistical significance between tumors of various sizes. (D) Representative immunofluorescent sections of large (top) and small (bottom) tumors dissected from GL261 model. Scale bar = 100 μm.
Figure 5
Figure 5. Bone marrow chimerism confirms that the majority TAMs are infiltrating monocyte/macrophages
(A) Schematic illustration of the generation of Cx3cr1GFP/WT;Ccr2RFP/WT bone marrow chimeras in Cx3cr1WT/WT;Ccr2 WT/WT (B6) mice followed by glioblastoma implantation. (B) Representative images of the DAPI staining for normal brain, tumor, and peritumoral regions of glioma-bearing chimeric mice. (C) Immunofluorescent staining for Iba1 (magenta) and endogenous GFP (green) in normal brain tissue or tumors generated in chimeric mice. (D) Quantification of Iba1+ and GFP+ cells within the tumor or in the peritumoral regions. Scale bar represents 50μm. ** P<0.01. N=5 each group.
Figure 6
Figure 6. RNA sequencing analysis identifies unique gene profiles between infiltrating macrophages and resident microglia
(A) Venn diagram showing the number of differentially expressed genes (DEGs) revealed by pairwise comparison (Log2 fold change≥2, P<0.01) between naïve microglia (MG), tumor-associated microglia, naïve monocytes (MO), or tumor-associated macrophages (Mφ). (B) Venn diagram showing the number of DEGs (P≤0.01) between tumor-associated MG or Mφ. (C) Reactome FI Network analysis identified deferential biological functions specifically enriched in tumor-associated microglia, tumor-associated macrophage, or in both populations. Numbers indicate significantly upregulated genes contributing to that specific biological function. Quantitative RT-PCR confirms upregulation of selected molecules identified by RNAseq in either tumor-associated microglia compared to naïve microglia (D), tumor-associated macrophages compared to naïve monocytes (E), and tumor-associated macrophages compared to tumor-associated microglia (F). * P<0.05, ** P<0.01, *** P<0.001 by t-test. N=3 independent samples each group.
Figure 7
Figure 7. Heterogeneous loss of CCL2, the CCR2 ligand, extends survival of glioblastoma bearing mice
(A) Survival curve of GBM patients stratified according to their CCL2 expression queried from the TCGA databank. (B) Diagram illustrating the generation of tumors in Ccl2+/ mice using RCAS/Ntva system. (C) Survival curve of tumor-bearing Ntva+ mice. N is denoted in the figures. * P<0.05 by Mantel-Cox test.

Similar articles

Cited by

References

    1. Becher OJ, Hambardzumyan D, Fomchenko EI, Momota H, Mainwaring L, Bleau AM, et al. Gli activity correlates with tumor grade in platelet-derived growth factor-induced gliomas. Cancer Res. 2008;68:2241–9. - PubMed
    1. Charles NA, Holland EC, Gilbertson R, Glass R, Kettenmann H. The brain tumor microenvironment. Glia. 2012;60:502–14. - PubMed
    1. Simmons GW, Pong WW, Emnett RJ, White CR, Gianino SM, Rodriguez FJ, et al. Neurofibromatosis-1 heterozygosity increases microglia in a spatially and temporally restricted pattern relevant to mouse optic glioma formation and growth. J Neuropathol Exp Neurol. 2011;70:51–62. - PMC - PubMed
    1. Solga AC, Pong WW, Kim KY, Cimino PJ, Toonen JA, Walker J, et al. RNA Sequencing of Tumor-Associated Microglia Reveals Ccl5 as a Stromal Chemokine Critical for Neurofibromatosis-1 Glioma Growth. Neoplasia. 2015;17:776–88. - PMC - PubMed
    1. Hambardzumyan D, Gutmann DH, Kettenmann H. The role of microglia and macrophages in glioma maintenance and progression. Nat Neurosci. 2016;19:20–7. - PMC - PubMed

Publication types

LinkOut - more resources