

Proteome and Secretome Analysis Reveals Differential Post-transcriptional Regulation of Toll-like Receptor Responses
- PMID: 28235783
- PMCID: PMC5393387
- DOI: 10.1074/mcp.M116.064261
Proteome and Secretome Analysis Reveals Differential Post-transcriptional Regulation of Toll-like Receptor Responses
Abstract
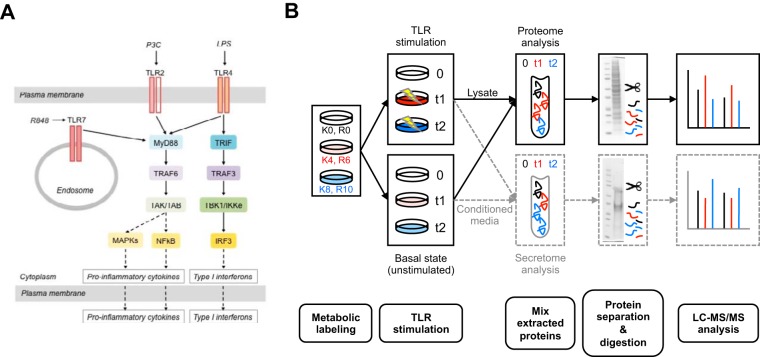
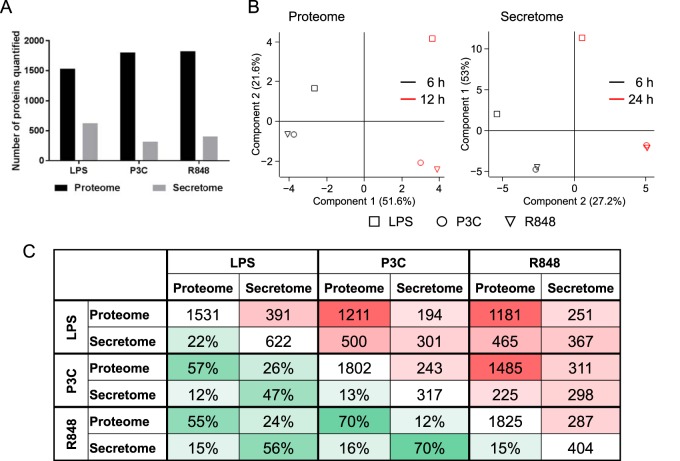
The innate immune system is the organism's first line of defense against pathogens. Pattern recognition receptors (PRRs) are responsible for sensing the presence of pathogen-associated molecules. The prototypic PRRs, the membrane-bound receptors of the Toll-like receptor (TLR) family, recognize pathogen-associated molecular patterns (PAMPs) and initiate an innate immune response through signaling pathways that depend on the adaptor molecules MyD88 and TRIF. Deciphering the differences in the complex signaling events that lead to pathogen recognition and initiation of the correct response remains challenging. Here we report the discovery of temporal changes in the protein signaling components involved in innate immunity. Using an integrated strategy combining unbiased proteomics, transcriptomics and macrophage stimulations with three different PAMPs, we identified differences in signaling between individual TLRs and revealed specifics of pathway regulation at the protein level.
© 2017 by The American Society for Biochemistry and Molecular Biology, Inc.
Conflict of interest statement
Authors declare no conflict of interest
Figures
Similar articles
-
Host-pathogen dynamics through targeted secretome analysis of stimulated macrophages.J Proteomics. 2018 Oct 30;189:34-38. doi: 10.1016/j.jprot.2018.03.016. Epub 2018 Mar 20. J Proteomics. 2018. PMID: 29572161 Free PMC article.
-
Decoding Toll-like receptors: Recent insights and perspectives in innate immunity.Immunity. 2024 Apr 9;57(4):649-673. doi: 10.1016/j.immuni.2024.03.004. Immunity. 2024. PMID: 38599164 Review.
-
Mechanisms and pathways of innate immune activation and regulation in health and cancer.Hum Vaccin Immunother. 2014;10(11):3270-85. doi: 10.4161/21645515.2014.979640. Hum Vaccin Immunother. 2014. PMID: 25625930 Free PMC article. Review.
-
Toll-like receptors in innate immunity and infectious diseases.Front Med China. 2010 Dec;4(4):385-93. doi: 10.1007/s11684-010-0600-x. Epub 2010 Dec 2. Front Med China. 2010. PMID: 21136206 Review.
-
Toll-like receptors.Curr Protoc Immunol. 2015 Apr 1;109:14.12.1-14.12.10. doi: 10.1002/0471142735.im1412s109. Curr Protoc Immunol. 2015. PMID: 25845562
Cited by
-
Exoproteomics for Better Understanding Pseudomonas aeruginosa Virulence.Toxins (Basel). 2020 Sep 4;12(9):571. doi: 10.3390/toxins12090571. Toxins (Basel). 2020. PMID: 32899849 Free PMC article. Review.
-
Absolute protein quantitation of the mouse macrophage Toll-like receptor and chemotaxis pathways.Sci Data. 2022 Aug 12;9(1):491. doi: 10.1038/s41597-022-01612-y. Sci Data. 2022. PMID: 35961990 Free PMC article.
-
Species-Specific Endotoxin Stimulus Determines Toll-Like Receptor 4- and Caspase 11-Mediated Pathway Activation Characteristics.mSystems. 2021 Aug 31;6(4):e0030621. doi: 10.1128/mSystems.00306-21. Epub 2021 Aug 3. mSystems. 2021. PMID: 34342534 Free PMC article.
-
LPS Tolerance Inhibits Cellular Respiration and Induces Global Changes in the Macrophage Secretome.Biomolecules. 2021 Jan 27;11(2):164. doi: 10.3390/biom11020164. Biomolecules. 2021. PMID: 33513762 Free PMC article.
-
Damage of the Bone Marrow Stromal Precursors in Patients with Acute Leukemia at the Onset of the Disease and During Treatment.Int J Mol Sci. 2024 Dec 11;25(24):13285. doi: 10.3390/ijms252413285. Int J Mol Sci. 2024. PMID: 39769050 Free PMC article.
References
-
- Takeuchi O., and Akira S. (2010) Pattern recognition receptors and inflammation. Cell 140, 805–820 - PubMed
-
- Kawai T., and Akira S. (2005) Pathogen recognition with Toll-like receptors. Curr. Opin. Immunol. 17, 338–344 - PubMed
-
- Kang J. Y., and Lee J. O. (2011) Structural biology of the Toll-like receptor family. Annu. Rev. Biochem. 80, 917–941 - PubMed
MeSH terms
Substances
LinkOut - more resources
Full Text Sources
Other Literature Sources
Molecular Biology Databases
