. 2017 Mar 14;114(11):E2156-E2165.
doi: 10.1073/pnas.1610414114. Epub 2017 Feb 24.

Localization of the gate and selectivity filter of the full-length P2X7 receptor

Affiliations

Localization of the gate and selectivity filter of the full-length P2X7 receptor

Anja Pippel et al. Proc Natl Acad Sci U S A. .

Abstract

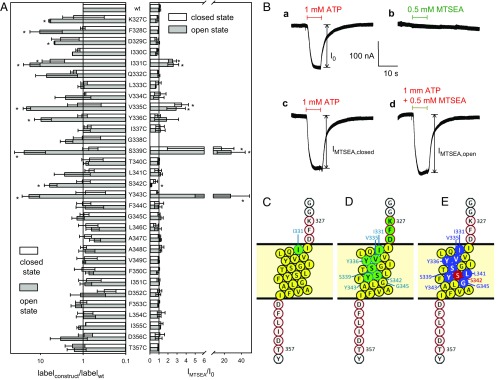
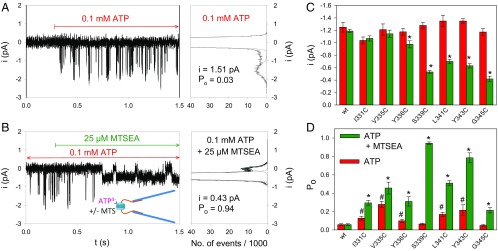
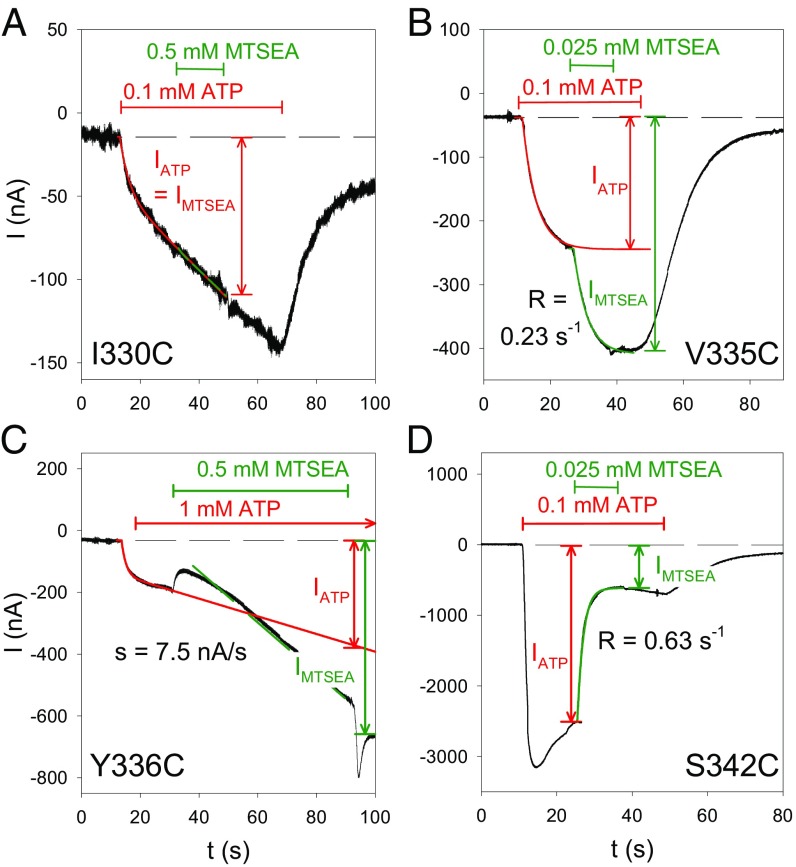
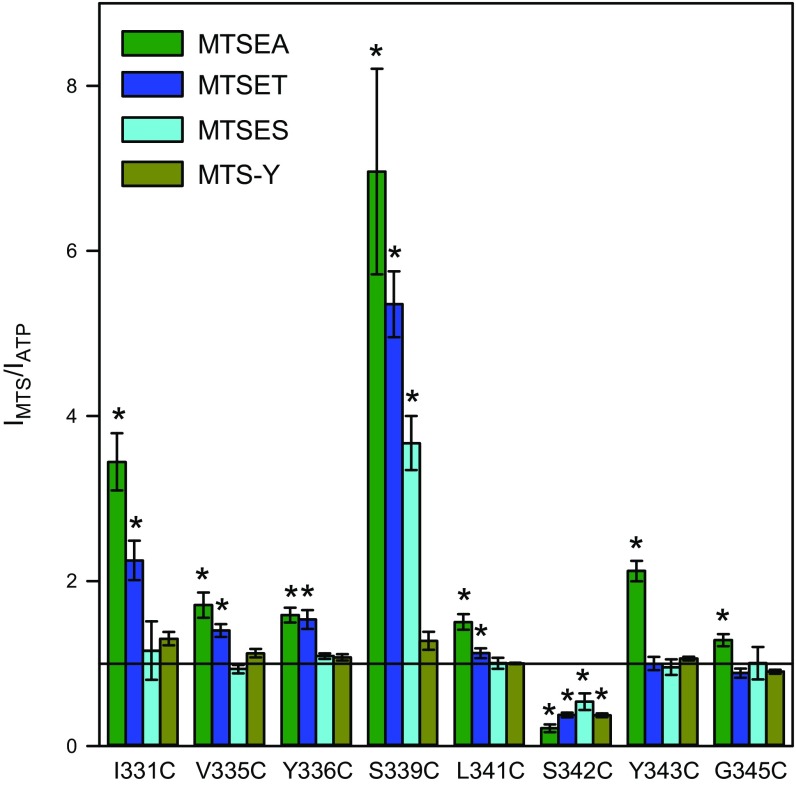
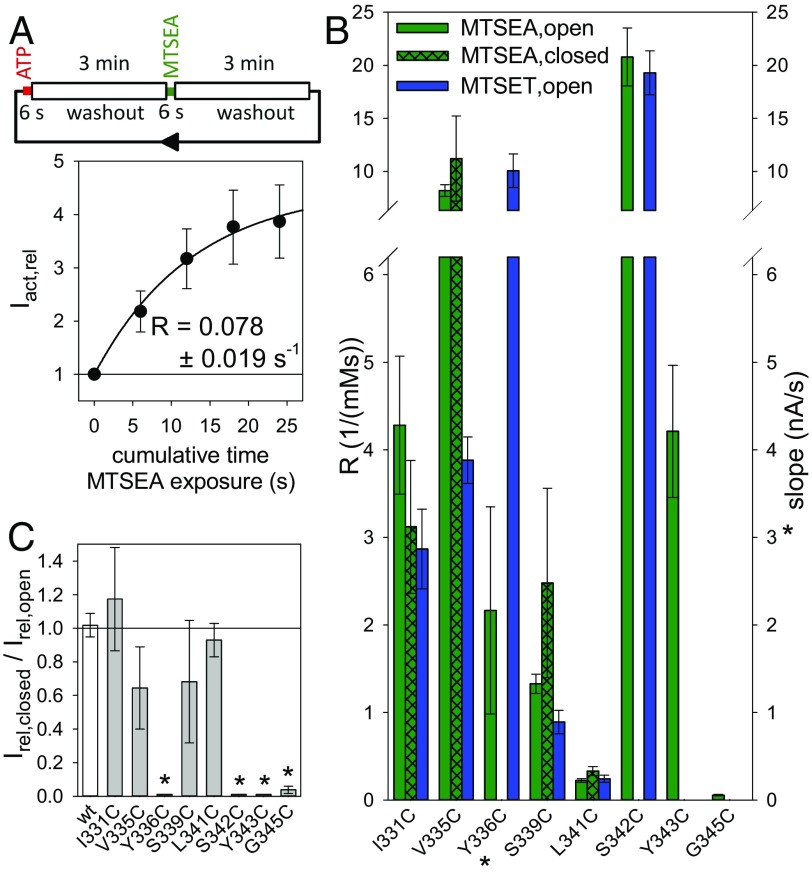
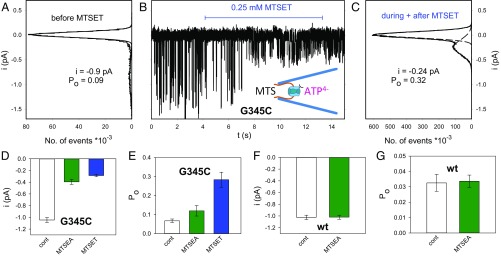
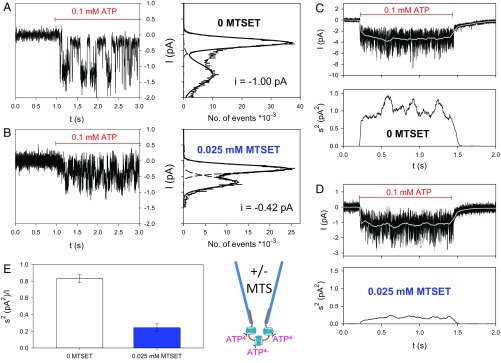
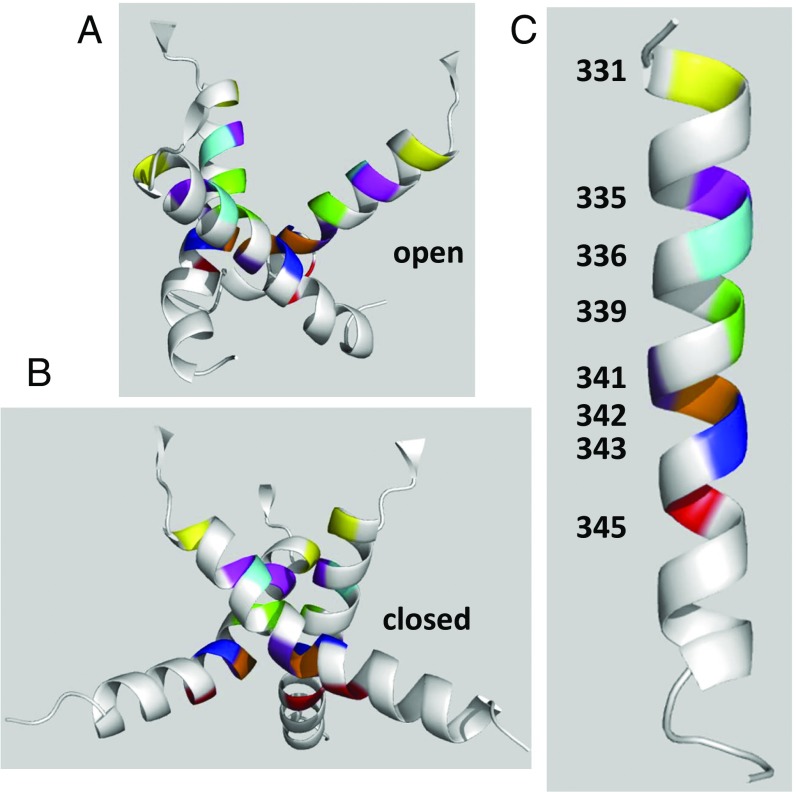
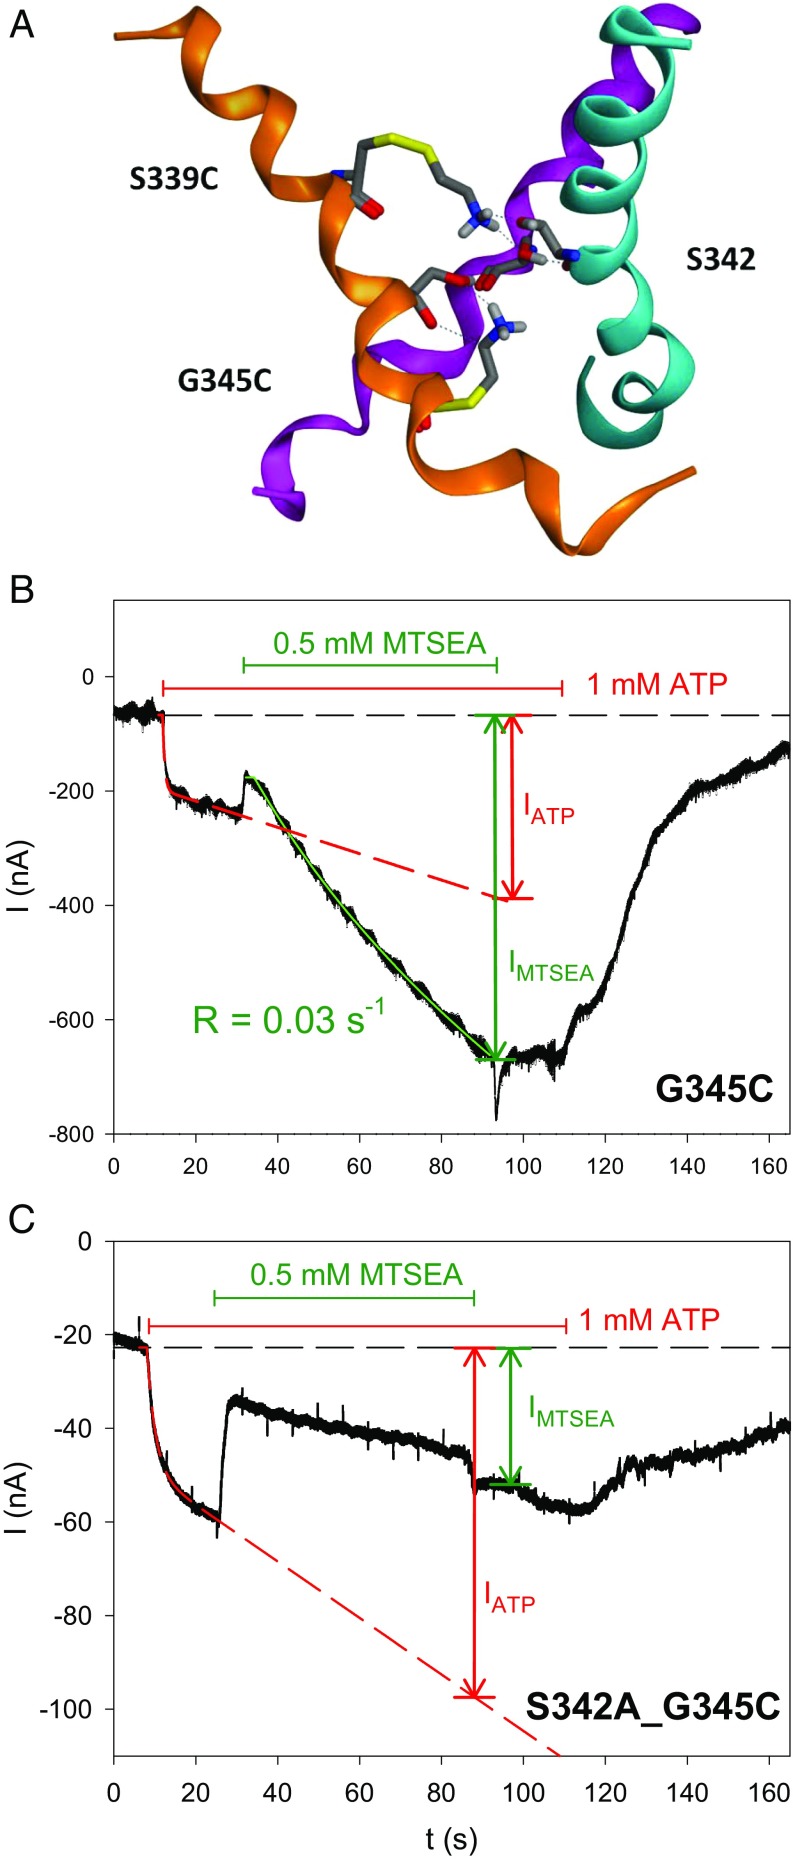
The P2X7 receptor (P2X7R) belongs to the P2X family of ATP-gated cation channels. P2X7Rs are expressed in epithelial cells, leukocytes, and microglia, and they play important roles in immunological and inflammatory processes. P2X7Rs are obligate homotrimers, with each subunit having two transmembrane helices, TM1 and TM2. Structural and functional data regarding the P2X2 and P2X4 receptors indicate that the central trihelical TM2 bundle forms the intrinsic transmembrane channel of P2X receptors. Here, we studied the accessibility of single cysteines substituted along the pre-TM2 and TM2 helix (residues 327-357) of the P2X7R using as readouts (i) the covalent maleimide fluorescence accessibility of the surface-bound P2X7R and (ii) covalent modulation of macroscopic and single-channel currents using extracellularly and intracellularly applied methanethiosulfonate (MTS) reagents. We found that the channel opening extends from the pre-TM2 region through the outer half of the trihelical TM2 channel. Covalently adducted MTS ethylammonium+ (MTSEA+) strongly increased the probability that the channel was open by delaying channel closing of seven of eight responsive human P2X7R (hP2X7R) mutants. Structural modeling, as supported by experimental probing, suggested that resulting intraluminal hydrogen bonding interactions stabilize the open-channel state. The additional decrease in single-channel conductance by MTSEA+ in five of seven positions identified Y336, S339, L341C, Y343, and G345 as the narrowest part of the channel lumen. The gate and ion-selectivity filter of the P2X7R could be colocalized at and around residue S342. None of our results provided any evidence for dilation of the hP2X7R channel on sustained stimulation with ATP4.

Keywords: P2X7 receptor; P2X7 receptor homology model; cysteine-scanning accessibility mutagenesis; single-channel conductance; single-channel open probability.


Conflict of interest statement

The authors declare no conflict of interest.

Figures

Fig. 1.
Fig. 1.
Biochemical and TEVC screening for the accessibility of single-cysteine substitutions in the TM2 of the closed and ATP4−-opened hP2X7R. (A, Left) Bars show the normalized means of the Cy5 fluorescence bound via maleimide chemistry to extracellularly accessible cysteine residues in the absence and presence of 1 mM ATP4−, respectively, as normalized to the surface expression of the respective hP2X7R mutant (as assessed by lysine-bound Alexa Fluor 488 fluorescence). The specifically bound fluorescence levels were quantified through in-gel fluorescence scanning of the immunoprecipitated and SDS/PAGE-resolved mutants. (Right) State-dependent effect of MTSEA+ (0.5 mM) on the 1 mM ATP4−-elicited TEVC currents of the indicated SCAM mutant. Open and solid bars represent the means (n = 6–13 oocytes) of IMTSEA,closed and IMTSEA,open, respectively, normalized to the I0 of the corresponding hP2X7R construct. Means significantly different from 1 are marked by an asterisk. (B) The original hP2X7RI331C current traces illustrate the principle of the recordings: (a) response I0 to ATP4− without any MTSEA+; (b), response of the closed hP2X7R to MTSEA+; (c) response IMTSEA,closed to ATP4− following MTSEA+ preincubation; and (d) response IMTSEA,open to coapplied ATP4− and MTSEA+. (C–E) The TM2 helix of the hP2X7R (presented as extending from I330 to I351, filled yellow circles) and the red-framed flanking residues were individually mutated to cysteine. Residues of the apo-closed hP2X7R (C) and the ATP4−-activated open hP2X7R (D and E) are colored according to their accessibility (in the cysteine-substituted form) to Cy5 maleimide in the biochemical experiments (green) or functional modulation by MTSEA+ in electrophysiological experiments (blue and red, indicating current inhibition and stimulation, respectively). The ATP4−-triggered accessibility of single cysteines engineered in pre-TM2 positions (327K, 328F, and 329D) could be identified only biochemically. The TM2 segments were drawn using Protter at wlab.ethz.ch/protter/# (46).
Fig. 2.
Fig. 2.
Single-channel analysis of MTSEA+ modifications in hP2X7R SCAM mutants. (A and B) Representative single-channel recordings (Left) and corresponding amplitude histograms (Right) from outside-out patches excised from an oocyte expressing hP2X7RS339C. Single-channel currents were recorded following activation by 0.1 mM ATP4− alone (A) or by coapplication of 0.1 mM ATP4− and 0.025 mM MTSEA+ (B). The indicated single-channel current amplitudes and the mean open probabilities were determined by fitting two Gaussian distributions to the data. (Right) Statistical comparisons of single-channel amplitudes (C) and open probabilities (D) determined during application of ATP4− alone (red bars) or during coapplication of ATP4− and MTSEA+ (green bars). Each bar represents the means of 6–30 patches. The hashes indicate significant differences from hP2X7Rwt, resulting from the indicated cysteine substitution. The observed Po changes may reflect small structural changes resulting from the cysteine substitutions and are not due to a decreased EC50 for ATP4−, which was significantly diminished compared with the WT for only one mutant, hP2X7RY336C (concentration–response curves in SI Appendix, Fig. S8). Asterisks indicate significant differences between the means with and without MTS.
Fig. 3.
Fig. 3.
Time course of MTSEA+ modification for various hP2X7R SCAM mutants. Shown are representative TEVC current traces that were recorded from oocytes expressing the indicated hP2X7R mutant before, during, and after exposure to ATP4− and MTSEA+, as indicated. The specific mutants were selected to exemplify distinct current modifications by MTSEA+ in the ATP4−-induced open state as follows: (A) no current modification, (B) fast stimulation, (C) slow stimulation, and (D) inhibition. The time courses of the indicated current components IATP and IMTSEA were fitted by the sum of an exponentially saturating increase and a linear component (33), as indicated by the overlaid lines. In AC, the current component IATP was extrapolated to the end of the MTSEA+ application. The R in B and C represents the rate constant of the MTSEA+ effect; s in C denotes the slope of the MTSEA+-induced current. We attribute the current deflections at the start and the end of the MTSEA+ application in C to unspecific blocking and unblocking, respectively, of the hP2X7Y336C-mediated current by MTSEA+.
Fig. 4.
Fig. 4.
Normalized effects of chemically diverse MTS reagents on ATP4−-induced currents of hP2X7R SCAM mutants. The TEVC current components IATP and IMTS were determined as illustrated in Fig. 3 B–D. Bars represent the means from 6 to 12 oocytes. A relative effect size of 1 (horizontal line) indicates that the current was not influenced by the MTS reagent. Asterisks indicate significant difference from 1. Because most of the MTS-modified cysteines are situated within the electrical field of the membrane (SI Appendix, Fig. S10), the cationic MTSEA+ and MTSET+ and the anionic MTSES were applied at holding potentials of −40 mV and +20 mV, respectively, to provide an inwardly directed electrochemical driving force for all three charged reagents. The uncharged MTS-Y was applied at a holding potential of −40 mV. The concentrations of ATP4− and MTS reagents used here are included in SI Appendix, Table S1.
Fig. 5.
Fig. 5.
MTS modification rates of hP2X7R SCAM mutants from the extracellular side. (A) The dependence of the ATP4−-induced TEVC current on the cumulative time of exposure of the closed-state hP2X7RI331C to MTSEA+. (Top) Schematic illustratration of one cycle of exposures for an hP2X7RI331C-expressing oocyte to a 6-s lasting test pulse of 0.1 mM ATP4−, followed by ATP4− washout, a 6-s exposure to 0.25 mM MTSEA+, and finally washout of the MTSEA+ before the next test pulse of ATP4− is applied. The time interval between the ATP4− or MTSEA+ applications was 3 min. The ATP4−-elicited current amplitudes following each exposure to MTSEA+ in the closed state (IMTSEA,closed) were normalized to the current amplitude induced by the first test pulse of ATP4− (at t = 0 s, i.e., before MTSEA+ application, IATP,0) to yield Iact,rel = IMTSEA,closed/IATP,0. The constant for the modification rate R of the closed channel by MTSEA+ was obtained by fitting an exponentially saturating function (represented by the solid line) to the data. Data points are the means ± SEM of 8 oocytes from two different batches. (B) Statistical comparison of the modification rate constants for the indicated hP2X7R channel state by MTSEA+ and MTSET+. The rate constants R (Left ordinate) in the open and closed states were determined as illustrated in Fig. 3 B or D and in A, respectively. The modification rate at Y336C is represented by the slope s (*, Right ordinate), which was determined as shown in Fig. 3C. Bars represent the means ± SEM of 6–12 oocytes. (C) State dependence of MTSEA+ modification. To assess the extent of the MTSEA+ modification on the closed channel, the current amplitude induced by the fourth ATP4− test pulse (i.e., following an 18-s cumulative MTSEA+ exposure) was normalized to the amplitude of the first ATP4− test pulse, as shown in A, to yield Irel,closed = Iact,rel(18 s)/Iact,rel(0 s) − 1. Irel,closed was then normalized to the relative effect of MTSEA+ on the current amplitude of the corresponding open state, Irel,open, which is equal to IMTSEA/IATP − 1 (taken from Fig. 4, green bars), i.e., Irel,closed/Irel,open = (Iact,rel(18 s)/Iact,rel(0 s) − 1)/(IMTSEA/IATP − 1). The values for the mutants Y336C, S342C, and Y343C were set to 0 because the ATP4−-induced currents decreased slightly with repeated ATP4− applications. This decrease was not significantly influenced by the continued presence of MTSEA+ between the ATP4− applications, thus indicating no effect of MTSEA+ in the closed-channel configuration. Means are shown of 6–14 oocytes. Asterisks denote means significantly different from 1.
Fig. 6.
Fig. 6.
hP2X7RG345C single-channel modifications by MTS reagents bath applied to the intracellular side of inside-out patches. (A–C) The representative current trace in B was recorded from an inside-out patch excised with a patch pipette containing 0.1 mM ATP4− to open the expressed hP2X7RG335C channel. The onset and duration of the bath application of MTSET+ to the intracellular site of the inside-out patch is indicated by the horizontal bar. The single-channel current amplitudes and open probabilities were extracted from the amplitude histograms of the ATP4−-induced single-channel events recorded before exposure to MTSET+ (A) and during and after exposure to MTSET+ (C). (D–G) The same experiments as indicated in A–C were also conducted with MTSET+ for the hP2X7RG345C mutant and MTSEA+ for the hP2X7Rwt. Following MTSEA+ or MTSET+ exposure in the hP2X7RG345C mutant, the derived single-channel amplitudes and the open-channel probabilities were significantly different from the nonexposed controls (D and E). In contrast, MTSEA+/− exposure did not modify hP2X7Rwt (F and G). Bars represent the means of 6–26 oocyte patches.
Fig. 7.
Fig. 7.
hP2X7RG345C single-channel modifications by MTS reagents that were pipette applied to the intracellular side of outside-out patches. (A and B) The representative current traces were recorded from inside-out patches excised from hP2X7RG335C-expressing oocytes without MTSET+ (A) and with 0.025 mM MTSET+ (B) in the patch pipette. The horizontal bar indicates the period of ATP4− application. The corresponding single-channel currents were calculated from the adjacent amplitude histograms. (C–E) Effect of intracellularly applied MTSET+ on current noise kinetics. Shown are original traces recorded with pipette solutions without MTSET+ (C) or with 0.025 mM MTSET+ (D). The running average current Irunavg is shown as a white line. The corresponding time-dependent smoothed noise σ2runavg is shown in the adjacent panels. (E) Statistics for the relative noise (σ2/Imean,500) of the first 500 ms during the very first ATP4− application. The means from 16 and 7 patches excised without and with MTSET+ in the pipette, respectively, are significantly different. For details, see SI Appendix, SI Materials and Methods.
Fig. 8.
Fig. 8.
Homology models of the pore-forming trihelical TM2 bundle of the hP2X7R. The ribbon diagrams were generated using PyMOL 1.3 (www.pymol.org). All of the residues that were functionally modified by MTSEA+ when mutated to cysteine are colored with the same individual color. (A and B) Ribbon diagrams of the open and closed states of the hP2X7R channel (side views, extracellular side at top), derived from our hP2X7R homology models based on the apo and ATP4−-bound X-ray structures of the ΔzfP2X4-C (22). (C) Schematic indications of the localizations of the functionally modified residues of the hP2X7R channel along one TM2 helix (from residue I331 to I351), as determined by SCAM analyses. The kink in the middle of the helix is oriented toward the viewer and therefore not visible.
Fig. 9.
Fig. 9.
Predicted hydrogen-bond interactions of cysteine-adducted MTSEA+ with gating residue S342. (A) Ribbon diagram of the ATP4− open state of the TM2 channel (side view, extracellular at Top) of our hP2X7R homology model, with each TM2 helix in a distinct color for easier identification. Stick representations (carbon in gray, amide and MTSEA+ nitrogens in blue, carbonyl oxygens in red, sulfurs in yellow) of (i) the S342 of each helix and (ii) S339C and G345C with cysteine-adducted MTSEA+ (of one helix only for clarity). The hydrogen atoms of the amino head group from MTSEA+ form hydrogen bonds to side-chain hydroxyl oxygens and backbone carbonyl oxygens of S342. These MTSEA+-mediated hydrogen bonds stabilize the open state of the hP2X7R channels, thus explaining the experimentally observed higher open-channel probability and the resulting potentiation of macroscopic currents. (B and C) Representative TEVC current traces. MTSEA+ stimulated the linearly increasing current component of the ATP4−-activated hP2X7RG345C mutant (B). Elimination of the hydroxyl group at S342, as realized in the hP2X7RS342A,G345C double mutant, reversed the MTSEA+ effect from stimulation to inhibition (C).

References

    1. Cockcroft S, Gomperts BD. ATP induces nucleotide permeability in rat mast cells. Nature. 1979;279(5713):541–542. - PubMed
    1. Gordon JL. Extracellular ATP: Effects, sources and fate. Biochem J. 1986;233(2):309–319. - PMC - PubMed
    1. Di Virgilio F. The P2Z purinoceptor: An intriguing role in immunity, inflammation and cell death. Immunol Today. 1995;16(11):524–528. - PubMed
    1. Rassendren F, et al. The permeabilizing ATP receptor, P2X7. Cloning and expression of a human cDNA. J Biol Chem. 1997;272(9):5482–5486. - PubMed
    1. Surprenant A, Rassendren F, Kawashima E, North RA, Buell G. The cytolytic P2Z receptor for extracellular ATP identified as a P2X receptor (P2X7) Science. 1996;272(5262):735–738. - PubMed

Publication types

MeSH terms

LinkOut - more resources