. 2017 Apr;173(4):2081-2095.
doi: 10.1104/pp.16.01865. Epub 2017 Feb 24.

Two Acyltransferases Contribute Differently to Linolenic Acid Levels in Seed Oil

Affiliations

Two Acyltransferases Contribute Differently to Linolenic Acid Levels in Seed Oil

Sofia Marmon et al. Plant Physiol. 2017 Apr.

Abstract

Acyltransferases are key contributors to triacylglycerol (TAG) synthesis and, thus, are of great importance for seed oil quality. The effects of increased or decreased expression of ACYL-COENZYME A:DIACYLGLYCEROL ACYLTRANSFERASE1 (DGAT1) or PHOSPHOLIPID:DIACYLGLYCEROL ACYLTRANSFERASE (PDAT) on seed lipid composition were assessed in several Camelina sativa lines. Furthermore, in vitro assays of acyltransferases in microsomal fractions prepared from developing seeds of some of these lines were performed. Decreased expression of DGAT1 led to an increased percentage of 18:3n-3 without any change in total lipid content of the seed. The tri-18:3 TAG increase occurred predominantly in the cotyledon, as determined with matrix-assisted laser desorption/ionization-mass spectrometry, whereas species with two 18:3n-3 acyl groups were elevated in both cotyledon and embryonal axis. PDAT overexpression led to a relative increase of 18:2n-6 at the expense of 18:3n-3, also without affecting the total lipid content. Differential distributions of TAG species also were observed in different parts of the seed. The microsomal assays revealed that C.sativa seeds have very high activity of diacylglycerol-phosphatidylcholine interconversion. The combination of analytical and biochemical data suggests that the higher 18:2n-6 content in the seed oil of the PDAT overexpressors is due to the channeling of fatty acids from phosphatidylcholine into TAG before being desaturated to 18:3n-3, caused by the high activity of PDAT in general and by PDAT specificity for 18:2n-6. The higher levels of 18:3n-3 in DGAT1-silencing lines are likely due to the compensatory activity of a TAG-synthesizing enzyme with specificity for this acyl group and more desaturation of acyl groups occurring on phosphatidylcholine.


Figures

Figure 1.
Figure 1.
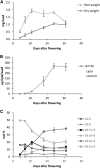
Development of C. sativa seeds. A, Weight of the seeds in milligrams. B, Number of lipids per seed. C, Relative amount of major fatty acids at different days after flowering (DAF).
Figure 2.
Figure 2.
Overview of the TAG synthesis pathway and the change of relative major lipid species during seed development. A, Overview of the main steps of the TAG biosynthesis pathway of oilseeds. Enzymes are shown in boldface, and cellular compartments are underlined. Lipid species abbreviations are as follows: DAG, diacylglycerol; FA, fatty acid; G3P, glycerol-3-phosphate; LPA, lysophosphatidic acid; LPC, lysosphosphatidylcholine; PA, phosphatidic acid. Enzyme abbreviations are as follows: LPCAT, acyl-CoA:lysophosphatidylcholine acyltransferase; PDCT, phosphatidylcholine:diacylgycerol cholinephosphotransferase. B, Relative amounts of specific lipid species at four time points. Relative amount is determined within each lipid class. Molecular species were determined by ultra-performance liquid chromatography-nano-electrospray ionization (ESI)-tandem mass spectrometry (MS/MS), except PA which was measured by direct-infusion nano-ESI-MS/MS. C, Trends of the relative amounts of specific lipid species during seed development. The symbol > corresponds to lipid species with a declining trend over development, whereas < indicates lipid species with an increasing trend over development; > < denotes decrease followed by increase, and < > indicates increase followed by decrease. Note that the sn position is not determined.
Figure 3.
Figure 3.
Relative amounts of major fatty acids (mol %) in different C. sativa seeds. A, Seeds are T2 and a mixture of single and multiple insertion lines. Shown are average values ± sd. Number of lines = 7 to 11, and repetitions of measurements = 3. B, Seeds are from single-insertion homozygous lines. Shown are average values ± sd; n = 3. Asterisks indicate significant differences: *, P < 0.05; **, P < 0.01; and ***, P < 0.001, compared with the control sample as analyzed by one-way ANOVA followed by Tukey’s test.
Figure 4.
Figure 4.
Time course of relative amounts of acylated compounds in C. sativa developing seed microsomal preparations after feeding with [14C]G3P and the corresponding acyl-CoA. Different microsomal preparations are shown in different rows: control (A), amiDGAT1.2 (B), and PDAT + amiDGAT1.2 (C). Each column corresponds to feeding with the indicated acyl-CoA. Shown are mean values and sd; n = 3. Assay conditions are described in “Materials and Methods.”
Figure 5.
Figure 5.
Lipid classes from C. sativa microsomal preparations fed with [14C]acyl-CoA mix. Microsomal preparations were fed nonradioactive G3P and a mixture of equal amounts (17 nmol each) of 14C-radiolabeled 18:1-CoA, 18:2-CoA, and 18:3-CoA for 160 min. Relative amounts of radioactivity are shown in % (of cpm). PC* also contains minor amounts of LPC. Shown are mean values and sd; n = 3. Assay conditions are described in “Materials and Methods.”
Figure 6.
Figure 6.
Drawing of a C. sativa seed section. Marked are the outer and inner cotyledon, the embryonic axis, the endosperm, and the seed coat.
Figure 7.
Figure 7.
Spatial distribution of TAG species as determined by MALDI-MS. Images are representative of seed sections that were analyzed in triplicate (three different seeds). A, Control. B, amiDGAT1.3. C, PDAT+amiDGAT1.2. D, amiPDAT.3. Scale bars represent mol %; bars in bright-field images = 200 µm.
Figure 8.
Figure 8.
Spatial distribution of PC species as determined by MALDI-MS. Images are representative of seed sections that were analyzed in triplicate (three different seeds). A, Control. B, amiDGAT1.3. C, PDAT+amiDGAT1.2. D, amiPDAT.3. Scale bars represent mol %; bars in bright-field images = 200 µm.
Figure 9.
Figure 9.
Lipid profiles of DGAT and PDAT mutants from ESI-MS. A, TAG species. B, PC species. Shown are mean values and sd of triplicate assays. Asterisks indicate significant differences: *, P < 0.05; **, P < 0.01; and ***, P < 0.001, compared with the control sample as analyzed by one-way ANOVA followed by Tukey’s test.

Similar articles

Cited by

References

    1. Abdullah HM, Akbari P, Paulose B, Schnell D, Qi W, Park Y, Pareek A, Dhankher OP (2016) Transcriptome profiling of Camelina sativa to identify genes involved in triacylglycerol biosynthesis and accumulation in the developing seeds. Biotechnol Biofuels 9: 136. - PMC - PubMed
    1. Bafor M, Smith MA, Jonsson L, Stobart K, Stymne S (1991) Ricinoleic acid biosynthesis and triacylglycerol assembly in microsomal preparations from developing castor-bean (Ricinus communis) endosperm. Biochem J 280: 507–514 - PMC - PubMed
    1. Banas W, Carlsson AS, Banas A (2014) Effect of overexpression of PDAT gene on Arabidopsis growth rate and seed oil content. J Agric Sci 6: 65
    1. Bansal S, Durrett TP (2016) Camelina sativa: an ideal platform for the metabolic engineering and field production of industrial lipids. Biochimie 120: 9–16 - PubMed
    1. Bates PD, Browse J (2011) The pathway of triacylglycerol synthesis through phosphatidylcholine in Arabidopsis produces a bottleneck for the accumulation of unusual fatty acids in transgenic seeds. Plant J 68: 387–399 - PubMed

Publication types

MeSH terms

LinkOut - more resources