Gene expression signature for early prediction of late occurring pancytopenia in irradiated baboons
- PMID: 28236054
- PMCID: PMC5371629
- DOI: 10.1007/s00277-017-2952-7
Gene expression signature for early prediction of late occurring pancytopenia in irradiated baboons
Abstract
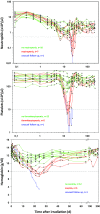
Based on gene expression changes measured in the peripheral blood within the first 2 days after irradiation, we predicted a pancytopenia in a baboon model. Eighteen baboons were irradiated with 2.5 or 5 Gy. According to changes in blood cell counts, the surviving baboons (n = 17) exhibited a hematological acute radiation syndrome (HARS) either with or without a pancytopenia. We used a two stage study design where stage I was a whole genome screen (microarrays) for mRNA combined with a qRT-PCR platform for simultaneous detection of 667 miRNAs using a part of the samples. Candidate mRNAs and miRNAs differentially upregulated or downregulated (>2-fold, p < 0.05) during the first 2 days after irradiation were chosen for validation in stage II using the remaining samples and using throughout more sensitive qRT-PCR. We detected about twice as many upregulated (mean 2128) than downregulated genes (mean 789) in baboons developing an HARS either with or without a pancytopenia. From 51 candidate mRNAs altogether, 11 mRNAs were validated using qRT-PCR. These mRNAs showed only significant differences between HARS groups and H0, but not between HARS groups with and without pancytopenia. Six miRNA species (e.g., miR-574-3p, p = 0.009, ROC = 0.94) revealed significant gene expression differences between HARS groups with and without pancytopenia and are known to sensitize irradiated cells. Hence, in particular, the newly identified miRNA species for prediction of pancytopenia will support the medical management decision making.
Keywords: Gene expression; Hematological acute radiation syndrome (HARS); Pancytopenia; miRNA.
Conflict of interest statement
Funding
This work was supported by both the French and the German Ministry of Defense.
Conflict of interest
The authors declare that they have no conflict of interest.
Ethical approval
All applicable international, national, and/or institutional guidelines for the care and use of animals were followed. All procedures performed in studies involving animals were in accordance with the ethical standards of the institution or practice at which the studies were conducted.
Figures


Similar articles
-
MicroRNA Expression for Early Prediction of Late Occurring Hematologic Acute Radiation Syndrome in Baboons.PLoS One. 2016 Nov 15;11(11):e0165307. doi: 10.1371/journal.pone.0165307. eCollection 2016. PLoS One. 2016. PMID: 27846229 Free PMC article.
-
Pre-Exposure Gene Expression in Baboons with and without Pancytopenia after Radiation Exposure.Int J Mol Sci. 2017 Mar 2;18(3):541. doi: 10.3390/ijms18030541. Int J Mol Sci. 2017. PMID: 28257102 Free PMC article.
-
First Generation Gene Expression Signature for Early Prediction of Late Occurring Hematological Acute Radiation Syndrome in Baboons.Radiat Res. 2016 Jul;186(1):39-54. doi: 10.1667/RR14318.1. Epub 2016 Jun 22. Radiat Res. 2016. PMID: 27333084
-
Persistent mRNA and miRNA expression changes in irradiated baboons.Sci Rep. 2018 Oct 18;8(1):15353. doi: 10.1038/s41598-018-33544-2. Sci Rep. 2018. PMID: 30337559 Free PMC article.
-
Approach to pancytopenia: From blood tests to the bedside.Clin Med (Lond). 2024 Sep;24(5):100235. doi: 10.1016/j.clinme.2024.100235. Epub 2024 Aug 17. Clin Med (Lond). 2024. PMID: 39159748 Free PMC article. Review.
Cited by
-
Development of Biomarkers for Radiation Biodosimetry and Medical Countermeasures Research: Current Status, Utility, and Regulatory Pathways.Radiat Res. 2022 May 1;197(5):514-532. doi: 10.1667/RADE-21-00157.1. Radiat Res. 2022. PMID: 34879151 Free PMC article.
-
Liquid Biopsy in Whole Blood for Identification of Gene Expression Patterns (mRNA and miRNA) Associated with Recurrence of Glioblastoma WHO CNS Grade 4.Cancers (Basel). 2024 Jun 26;16(13):2345. doi: 10.3390/cancers16132345. Cancers (Basel). 2024. PMID: 39001407 Free PMC article.
-
Nonhuman primates as models for the discovery and development of radiation countermeasures.Expert Opin Drug Discov. 2017 Jul;12(7):695-709. doi: 10.1080/17460441.2017.1323863. Epub 2017 May 5. Expert Opin Drug Discov. 2017. PMID: 28441902 Free PMC article. Review.
-
A Review of Radiation-Induced Alterations of Multi-Omic Profiles, Radiation Injury Biomarkers, and Countermeasures.Radiat Res. 2023 Jan 1;199(1):89-111. doi: 10.1667/RADE-21-00187.1. Radiat Res. 2023. PMID: 36368026 Free PMC article. Review.
-
Lung transcriptome of nonhuman primates exposed to total- and partial-body irradiation.Mol Ther Nucleic Acids. 2022 Aug 4;29:584-598. doi: 10.1016/j.omtn.2022.08.006. eCollection 2022 Sep 13. Mol Ther Nucleic Acids. 2022. PMID: 36090752 Free PMC article.
References
-
- Port M, Herodin F, Valente M, et al. (2016) First generation gene expression signature for early prediction of late occurring hematological acute radiation syndrome in baboons. 000:39–54. doi:10.1667/RR14318.1 - PubMed
MeSH terms
Substances
LinkOut - more resources
Full Text Sources
Other Literature Sources

