

Adiponectin improves endothelial function in mesenteric arteries of rats fed a high-fat diet: role of perivascular adipose tissue
- PMID: 28236429
- PMCID: PMC5610162
- DOI: 10.1111/bph.13756
Adiponectin improves endothelial function in mesenteric arteries of rats fed a high-fat diet: role of perivascular adipose tissue
Abstract
Background and purpose: Adiponectin, the most abundant peptide secreted by adipocytes, is involved in the regulation of energy metabolism and vascular physiology. Here, we have investigated the effects of exogenous administration of adiponectin on metabolism, vascular reactivity and perivascular adipose tissue (PVAT) of mesenteric arteries in Wistar rats fed a high-fat diet.
Experimental approach: The effects of adiponectin on NO-dependent and independent vasorelaxation were investigated in isolated mesenteric arteries from 12-month-old male Wistar rats (W12m) fed a high-fat diet (HFD) for 4 months and compared with those from age-matched rats given a control diet. Adiponectin ((96 μg·day-1 ) was administered by continuous infusion with a minipump, implanted subcutaneously, for 28 days.
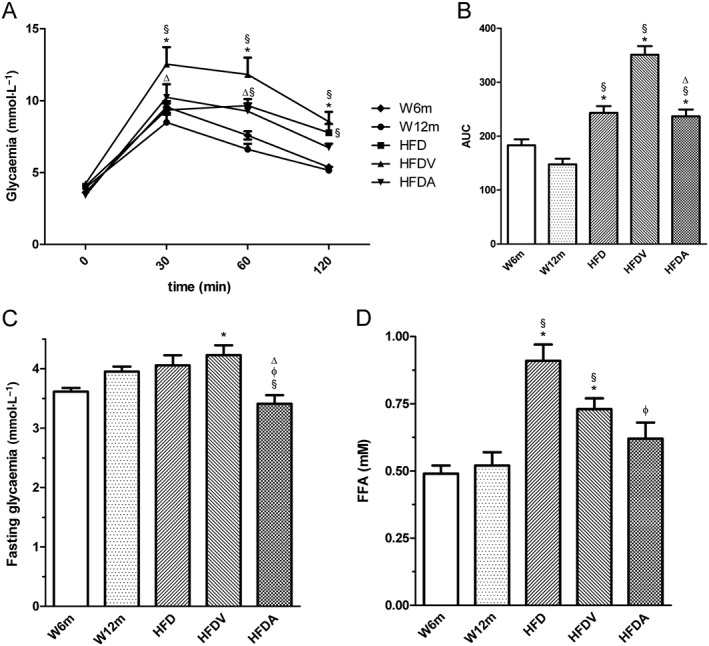
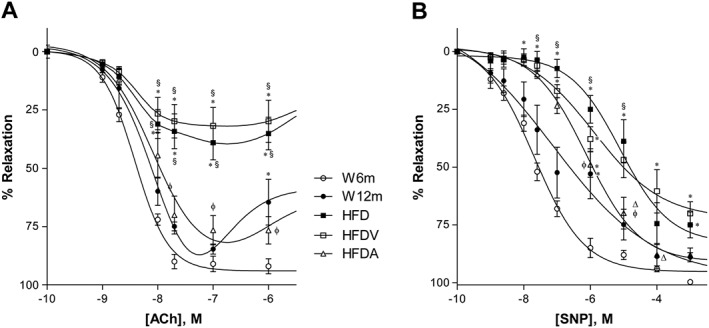
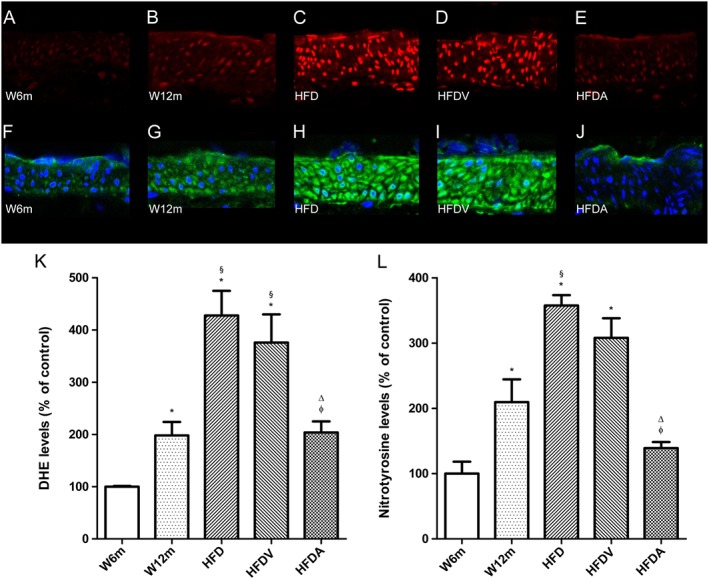
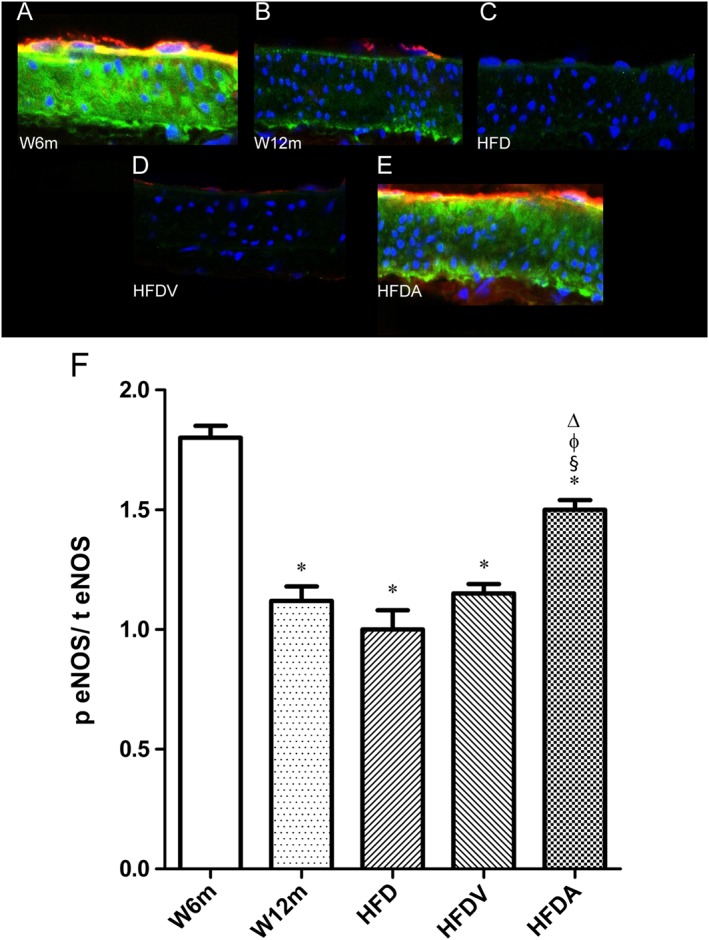
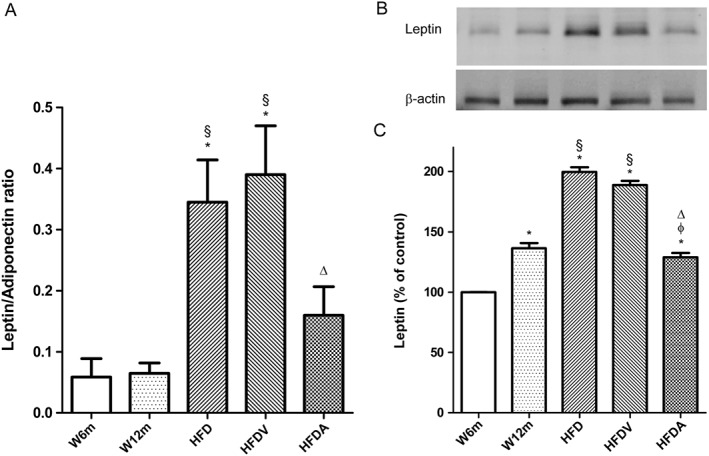
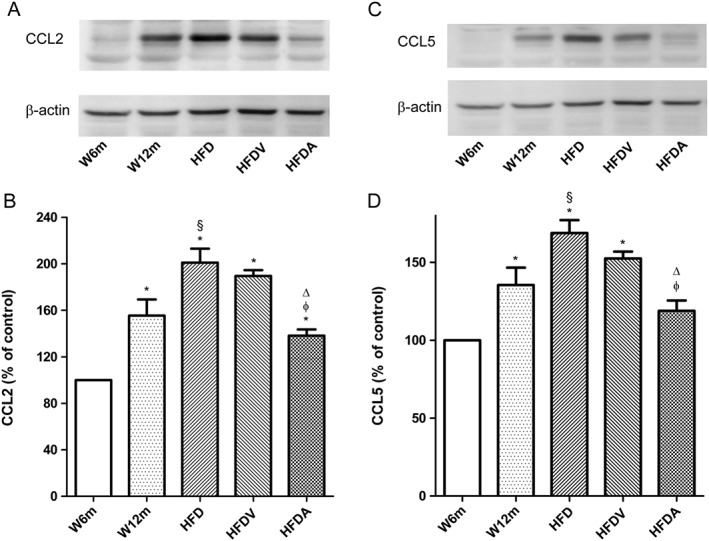
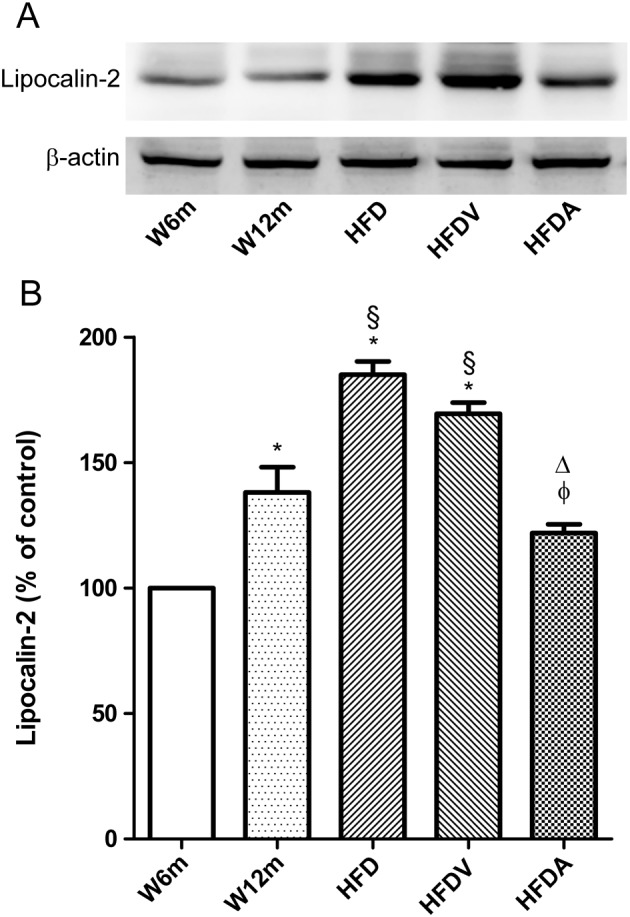
Key results: Chronic adiponectin treatment reduced body weight, total cholesterol, free fatty acids, fasting glucose and area under the curve of intraperitoneal glucose tolerance test, compared with HFD rats. It also normalized NO-dependent vasorelaxation increasing endothelial NO synthase (eNOS) phosphorylation in mesenteric arteries of HFD rats. In PVAT from aged (W12m) and HFD rats there was increased expression of chemokines and pro-inflammatory adipokines, the latter being important contributors to endothelial dysfunction. Infusion of adiponectin reduced these changes.
Conclusions and implications: Adiponectin normalized endothelial cell function by a mechanism that involved increased eNOS phoshorylation and decreased PVAT inflammation. Detailed characterization of the adiponectin signalling pathway in the vasculature and perivascular fat is likely to provide novel approaches to the management of atherosclerosis and metabolic disease.
Linked articles: This article is part of a themed section on Molecular Mechanisms Regulating Perivascular Adipose Tissue - Potential Pharmacological Targets? To view the other articles in this section visit http://onlinelibrary.wiley.com/doi/10.1111/bph.v174.20/issuetoc.
© 2017 The British Pharmacological Society.
Figures
Similar articles
-
Restoration of perivascular adipose tissue function in diet-induced obese mice without changing bodyweight.Br J Pharmacol. 2017 Oct;174(20):3443-3453. doi: 10.1111/bph.13703. Epub 2017 Jan 31. Br J Pharmacol. 2017. PMID: 28055105 Free PMC article.
-
Increased mitochondrial ROS generation mediates the loss of the anti-contractile effects of perivascular adipose tissue in high-fat diet obese mice.Br J Pharmacol. 2017 Oct;174(20):3527-3541. doi: 10.1111/bph.13687. Epub 2017 Jan 12. Br J Pharmacol. 2017. PMID: 27930804 Free PMC article.
-
The role of perivascular adipose tissue in obesity-induced vascular dysfunction.Br J Pharmacol. 2017 Oct;174(20):3425-3442. doi: 10.1111/bph.13650. Epub 2016 Nov 17. Br J Pharmacol. 2017. PMID: 27761903 Free PMC article. Review.
-
Deletion of AMPKα1 attenuates the anticontractile effect of perivascular adipose tissue (PVAT) and reduces adiponectin release.Br J Pharmacol. 2017 Oct;174(20):3398-3410. doi: 10.1111/bph.13633. Epub 2016 Oct 23. Br J Pharmacol. 2017. PMID: 27668984 Free PMC article.
-
Pro-contractile effects of perivascular fat in health and disease.Br J Pharmacol. 2017 Oct;174(20):3482-3495. doi: 10.1111/bph.13767. Epub 2017 Apr 3. Br J Pharmacol. 2017. PMID: 28257140 Free PMC article. Review.
Cited by
-
Maternal Obesity Programming of Perivascular Adipose Tissue and Associated Immune Cells: An Understudied Area With Few Answers and Many Questions.Front Physiol. 2022 Jan 21;12:798987. doi: 10.3389/fphys.2021.798987. eCollection 2021. Front Physiol. 2022. PMID: 35126181 Free PMC article.
-
The role of epicardial adipose tissue remodelling in heart failure with preserved ejection fraction.Cardiovasc Res. 2025 Jun 12;121(6):860-870. doi: 10.1093/cvr/cvaf056. Cardiovasc Res. 2025. PMID: 40238568 Free PMC article. Review.
-
Perivascular Adipose Tissue Regulates Vascular Function by Targeting Vascular Smooth Muscle Cells.Arterioscler Thromb Vasc Biol. 2020 May;40(5):1094-1109. doi: 10.1161/ATVBAHA.120.312464. Epub 2020 Mar 19. Arterioscler Thromb Vasc Biol. 2020. PMID: 32188271 Free PMC article. Review.
-
The evolving functions of the vasculature in regulating adipose tissue biology in health and obesity.Nat Rev Endocrinol. 2023 Dec;19(12):691-707. doi: 10.1038/s41574-023-00893-6. Epub 2023 Sep 25. Nat Rev Endocrinol. 2023. PMID: 37749386 Review.
-
Role of Inflammation in Vascular Disease-Related Perivascular Adipose Tissue Dysfunction.Front Endocrinol (Lausanne). 2021 Aug 11;12:710842. doi: 10.3389/fendo.2021.710842. eCollection 2021. Front Endocrinol (Lausanne). 2021. PMID: 34456867 Free PMC article. Review.
References
-
- Antonopoulos AS, Margaritis M, Coutinho P, Shirodaria C, Psarros C, Herdman L et al. (2015). Adiponectin as a link between type 2 diabetes mellitus and vascular NADPH‐oxidase activity in the human arterial wall: the regulatory role of perivascular adipose tissue. Diabetes 64: 2207–2219. - PubMed
-
- Bailey‐Downs LC, Tucsek Z, Toth P, Sosnowska D, Gautam T, Sonntag WE et al. (2013). Aging exacerbates obesity‐induced oxidative stress and inflammation in perivascular adipose tissue in mice: a paracrine mechanism contributing to vascular redox dysregulation and inflammation. J Gerontol A Biol Sci Med Sci 68: 780–792. - PMC - PubMed
-
- Berg AH, Combs TP, Scherer PR (2002). ACRP30/adiponectin: an adipokine regulating glucose and lipid metabolism. Trends Endocrinol Metab 13: 84–89. - PubMed
MeSH terms
Substances
LinkOut - more resources
Full Text Sources
Other Literature Sources
