. 2017 Jul;67(1):72-83.
doi: 10.1016/j.jhep.2017.02.017. Epub 2017 Feb 22.

SOX17 regulates cholangiocyte differentiation and acts as a tumor suppressor in cholangiocarcinoma

Affiliations

SOX17 regulates cholangiocyte differentiation and acts as a tumor suppressor in cholangiocarcinoma

Maite Merino-Azpitarte et al. J Hepatol. 2017 Jul.

Abstract

Background & aims: Cholangiocarcinoma (CCA) is a biliary malignancy linked to genetic and epigenetic abnormalities, such as hypermethylation of SOX17 promoter. Here, the role of SOX17 in cholangiocyte differentiation and cholangiocarcinogenesis was studied.

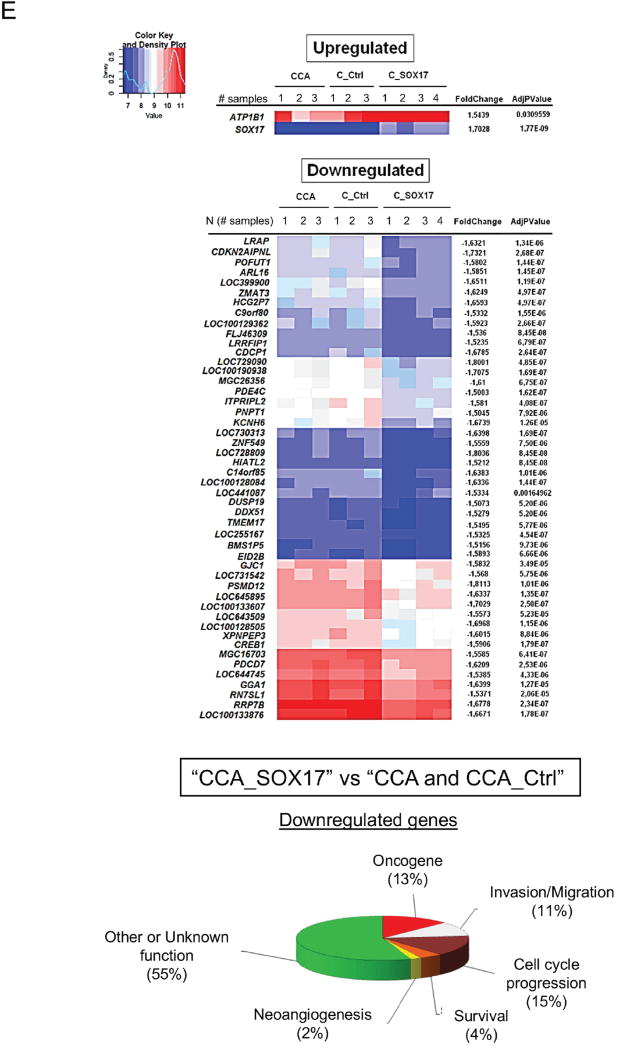
Methods: SOX17 expression/function was evaluated along the differentiation of human induced pluripotent stem cells (iPSC) into cholangiocytes, in the dedifferentiation process of normal human cholangiocytes (NHC) in culture and in cholangiocarcinogenesis. Lentiviruses for SOX17 overexpression or knockdown were used. Gene expression and DNA methylation profiling were performed.

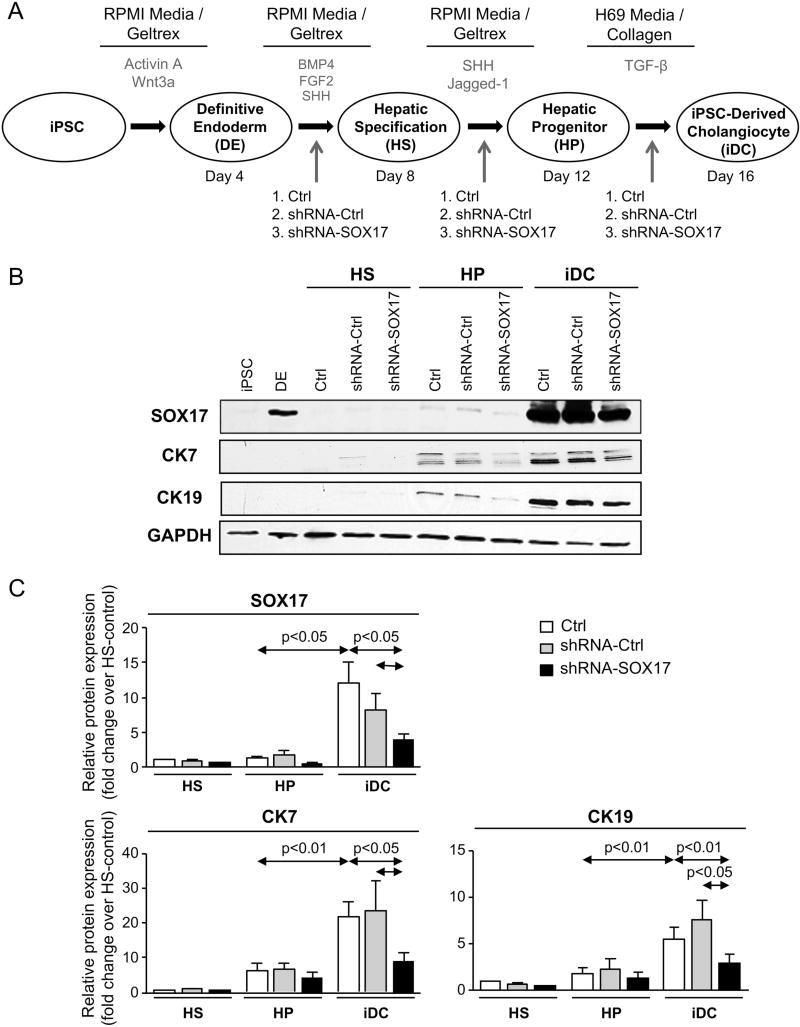
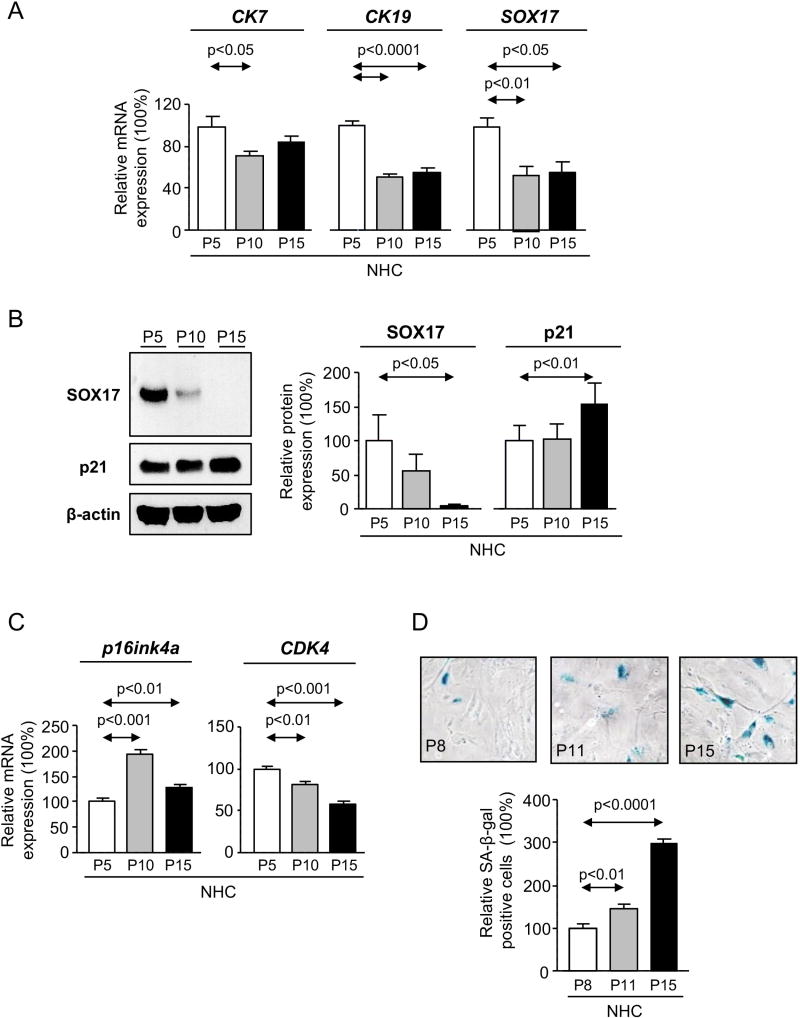
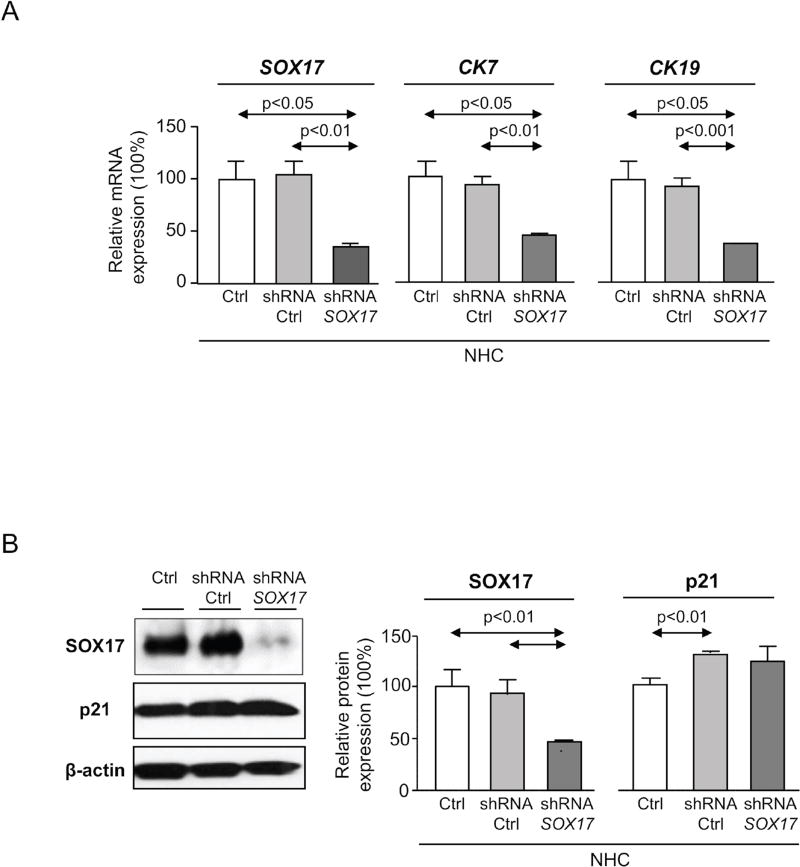
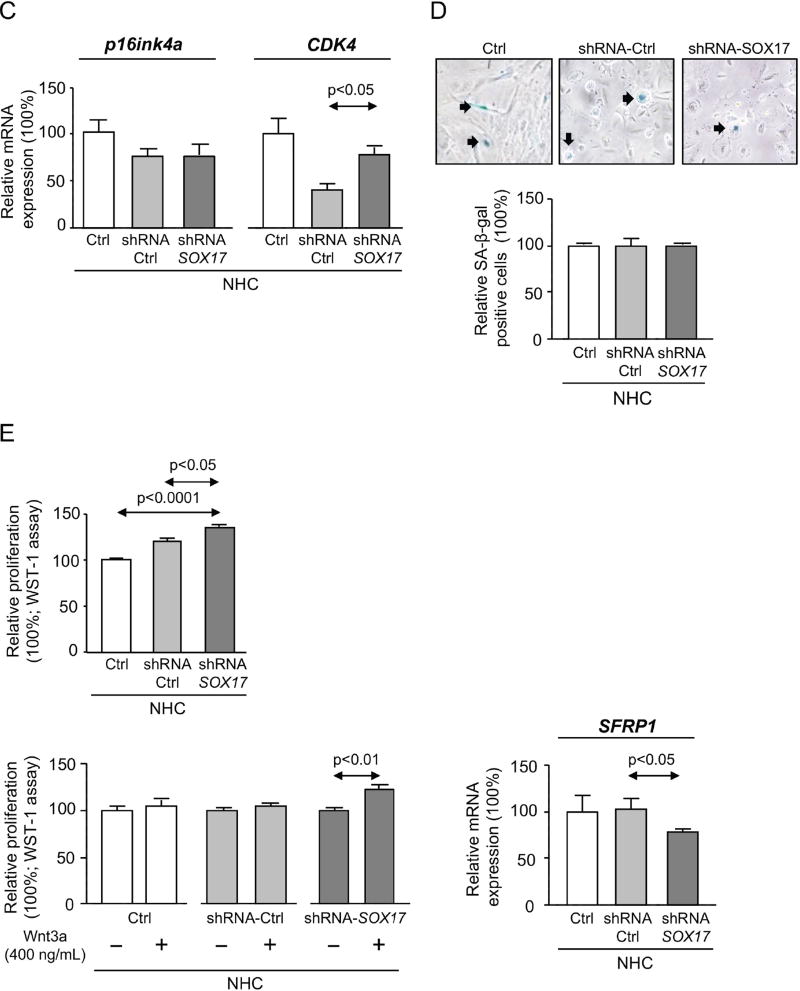
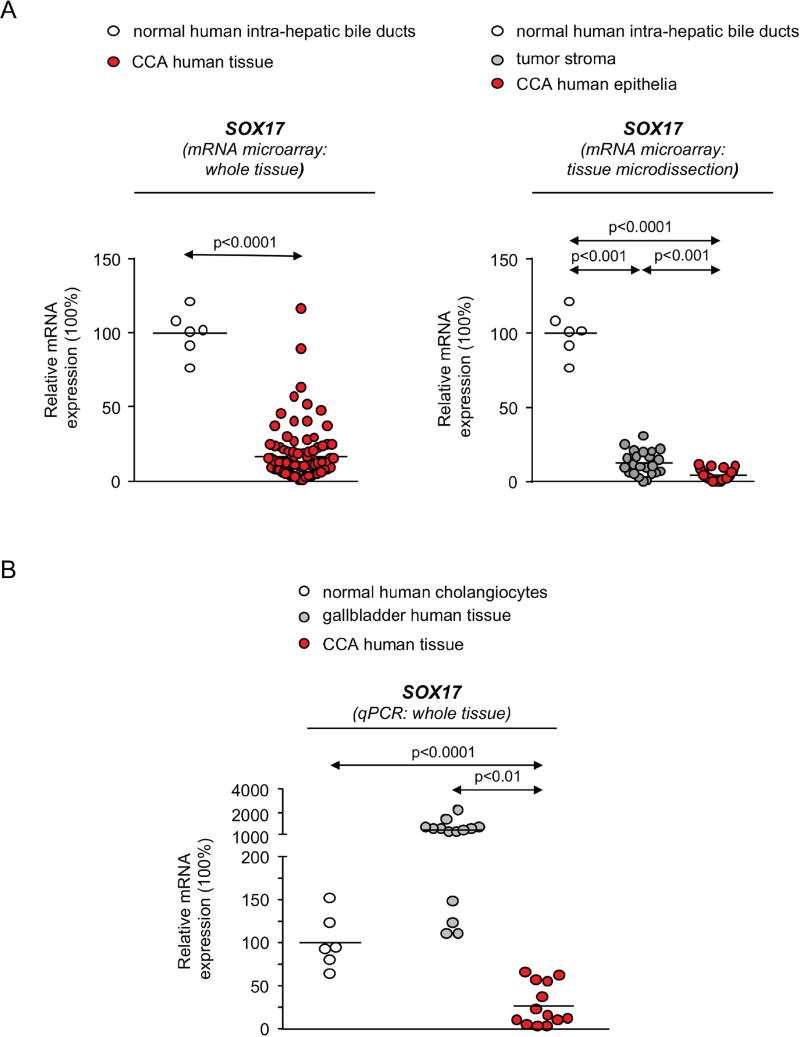
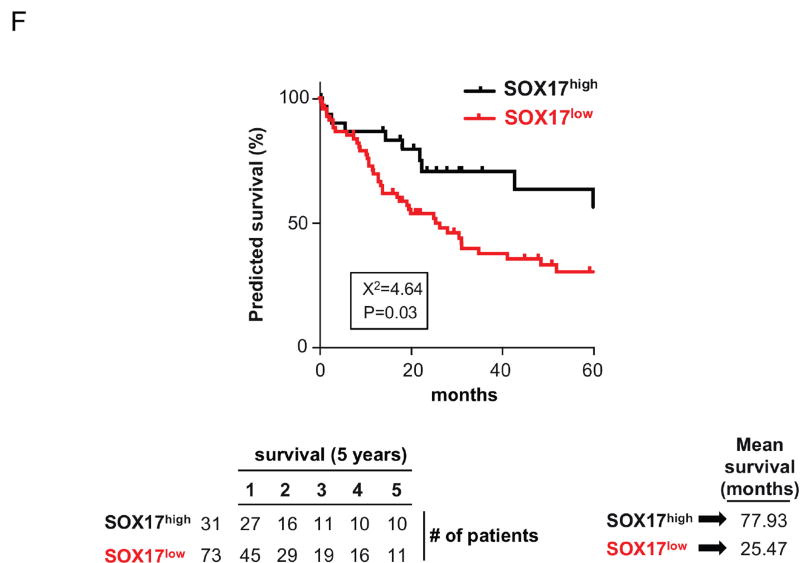
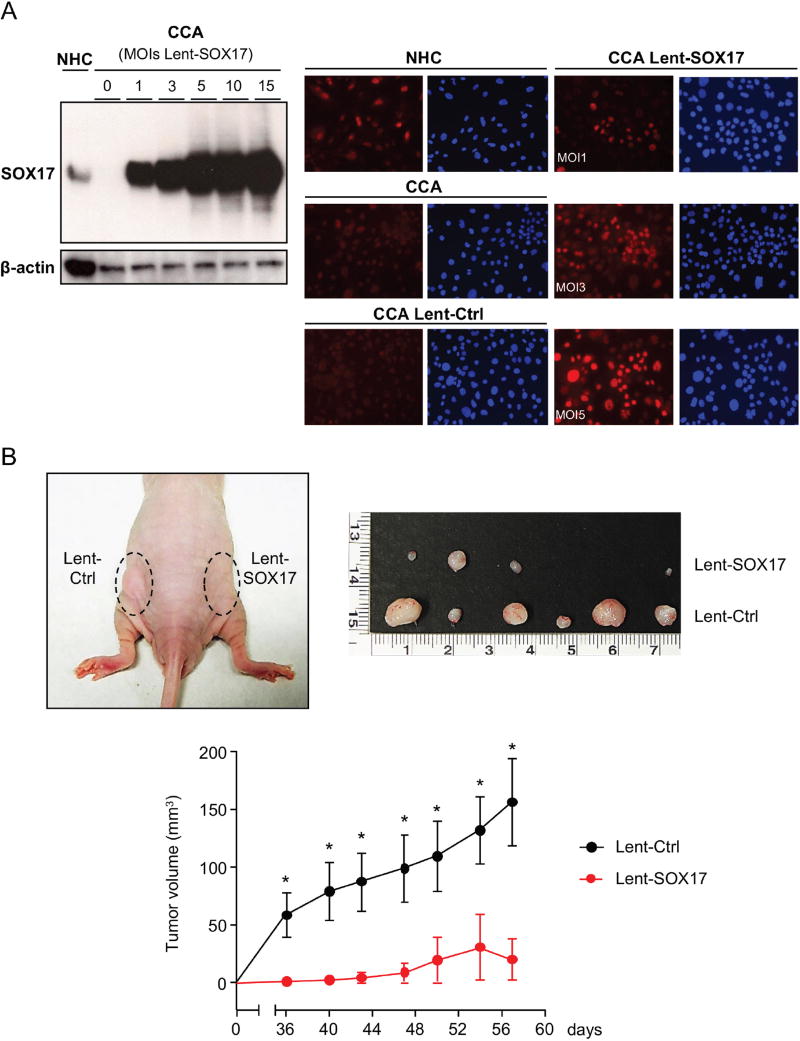
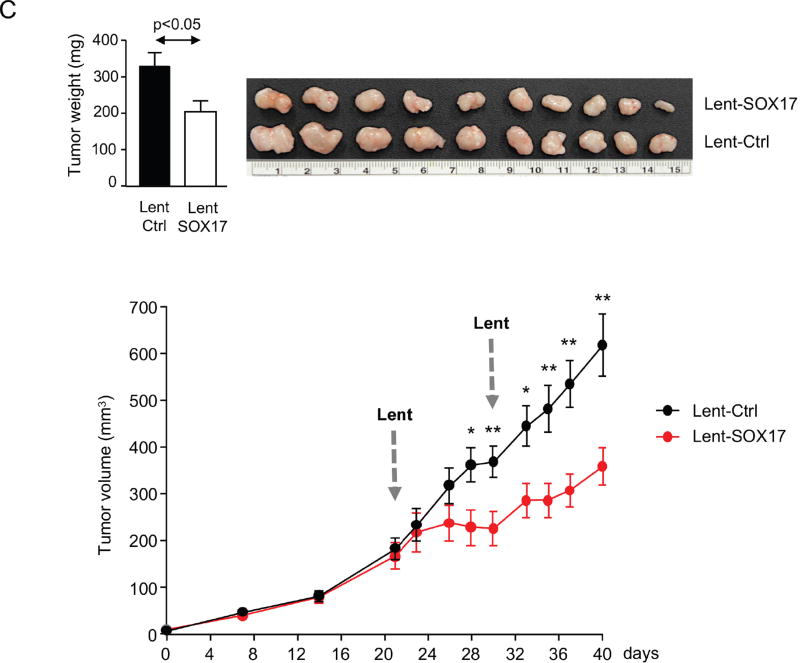
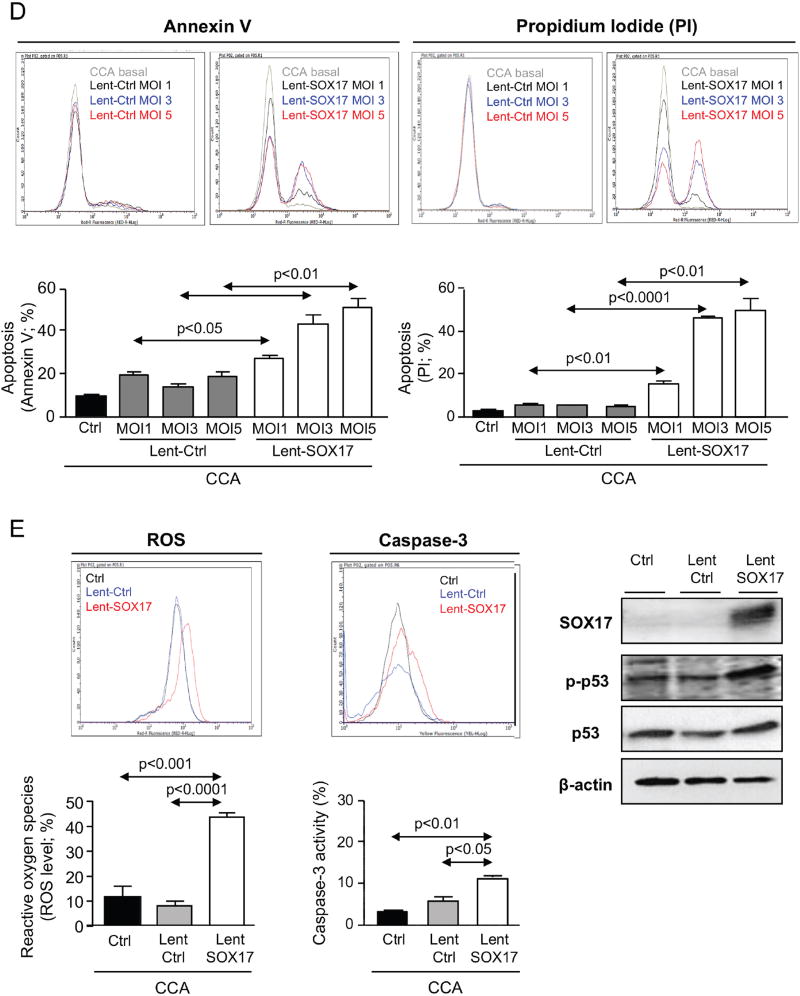
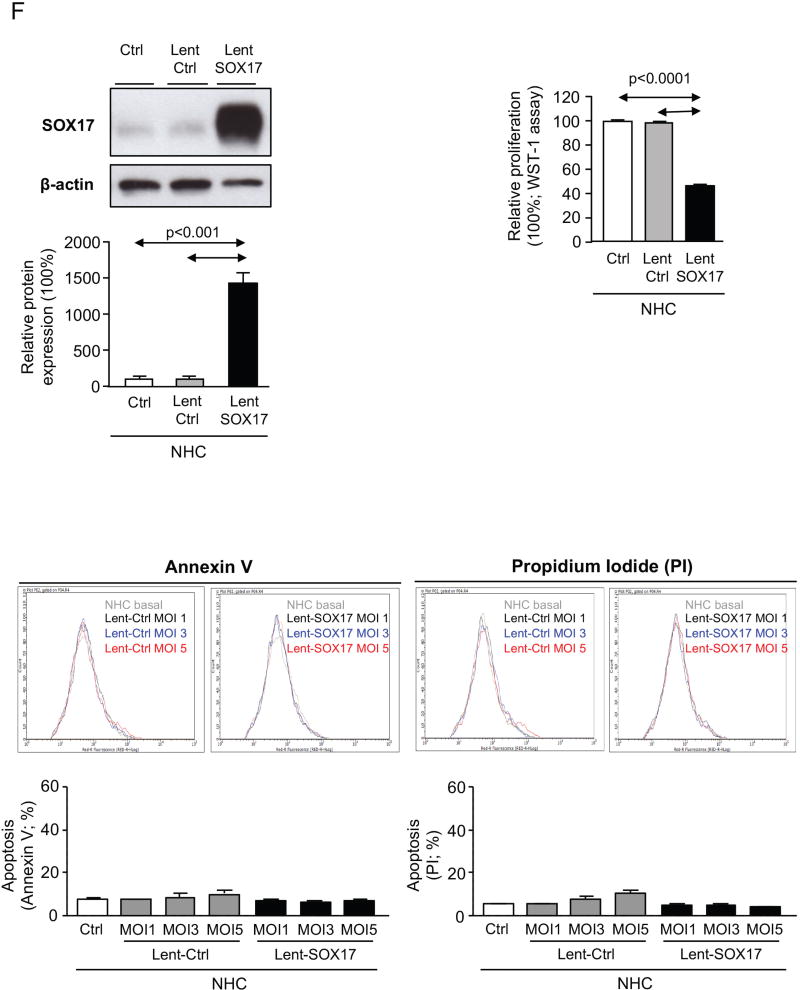
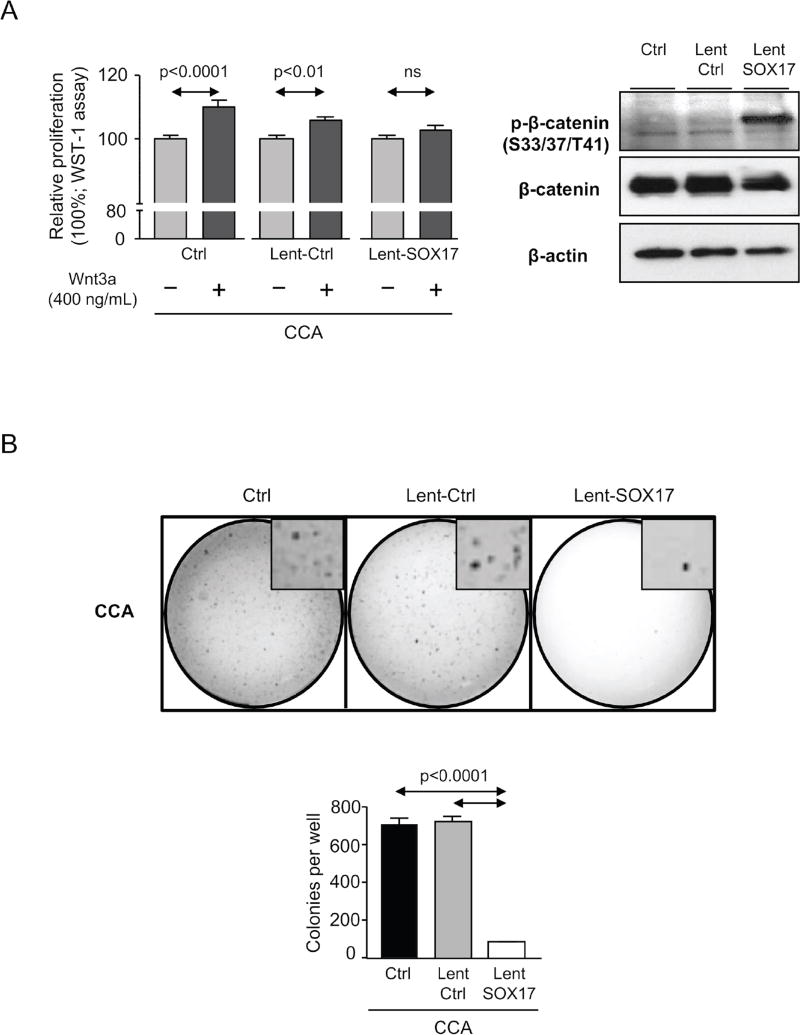
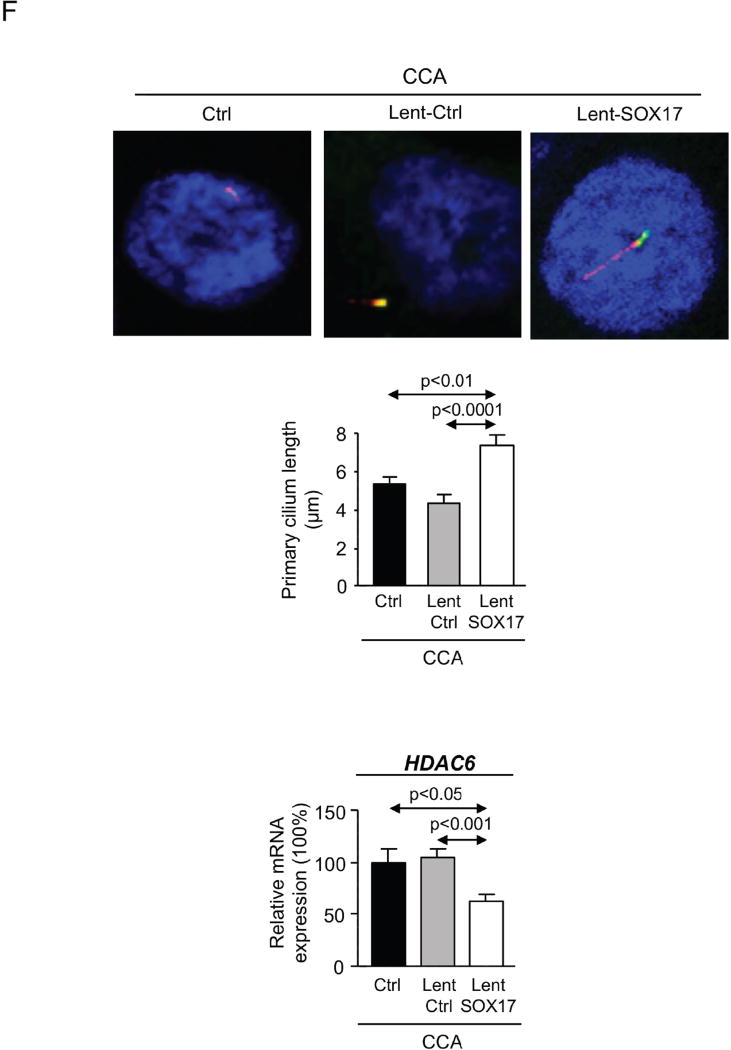
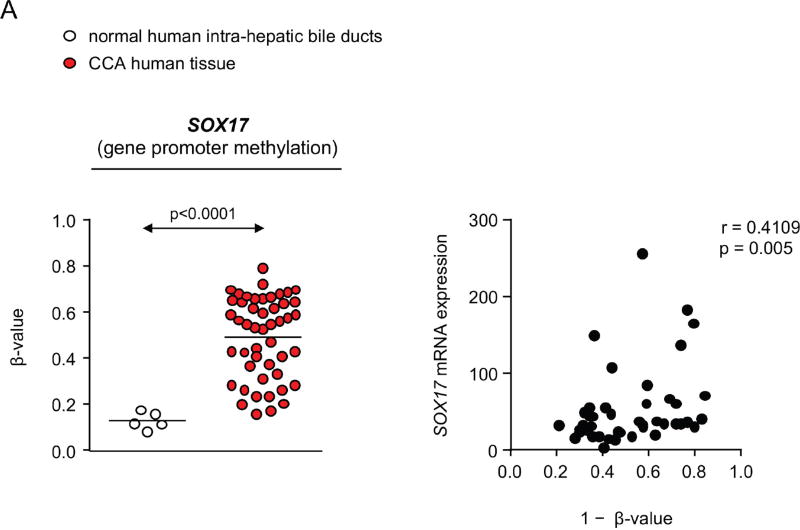
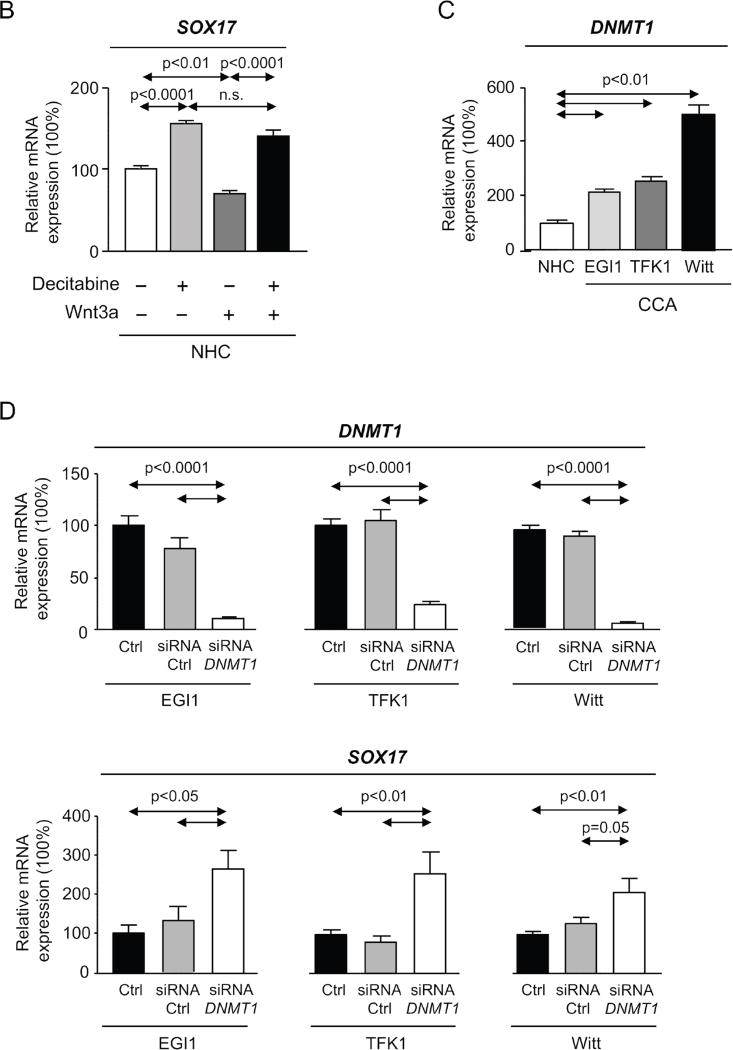
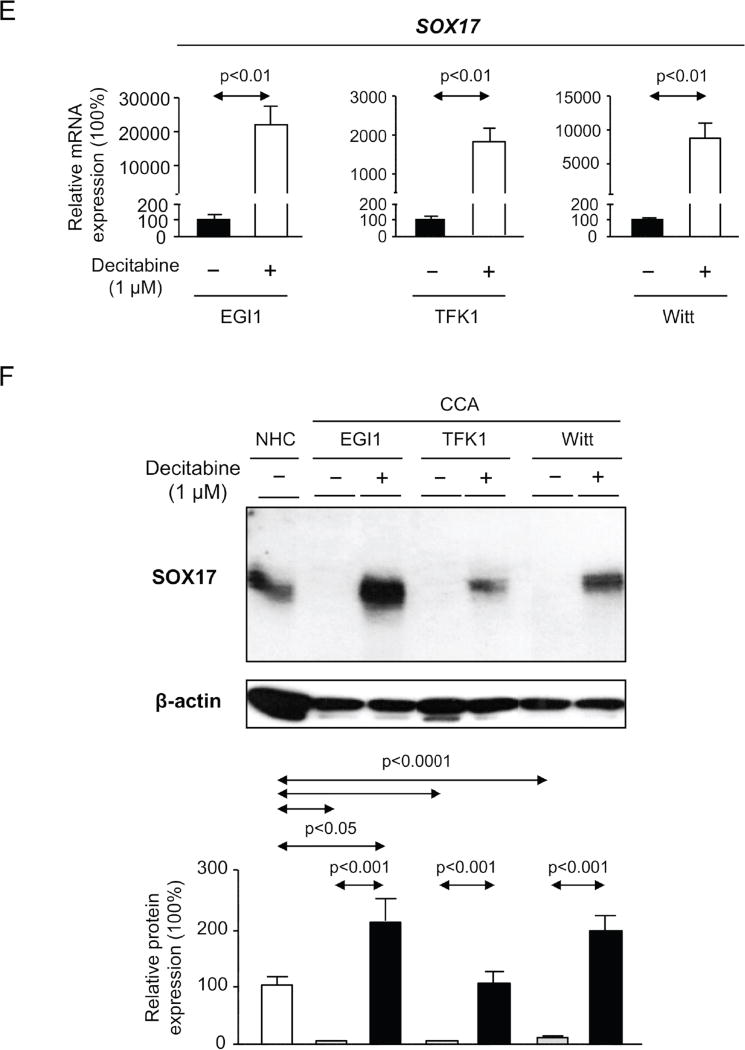
Results: SOX17 expression is induced in the last stage of cholangiocyte differentiation from iPSC and regulates the acquisition of biliary markers. SOX17 becomes downregulated in NHC undergoing dedifferentiation; experimental SOX17 knockdown in differentiated NHC downregulated biliary markers and promoted baseline and Wnt-dependent proliferation. SOX17 expression is lower in human CCA than in healthy tissue, which correlates with worse survival after tumor resection. In CCA cells, SOX17 overexpression decreased their tumorigenic capacity in murine xenograft models, which was related to increased oxidative stress and apoptosis. In contrast, SOX17 overexpression in NHC did not affect their survival but inhibited their baseline proliferation. In CCA cells, SOX17 inhibited migration, anchorage-independent growth and Wnt/β-catenin-dependent proliferation, and restored the expression of biliary markers and primary cilium length. In human CCA, SOX17 promoter was found hypermethylated and its expression inversely correlates with the methylation grade. In NHC, Wnt3a decreased SOX17 expression in a DNMT-dependent manner, whereas in CCA, DNMT1 inhibition or silencing upregulated SOX17.

Conclusions: SOX17 regulates the differentiation and maintenance of the biliary phenotype and functions as a tumor suppressor for CCA, being a potential prognostic marker and a promising therapeutic target.

Lay summary: Understanding the molecular mechanisms involved in the pathogenesis of CCA is key in finding new valuable diagnostic and prognostic biomarkers, as well as therapeutic targets. This study provides evidence that SOX17 regulates the differentiation and maintenance of the biliary phenotype, and its downregulation promotes their tumorigenic transformation. SOX17 acts as a tumor suppressor in CCA and its genetic, molecular and/or pharmacological restoration may represent a new promising therapeutic strategy. Moreover, SOX17 expression correlates with the outcome of patients after tumor resection, being a potential prognostic biomarker.

Keywords: Cholangiocarcinoma; Cholangiocyte differentiation; Epigenetics; Prognosis; SOX17.


Conflict of interest statement

Conflict of interest: authors disclose no conflicts.

Figures

Figure 1
Figure 1. SOX17 regulates the differentiation of induced pluripotent stem cells into mature cholangiocytes
A) Chart summarizing the multistep process of differentiation from iPSC into iDC. Time-points of lentiviral administration are shown. B) Representative immunoblots and C) quantitative protein levels of SOX17, CK7 and CK19 in the differentiation steps from HS into iDC. Pooled data from 5 independent experiments (mean±SEM; p-value vs controls, Student’s t-test).
Figure 2
Figure 2. NHC dedifferentiate and enter into senescence over cell passages in vitro
A) Expression of the biliary markers CK7, CK19 and SOX17 (n=4–6). B) Immunoblots and quantification of SOX17 and p21 (senescence marker) levels (n=3). C) Expression of p16ink4a (senescence marker) and CDK4 (cell cycle promoter) (n=4–5). D) Representative light microscopy images and relative quantification of β-galactosidase staining (n=6–8 wells from two independent experiments). Panels A-D: mean±SEM; p-value vs lowest cell passage (P5 or P8, Student’s t-test).
Figure 3
Figure 3. Experimental knock-down of SOX17 levels in NHC decreases the expression of biliary markers but does not affect senescence
A) Expression of SOX17 and biliary markers (n=3–4). B) Representative immunoblots and quantification of SOX17 and p21 levels (n=3 independent experiments). C) Expression of p16ink4a and CDK4 (n=5). D) Representative light microscopy images of β-galactosidase staining (n=7 wells from two independent experiments; NHC of passage 8). E) Basal and Wnt3a–dependent proliferation (n=8–9) and levels of the Wnt3a inhibitor SFRP1 (n=4). Panels A-E: mean±SEM; p-value vs controls, Student’s t-test.
Figure 4
Figure 4. SOX17 expression is decreased in CCA tumors and cell lines and correlates with survival
A) SOX17 expression (mRNA microarray) in CCA tumors (whole tissue) compared to normal intrahepatic bile ducts, and in CCA epithelia compared to stroma (mean±SEM; p-value vs controls, Mann-Whitney t-test and Wilcoxon matched-pairs signed rank test, respectively) (Copenhagen cohort). B) SOX17 expression (qPCR) in CCA tumors compared to NHC and normal gallbladder tissue (San Sebastian cohort). Dots=number of patients. C) Representative IMFs of SOX17 (green) and CK19 (red) in normal human liver and CCA human tissue (n=5). SOX17 D) mRNA (n=4–6) and E) protein (n=4) levels in CCA cell lines and NHC. F) Kaplan-Meier analysis (Gehan-Breslow-Wilcoxon test) of SOX17 mRNA expression in CCA tumors (Copenhagen cohort). Panels B,D,E: mean±SEM; p-value vs controls, Student’s t-test.
Figure 5
Figure 5. Experimental overexpression of SOX17 in CCA cells decreases their tumorigenic capacity by increasing apoptosis
A) Representative immunoblots and IMFs of SOX17 in CCA cells and NHC under experimental modulation of SOX17 expression (red: SOX17; blue: nucleus). B) SOX17-dependent subcutaneous CCA implantation and growth in immunodeficient mice. C) SOX17 experimental overexpression inhibits the growth of already developed subcutaneous CCA tumors in immunodeficient mice. Arrows: time-points of intratumoral lentiviral injection. Quantification (n=3, MOI 3) of flow cytometry-based D) apoptosis (n=3), E) oxidative stress and caspase-3 activity in CCA cells under experimental modulation of SOX17 expression. Representative immunoblots of p-p53, p53, SOX17 and β-actin. F) Representative immunoblot and quantification of SOX17 expression in NHC under experimental modulation of SOX17 expression (n=3) and effects on proliferation (n=10) and apoptosis (n=3). Panels B-F: mean±SEM; p-value vs controls, Student’s t-test. Data in D-F are representative of at least two independent experiments. (* and **:p-value <0.05 and <0.01, respectively).
Figure 6
Figure 6. Experimental overexpression of SOX17 in CCA cells decreases their proliferation and migration capacity and increases their biliary differentiation features
A) Wnt3a–dependent proliferation (n=24) and immunoblots of p-β-catenin (S33/37/T41), β-catenin and β-actin. B) Anchorage-independent CCA cell growth in soft agar (n=6 from two independent experiments). C) Representative light microscopy images and quantification of CCA scratch-migration assays (n=6–8 from three independent experiments) and S100A4 mRNA expression (n=4). D) Expression (mRNA) of biliary and epithelial markers (n=4). E) Heatmaps and clusters of dysregulated genes based on cellular function (n=3–4; Bayes moderated t-statistics). F) Representative IMF images and quantification of the primary cilium length [acetylated α-tubulin (axoneme): red; γ-tubulin (centrioles): green; nucleus: blue)] (n=40–60) and HDAC6 mRNA levels (n=4). Panels A–D,F: mean±SEM; p-value vs controls, Student’s t-test.
Figure 7
Figure 7. SOX17 expression is epigenetically regulated by DNMTs in NHC and CCA cells
A) Methylation levels of SOX17 promoter in CCA human tissue compared to normal intrahepatic bile ducts (mean±SEM; p-value vs controls, Mann-Whitney t-test) and correlation (nonparametric Spearman test) with SOX17 expression (Copenhagen cohort). Dots=number of patients. B) SOX17 levels in NHC under the presence or absence of Wnt3a and with or without decitabine (n=4–5; mean±SEM; ANOVA+Tukey post hoc test; n.s.: non-significant). C) DNMT1 levels in CCA cell lines and NHC (n=6). D) DNMT1 and SOX17 expression in CCA cells under experimental knock-down of DNMT1 compared to control conditions [n=7–10 for EGI1; n=12–13 for TFK1; and n=15–17 for Witt (pooled data from 2–4 independent experiments)]. SOX17 E) mRNA (n=6–9) and F) protein (n=6–7) levels in CCA cells under the presence or absence of decitabine. NHC were used as control. Panels C-F: mean±SEM; p-value vs controls, Student’s t-test.

References

    1. Banales JM, Cardinale V, Carpino G, Marzioni M, Andersen JB, Invernizzi P, et al. Expert consensus document: Cholangiocarcinoma: current knowledge and future perspectives consensus statement from the European Network for the Study of Cholangiocarcinoma (ENS-CCA) Nat Rev Gastroenterol Hepatol. 2016;13(5):261–280. - PubMed
    1. Goeppert B, Konermann C, Schmidt CR, Bogatyrova O, Geiselhart L, Ernst C, et al. Global alterations of DNA methylation in cholangiocarcinoma target the Wnt signaling pathway. Hepatology. 2014;59(2):544–554. - PubMed
    1. Kamachi Y, Kondoh H. Sox proteins: regulators of cell fate specification and differentiation. Development. 2013;140(20):4129–4144. - PubMed
    1. Kanai-Azuma M, Kanai Y, Gad JM, Tajima Y, Taya C, Kurohmaru M, et al. Depletion of definitive gut endoderm in Sox17-null mutant mice. Development. 2002;129(10):2367–2379. - PubMed
    1. Uemura M, Ozawa A, Nagata T, Kurasawa K, Tsunekawa N, Nobuhisa I, et al. Sox17 haploinsufficiency results in perinatal biliary atresia and hepatitis in C57BL/6 background mice. Development. 2013;140(3):639–648. - PMC - PubMed

Publication types

MeSH terms

Substances