. 2017 May:119:289-302.
doi: 10.1016/j.phrs.2017.02.016. Epub 2017 Feb 22.

AdipoRon, an adiponectin receptor agonist, attenuates PDGF-induced VSMC proliferation through inhibition of mTOR signaling independent of AMPK: Implications toward suppression of neointimal hyperplasia

Affiliations

AdipoRon, an adiponectin receptor agonist, attenuates PDGF-induced VSMC proliferation through inhibition of mTOR signaling independent of AMPK: Implications toward suppression of neointimal hyperplasia

Arwa Fairaq et al. Pharmacol Res. 2017 May.

Abstract

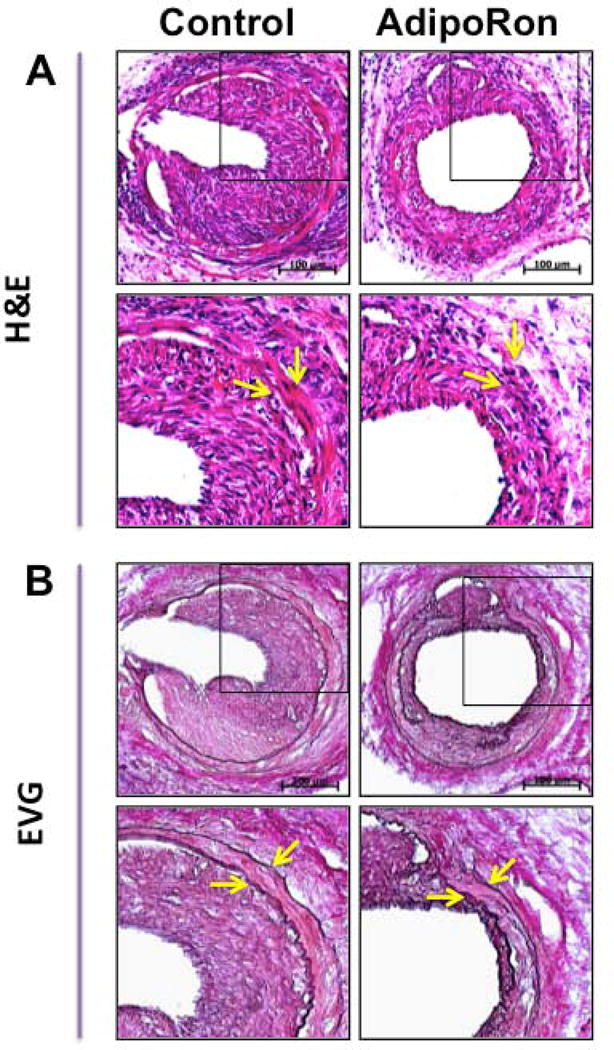
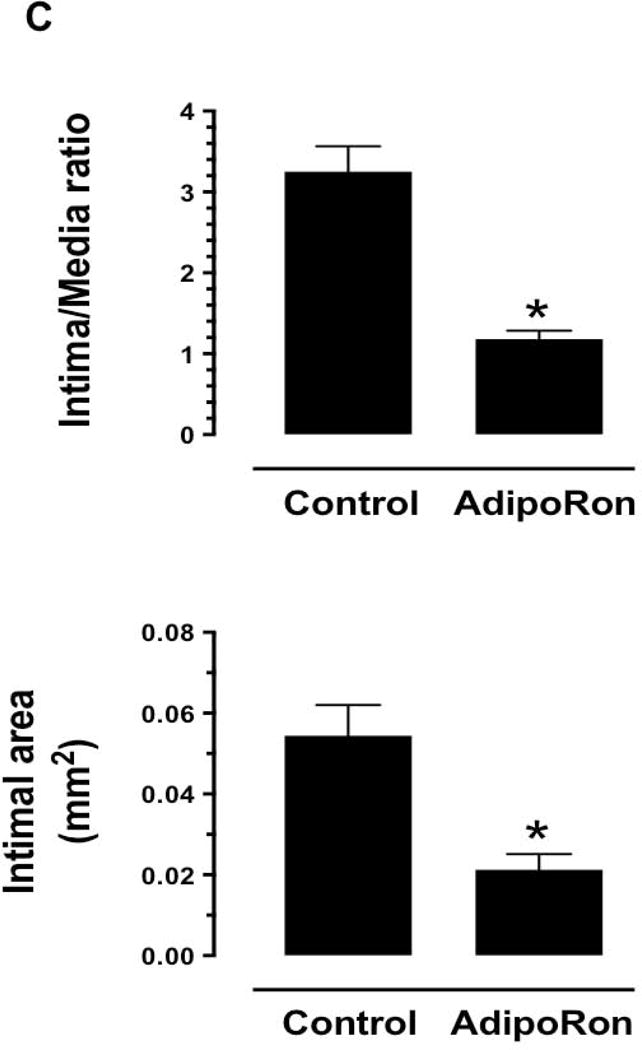
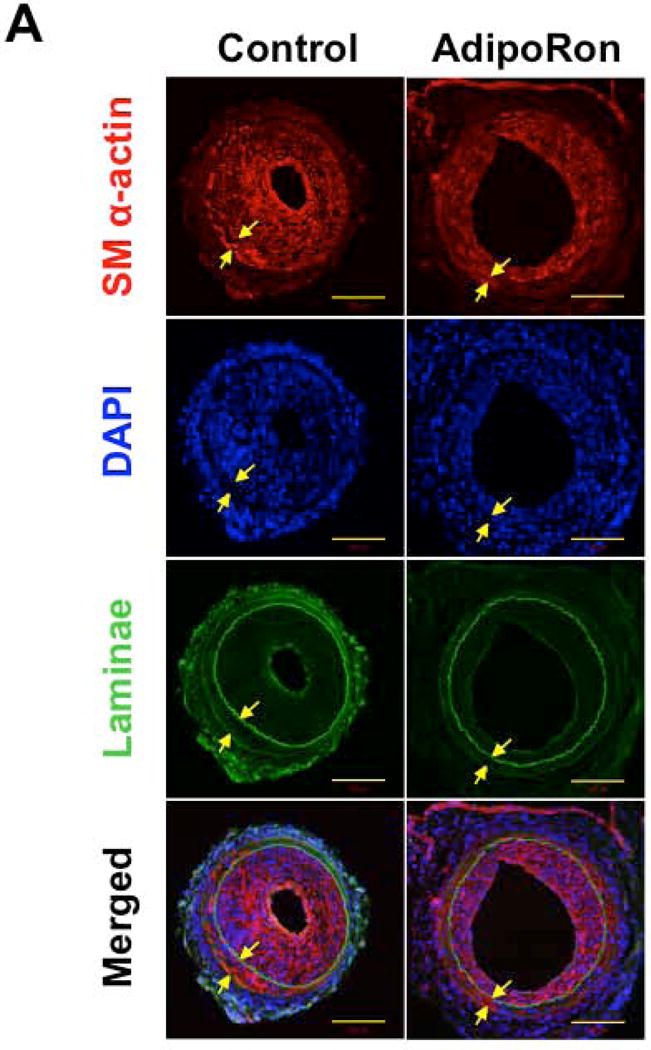
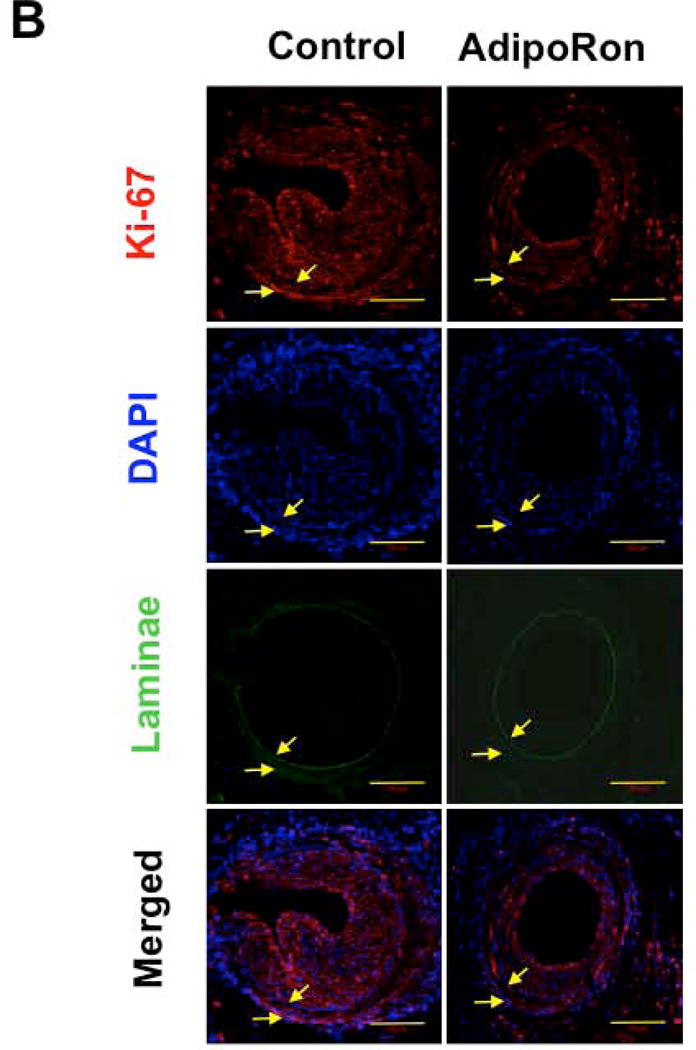
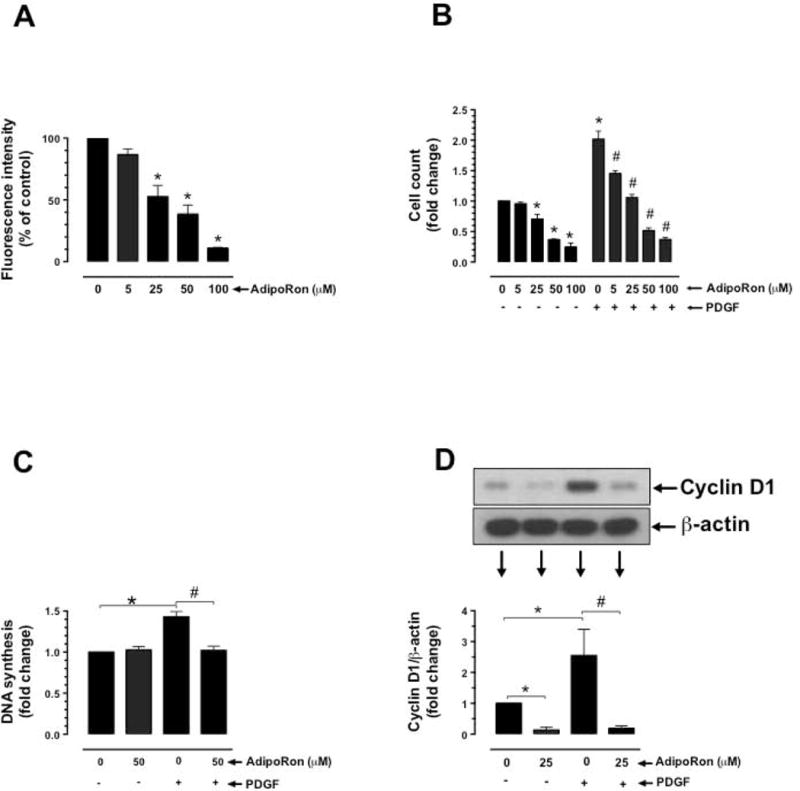
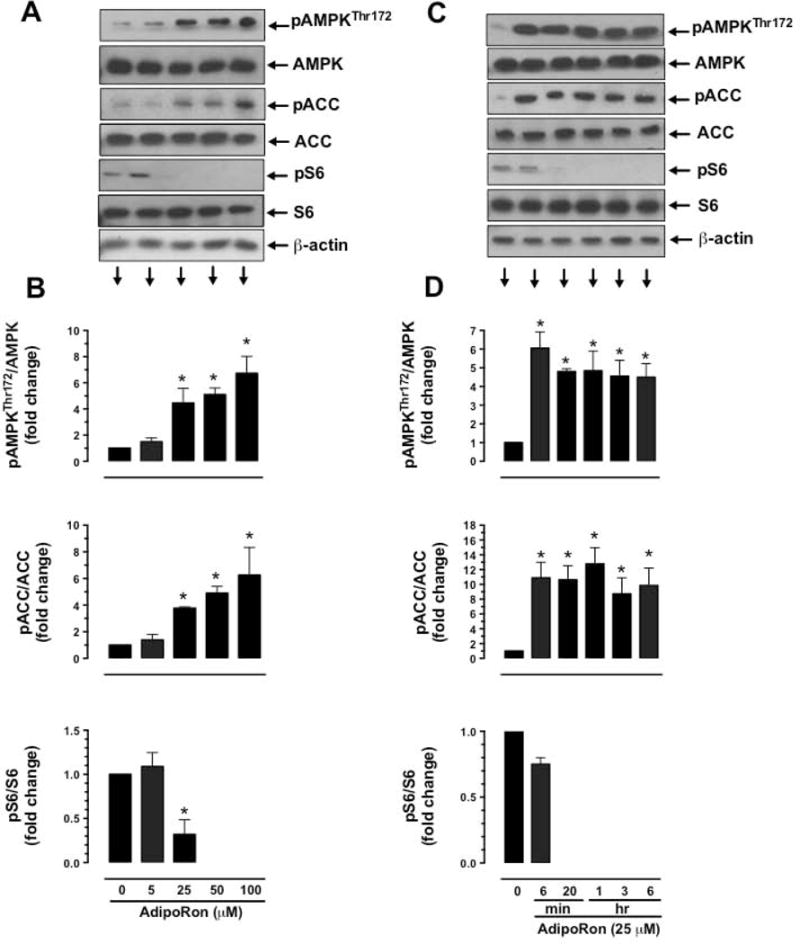
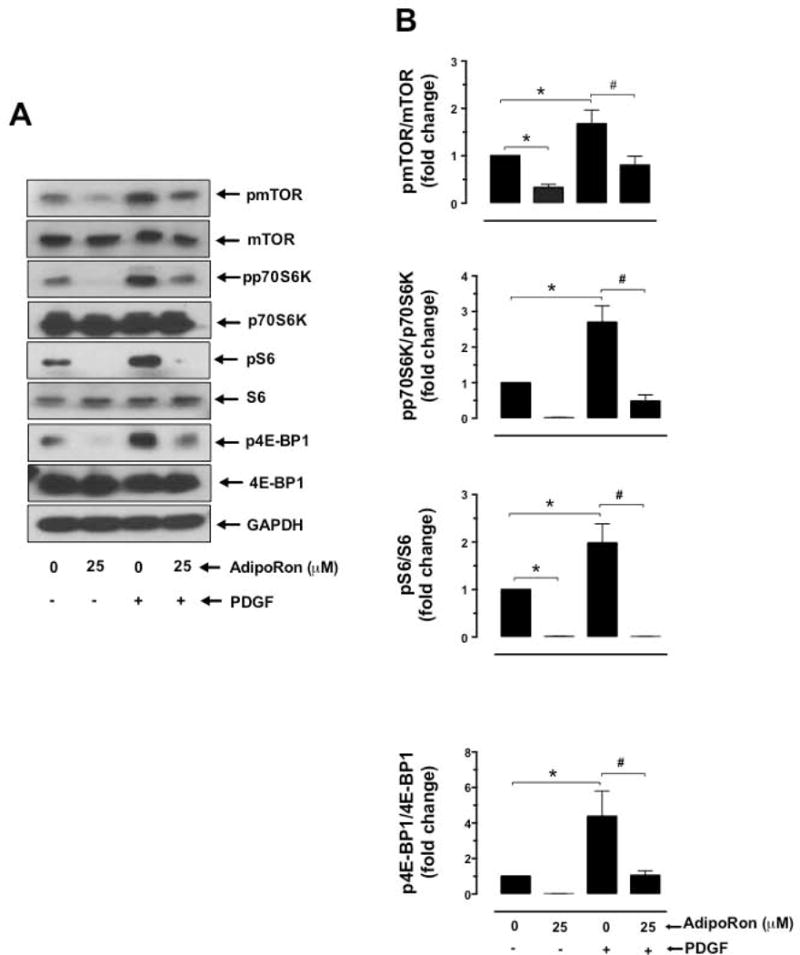
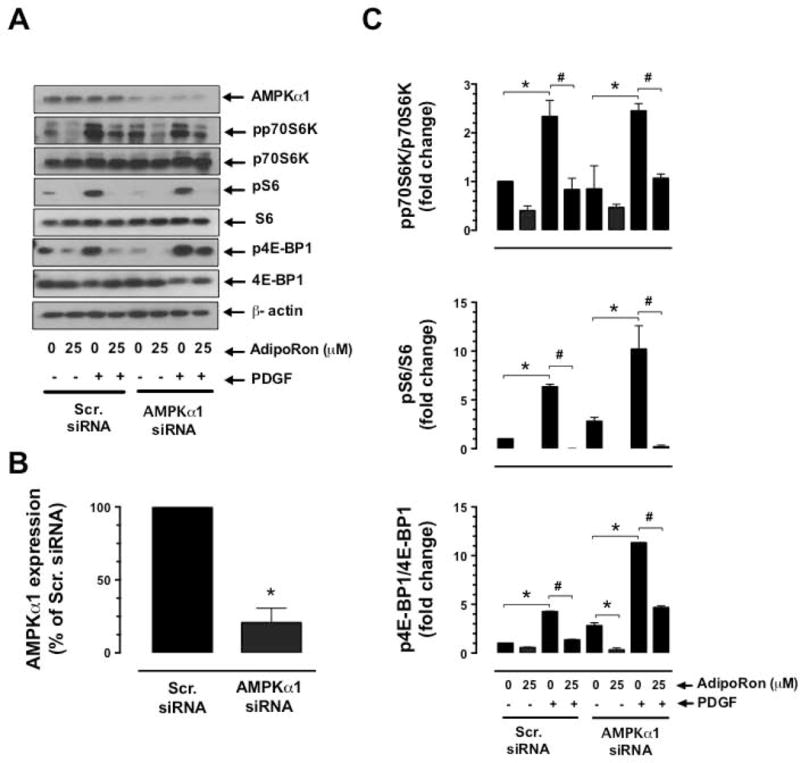
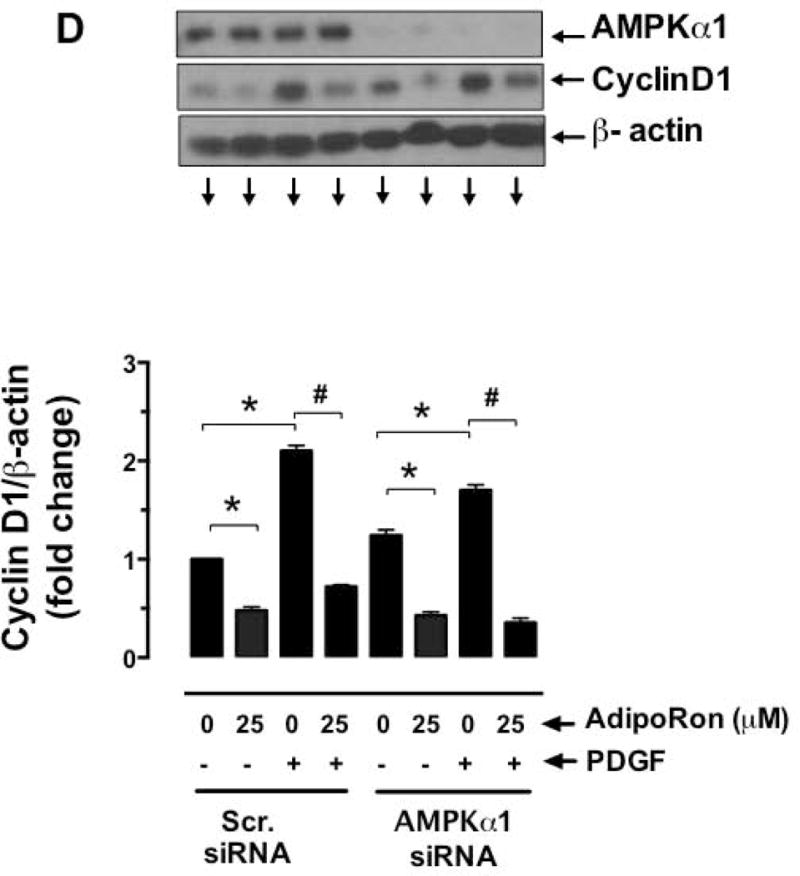
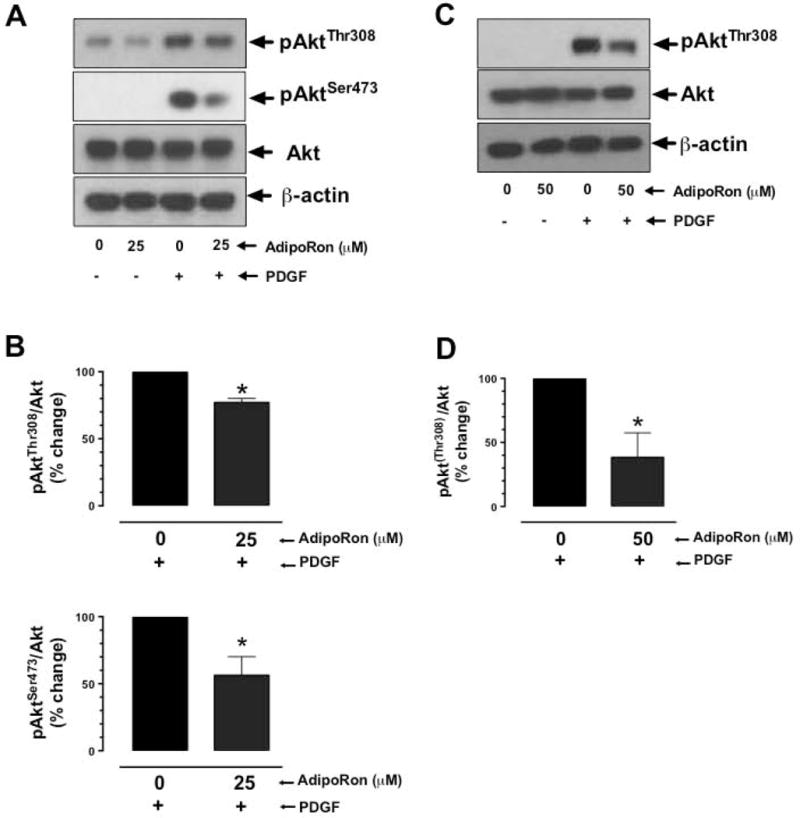
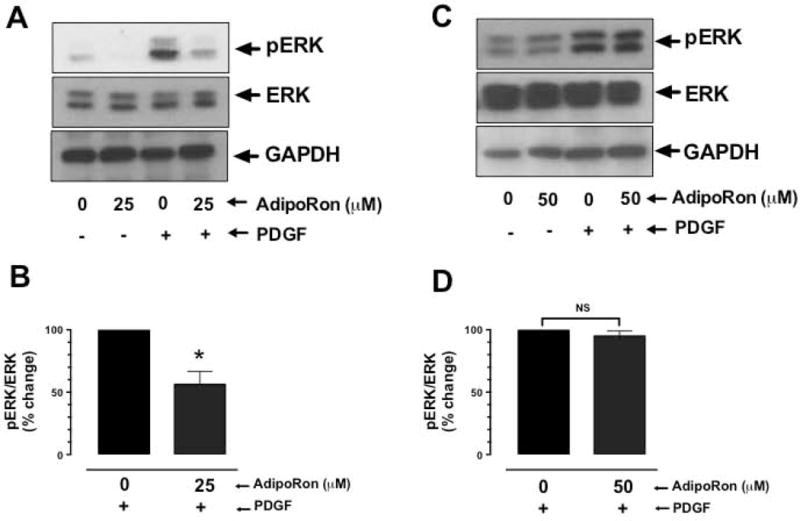
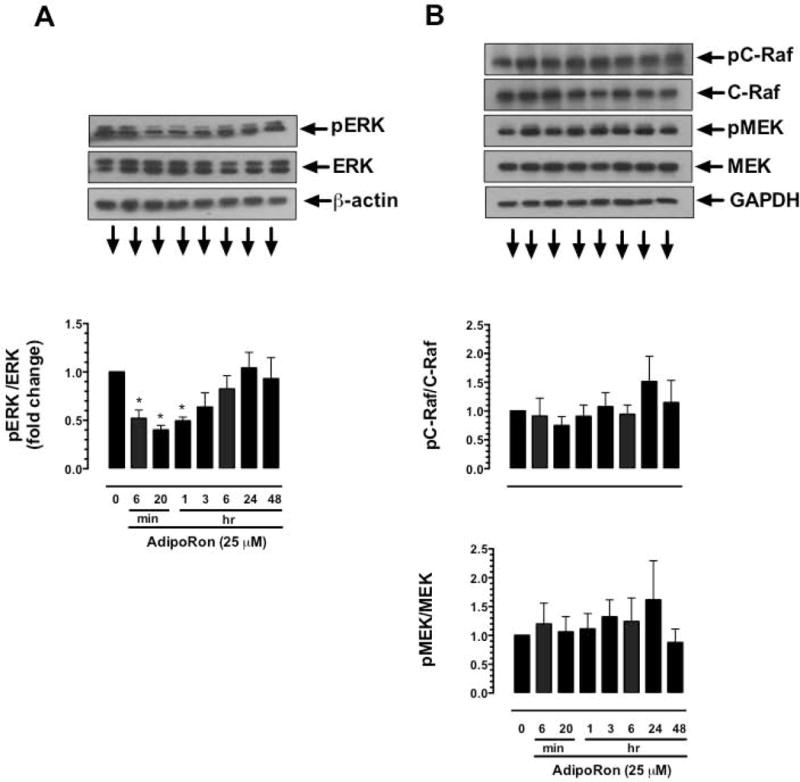
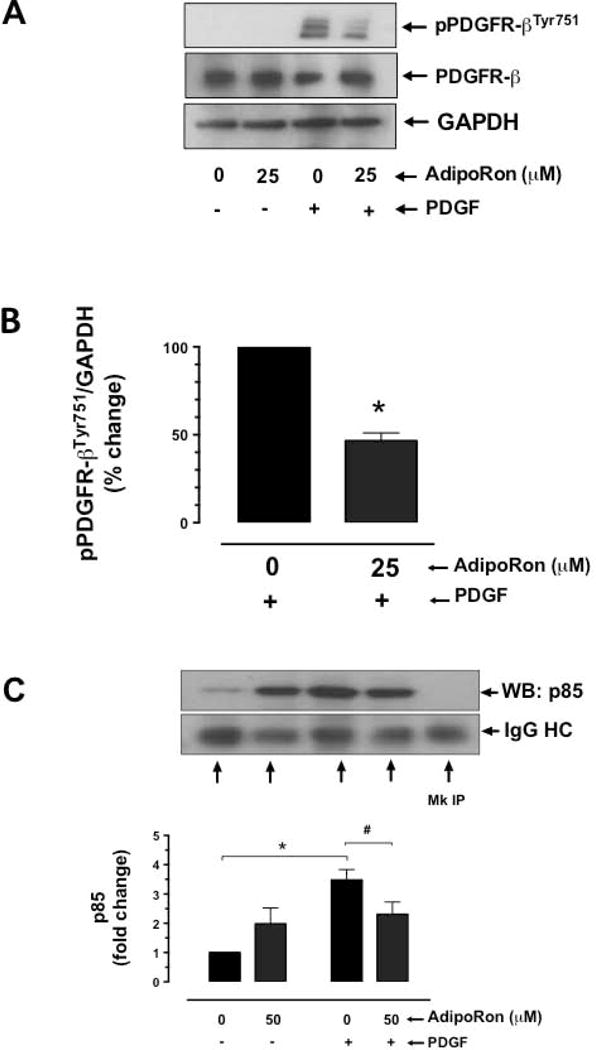
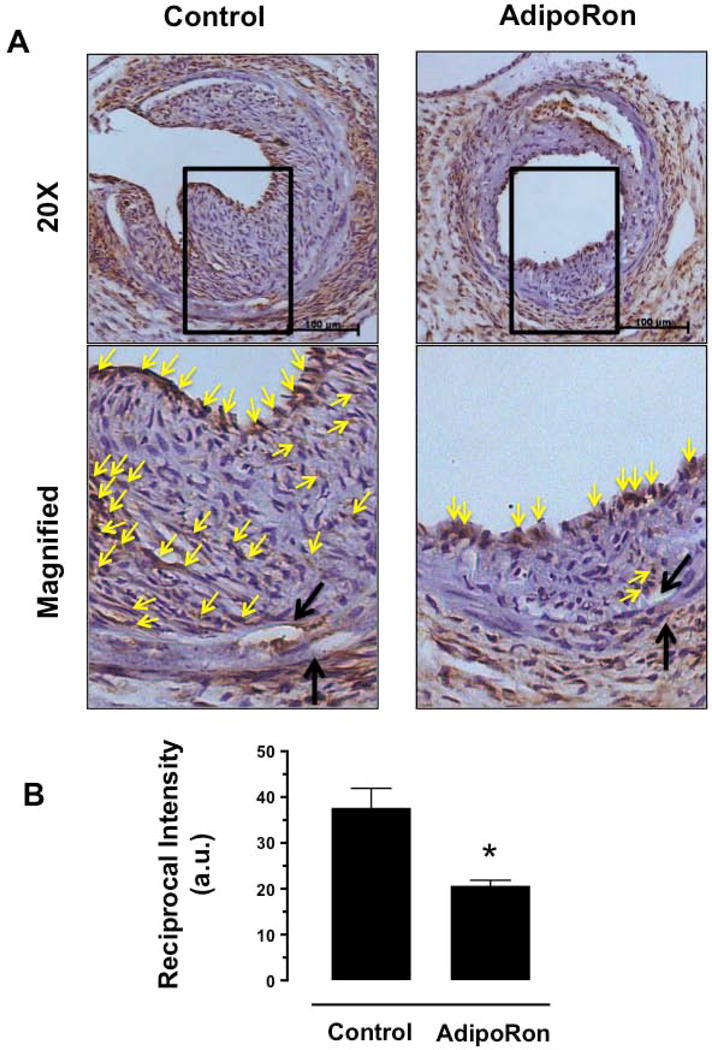
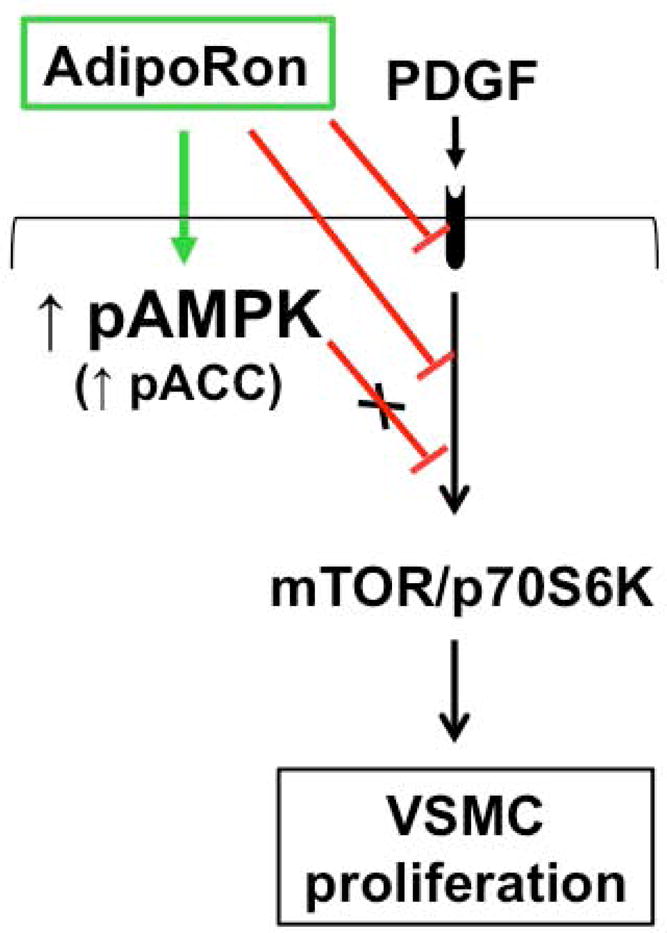
Hypoadiponectinemia is associated with an increased risk of coronary artery disease. Although adiponectin replenishment mitigates neointimal hyperplasia and atherosclerosis in mouse models, adiponectin therapy has been hampered in a clinical setting due to its large molecular size. Recent studies demonstrate that AdipoRon (a small-molecule adiponectin receptor agonist) improves glycemic control in type 2 diabetic mice and attenuates postischemic cardiac injury in adiponectin-deficient mice, in part, through activation of AMP-activated protein kinase (AMPK). To date, it remains unknown as to whether AdipoRon regulates vascular smooth muscle cell (VSMC) proliferation, which plays a major role in neointima formation. In the present study, oral administration of AdipoRon (50mg/kg) in C57BL/6J mice significantly diminished arterial injury-induced neointima formation by ∼57%. Under in vitro conditions, AdipoRon treatment led to significant inhibition of platelet-derived growth factor (PDGF)-induced VSMC proliferation, DNA synthesis, and cyclin D1 expression. While AdipoRon induced a rapid and sustained activation of AMPK, it also diminished basal and PDGF-induced phosphorylation of mTOR and its downstream targets, including p70S6K/S6 and 4E-BP1. However, siRNA-mediated AMPK downregulation showed persistent inhibition of p70S6K/S6 and 4E-BP1 phosphorylation, indicating AMPK-independent effects for AdipoRon inhibition of mTOR signaling. In addition, AdipoRon treatment resulted in a sustained and transient decrease in PDGF-induced phosphorylation of Akt and ERK, respectively. Furthermore, PDGF receptor-β tyrosine phosphorylation, which controls the phosphorylation state of Akt and ERK, was diminished upon AdipoRon treatment. Together, the present findings suggest that orally-administered AdipoRon has the potential to limit restenosis after angioplasty by targeting mTOR signaling independent of AMPK activation.

Keywords: AMPK; AdipoRon; Arterial injury; PDGF; Vascular smooth muscle cells; mTOR.


Conflict of interest statement

Conflict of Interest

The authors declare no conflicts of interest.

Figures

Fig. 1
Fig. 1
Effects of AdipoRon on injury-induced neointima formation in mouse femoral artery. AdipoRon was administered orally (50 mg/Kg) a day before femoral artery injury and for the following 21 days until sacrifice. Femoral artery sections from AdipoRon- and vehicle-treated (Control) mice were then subjected to: A) Hematoxylin and Eosin (H&E); and B) Elastic Van Gieson (EVG) staining. The arrows indicate internal and external elastic laminae; scale bars represent 100 μm. C) Morphometric analyses of injured femoral arteries that include intima/media ratio and intimal area. The data shown are the means ± SEM. * p < 0.05; n = 5 to 7 mice/group.
Fig. 1
Fig. 1
Effects of AdipoRon on injury-induced neointima formation in mouse femoral artery. AdipoRon was administered orally (50 mg/Kg) a day before femoral artery injury and for the following 21 days until sacrifice. Femoral artery sections from AdipoRon- and vehicle-treated (Control) mice were then subjected to: A) Hematoxylin and Eosin (H&E); and B) Elastic Van Gieson (EVG) staining. The arrows indicate internal and external elastic laminae; scale bars represent 100 μm. C) Morphometric analyses of injured femoral arteries that include intima/media ratio and intimal area. The data shown are the means ± SEM. * p < 0.05; n = 5 to 7 mice/group.
Fig. 2
Fig. 2
Effects of AdipoRon on smooth muscle α-actin and Ki-67 immunoreactivity in the injured femoral artery. Confocal immunofluorescence analyses show the images for A) smooth muscle (SM) α-actin and B) Ki-67 (in red). The representative images for nuclei (DAPI, blue), elastin autofluorescence (laminae, green), and merged staining are also shown. The arrows indicate internal and external elastic laminae; scale bars represent 100 μm.
Fig. 2
Fig. 2
Effects of AdipoRon on smooth muscle α-actin and Ki-67 immunoreactivity in the injured femoral artery. Confocal immunofluorescence analyses show the images for A) smooth muscle (SM) α-actin and B) Ki-67 (in red). The representative images for nuclei (DAPI, blue), elastin autofluorescence (laminae, green), and merged staining are also shown. The arrows indicate internal and external elastic laminae; scale bars represent 100 μm.
Fig. 3
Fig. 3
Effects of AdipoRon on basal and PDGF-induced VSMC proliferation. Serum-deprived VSMCs were incubated with: A) increasing concentrations of AdipoRon (5 to 100 μM) for 96 hr to determine the changes in Alamar blue fluorescence (n = 8); B) AdipoRon (5 to 100 μM) for 30 min followed by exposure to PDGF (30 ng/ml) for 96 hr to determine the changes in cell counts (n = 5); C) AdipoRon (50 μM) for 30 min followed by exposure to PDGF (30 ng/ml) for 24 hr to determine the changes in DNA synthesis (n=3); and D) AdipoRon (25 μM) for 30 min followed by exposure to PDGF (30 ng/ml) for 48 hr to determine the changes in cyclin D1 expression (n = 5). β-actin was used as an internal control. The data shown are the means ± SEM. *, # p < 0.05 compared with control (− PDGF and/or 0 μM AdipoRon) or PDGF (+ PDGF and 0 μM AdipoRon), respectively, using one-way ANOVA (A) or two-way ANOVA (B, C and D) followed by Bonferroni multiple comparisons test.
Fig. 4
Fig. 4
Concentration- and time dependent- effects of AdipoRon on the phosphorylation of AMPK, ACC, and S6 in VSMCs. Serum-deprived VSMCs were incubated with: A-B) increasing concentrations of AdipoRon (5 to 100 μM) for 48 hr; or C-D) a fixed concentration of AdipoRon (25 μM) at the indicated time intervals. VSMC lysates were then subjected to immunoblot analysis using primary antibodies specific for pAMPKThr172, AMPK, pACC, ACC, pS6 and S6. β-actin was used as internal control. The data shown in the bar graphs are the means ± SEM. * p < 0.05 compared with control (0 μM AdipoRon) using one-way ANOVA (B) or repeated measures one-way ANOVA (D) followed by Bonferroni multiple comparisons test (n = 3–5).
Fig. 5
Fig. 5
Effects of AdipoRon on basal and PDGF-induced phosphorylation of mTOR, p70S6K, S6, and 4E-BP1 in VSMCs. A-B) Serum-deprived VSMCs were incubated with AdipoRon (25 μM) for 3 hr followed by stimulation with PDGF (30 ng/ml) for 6 min. VSMC lysates were subjected to immunoblot analysis using primary antibodies specific for pmTORSer2448, mTOR, pp70S6K, p70S6K, pS6, S6, p4E-BP1 and 4E-BP1. GAPDH was used as an internal control. The data shown in the bar graphs are the means ± SEM. *, # p < 0.05 compared with control (− PDGF and 0 μM AdipoRon) or PDGF (+ PDGF and 0 μM AdipoRon), respectively, using two-way ANOVA followed by Bonferroni multiple comparisons test (n = 3).
Fig. 6
Fig. 6
Effects of AMPKα1 downregulation on AdipoRon-mediated changes in basal and PDGF-induced mTOR signaling and cyclin D1 expression in VSMCs. VSMCs were transfected with scrambled (Scr.) or AMPKα1 siRNA and maintained in culture for 48 hr. Subsequently, serum-deprived VSMCs were incubated with A-C) AdipoRon (25 μM) for 3 hr followed by stimulation with PDGF (30 ng/ml) for 6 min; or D) Adiporon (25 μM) for 30 min followed by exposure to PDGF (30 ng/ml) for 48 hr. VSMC lysates were then subjected to immunoblot analysis using the primary antibodies specific for AMPKα1, pp70S6K, p70S6K, pS6, S6, p4E-BP1, 4E-BP1 and cyclin D1. β-actin was used as internal control. The data shown in the bar graphs are the means ± SEM. * p < 0.05 compared with control (− PDGF and 0 μM AdipoRon) [C and D] or Scr. siRNA (B). # p < 0.05 compared with PDGF (+ PDGF and 0 μM AdipoRon) [C and D]. Statistical significance was determined by applying unpaired student t test (B) or two-way ANOVA followed by Bonferroni multiple comparisons test (C and D) (n = 3).
Fig. 6
Fig. 6
Effects of AMPKα1 downregulation on AdipoRon-mediated changes in basal and PDGF-induced mTOR signaling and cyclin D1 expression in VSMCs. VSMCs were transfected with scrambled (Scr.) or AMPKα1 siRNA and maintained in culture for 48 hr. Subsequently, serum-deprived VSMCs were incubated with A-C) AdipoRon (25 μM) for 3 hr followed by stimulation with PDGF (30 ng/ml) for 6 min; or D) Adiporon (25 μM) for 30 min followed by exposure to PDGF (30 ng/ml) for 48 hr. VSMC lysates were then subjected to immunoblot analysis using the primary antibodies specific for AMPKα1, pp70S6K, p70S6K, pS6, S6, p4E-BP1, 4E-BP1 and cyclin D1. β-actin was used as internal control. The data shown in the bar graphs are the means ± SEM. * p < 0.05 compared with control (− PDGF and 0 μM AdipoRon) [C and D] or Scr. siRNA (B). # p < 0.05 compared with PDGF (+ PDGF and 0 μM AdipoRon) [C and D]. Statistical significance was determined by applying unpaired student t test (B) or two-way ANOVA followed by Bonferroni multiple comparisons test (C and D) (n = 3).
Fig. 7
Fig. 7
Effects of AdipoRon on basal and PDGF-induced phosphorylation of Akt in VSMCs. Serum-deprived VSMCs were incubated with: A-B) AdipoRon (25 μM) for 3 hr or C-D) AdipoRon (50 μM) for 48 hr followed by stimulation with PDGF (30 ng/ml) for 6 min. VSMC lysates were subjected to immunoblot analysis using primary antibody specific for pAktSer473, pAktThr308 and Akt. β-actin was used as an internal control. The data shown in the bar graphs are the means ± SEM. * p < 0.05 using unpaired student t test (n = 3).
Fig. 8
Fig. 8
Effects of AdipoRon on basal and PDGF-induced phosphorylation of ERK in VSMCs. Serum-deprived VSMCs were incubated with: A-B) AdipoRon (25 μM) for 3 hr or C-D) AdipoRon (50 μM) for 48 hr followed by stimulation with PDGF (30 ng/ml) for 6 min. VSMC lysates were subjected to immunoblot analysis using primary antibodies specific for pERK and ERK. GAPDH was used as an internal control. The data shown in the bar graphs are the means ± SEM. * p < 0.05 using unpaired student t test; NS, not significant (n = 3).
Fig. 9
Fig. 9
Time-dependent effects of AdipoRon on the phosphorylation of ERK, C-Raf, and MEK in VSMCs. Serum-deprived VSMCs were incubated with AdipoRon (25 μM) at increasing time intervals (6 min to 48 hr). VSMC lysates were subjected to immunoblot analysis using primary antibody specific for A) pERK and ERK or B) pC-Raf and C-Raf or pMEK and MEK. β-actin or GAPDH was used as internal controls. The data shown in the bar graphs are the means ± SEM. * p < 0.05 using repeated measures one-way ANOVA followed by Bonferroni multiple comparisons test (n = 3).
Fig. 10
Fig. 10
Effect of AdipoRon on PDGFR-β tyrosine phosphorylation and its association with p85 adaptor subunit of PI 3-kinase in VSMCs. A-B) Serum-deprived VSMCs were incubated with AdipoRon (25 μM) for 3 hr followed by stimulation with PDGF (30 ng/ml) for 6 min. VSMC lysates were then subjected to immunoblot analysis using primary antibodies specific for p-PDGFR-βTyr751 and PDGFR-β. GAPDH was used as internal control. C) Serum-deprived VSMCs were incubated with AdipoRon (50 μM) for 48 hr followed by stimulation with PDGF (30 ng/ml) for 2 min. The cell lysates were subjected to immunoprecipitation (IP) using PDGFR-β primary antibody and then probed with p85 primary antibody. The data shown in the bar graphs are the means ± SEM. *, # p < 0.05 compared with control (− PDGF and/or 0 μM AdipoRon) or PDGF (+ PDGF and 0 μM AdipoRon), respectively, using unpaired student t test (B) or two-way ANOVA followed by Bonferroni multiple comparisons test (C) [n = 3]. MC = Mock, HC = heavy chain.
Fig. 11
Fig. 11
Effects of AdipoRon on the phosphorylation state of S6 ribosomal protein in the injury femoral artery. The femoral artery sections from AdipoRon-treated and control mice were subjected to immunohistochemical analysis using primary antibody specific for pS6. A) The representative images of pS6 immunoreactivity were visualized using diaminobenzidine (DAB) staining at a magnification 20x. The scale bars represent 100 μm (upper panel). Black arrows indicate internal and external elastic laminae; yellow arrows indicate pS6 (lower panel). B) The intensity of pS6 staining was quantified and expressed as reciprocal intensities. The data shown in the bar graph are the means ± SEM. * p < 0.05 using unpaired t-test (n = 3). a. u. = arbitrary units.
Fig. 12
Fig. 12
AdipoRon inhibits VSMC proliferation through AMPK-independent inhibition of mTOR/p70S6K signaling. AdipoRon activates AMPK and inhibits basal and PDGF-induced mTOR/p70S6K signaling. AMPK downregulation by target-specific siRNA shows persistent inhibition of mTOR signaling in VSMCs.

Similar articles

Cited by

References

    1. Hotta K, Funahashi T, Bodkin NL, Ortmeyer HK, Arita Y, Hansen BC, Matsuzawa Y. Circulating concentrations of the adipocyte protein adiponectin are decreased in parallel with reduced insulin sensitivity during the progression to type 2 diabetes in rhesus monkeys. Diabetes. 2001;50:1126–1133. - PubMed
    1. Otsuka F, Sugiyama S, Kojima S, Maruyoshi H, Funahashi T, Matsui K, Sakamoto T, Yoshimura M, Kimura K, Umemura S, Ogawa H. Plasma adiponectin levels are associated with coronary lesion complexity in men with coronary artery disease. J Am Coll Cardiol. 2006;48:1155–1162. - PubMed
    1. von Eynatten M, Humpert PM, Bluemm A, Lepper PM, Hamann A, Allolio B, Nawroth PP, Bierhaus A, Dugi KA. High-molecular weight adiponectin is independently associated with the extent of coronary artery disease in men. Atherosclerosis. 2008;199:123–128. - PubMed
    1. Kitta Y, Takano H, Nakamura T, Kodama Y, Umetani K, Fujioka D, Saito Y, Kawabata K, Obata JE, Mende A, Kobayashi T, Kugiyama K. Low adiponectin levels predict late in-stent restenosis after bare metal stenting in native coronary arteries. Int J Cardiol. 2008;131:78–82. - PubMed
    1. Kubota N, Terauchi Y, Yamauchi T, Kubota T, Moroi M, Matsui J, Eto K, Yamashita T, Kamon J, Satoh H, Yano W, Froguel P, Nagai R, Kimura S, Kadowaki T, Noda T. Disruption of adiponectin causes insulin resistance and neointimal formation. J Biol Chem. 2002;277:25863–25866. - PubMed

MeSH terms