. 2017 Mar 22;4(3):330-343.e5.
doi: 10.1016/j.cels.2017.01.012. Epub 2017 Feb 22.

Iterative Modeling Reveals Evidence of Sequential Transcriptional Control Mechanisms

Affiliations

Iterative Modeling Reveals Evidence of Sequential Transcriptional Control Mechanisms

Christine S Cheng et al. Cell Syst. .

Abstract

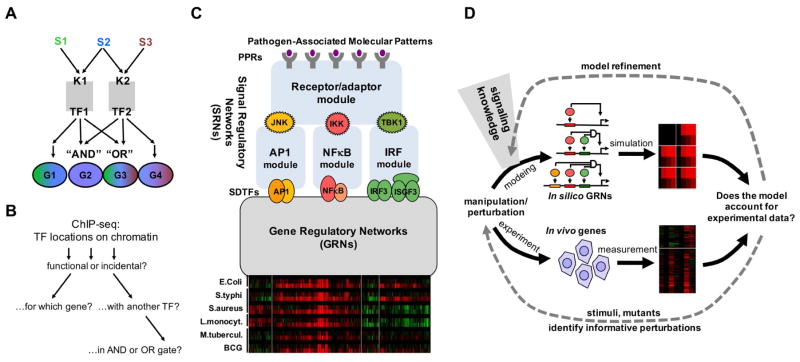
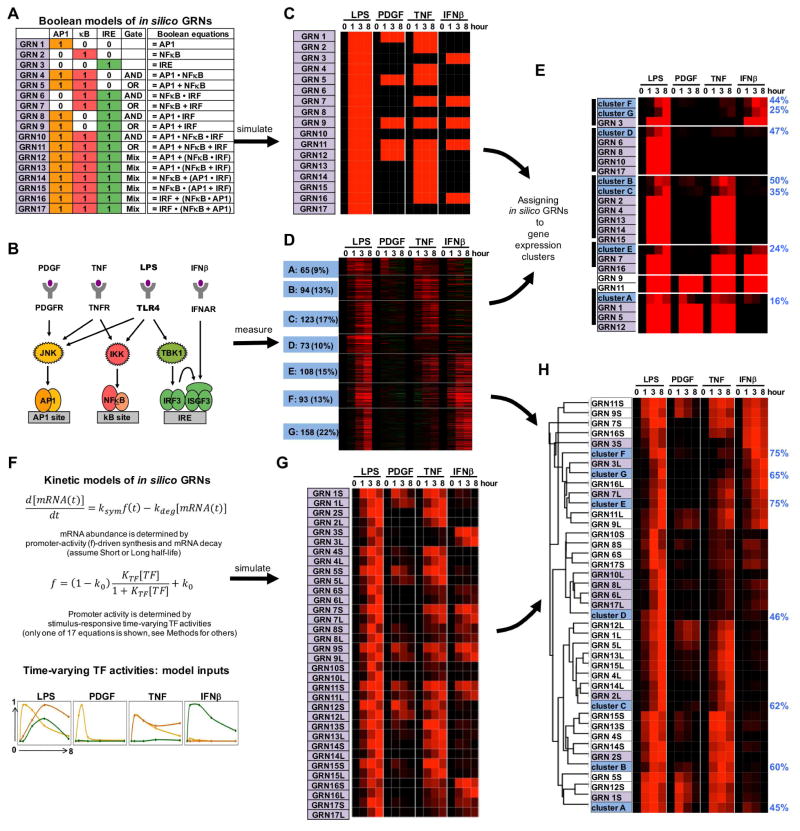
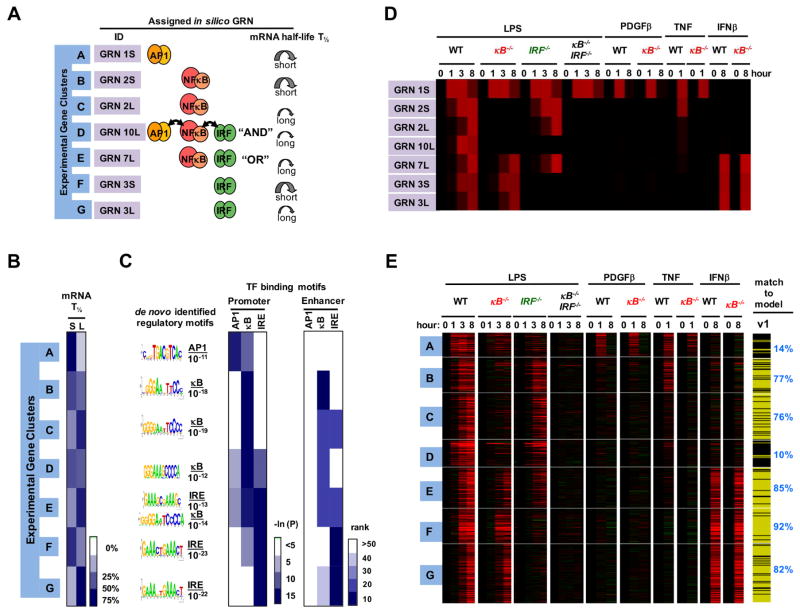
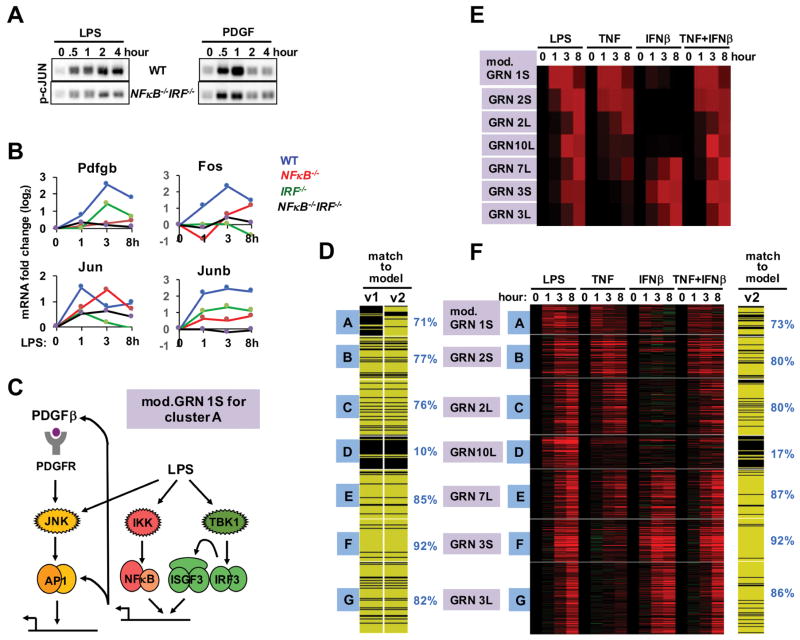
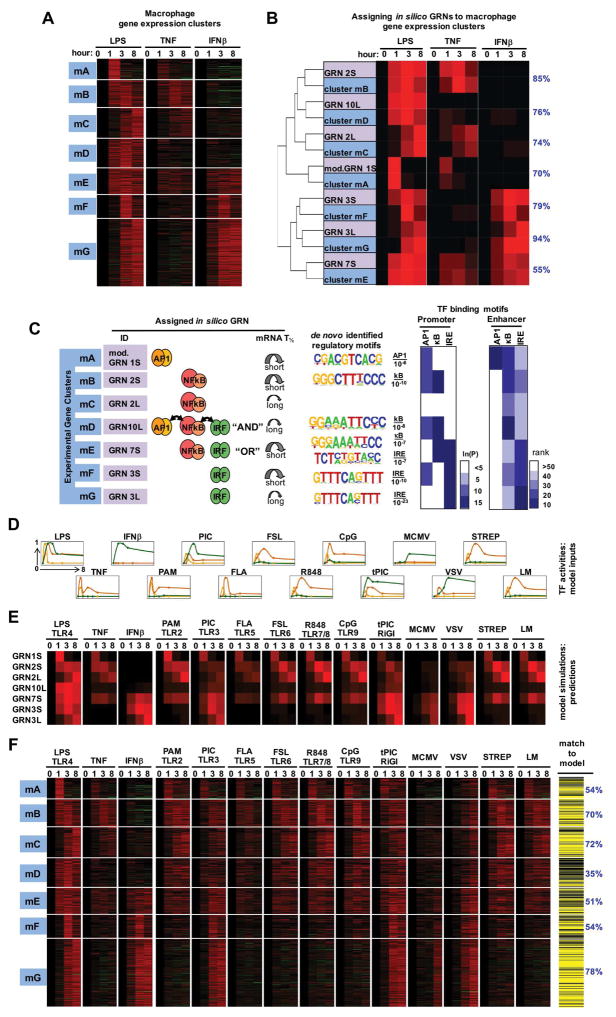
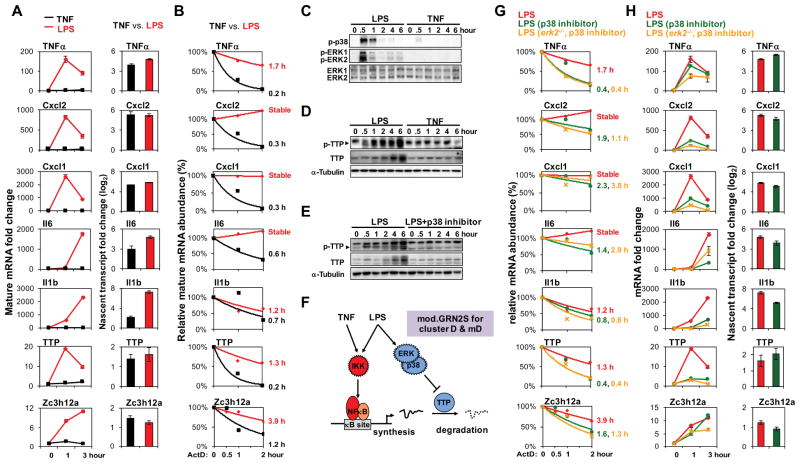
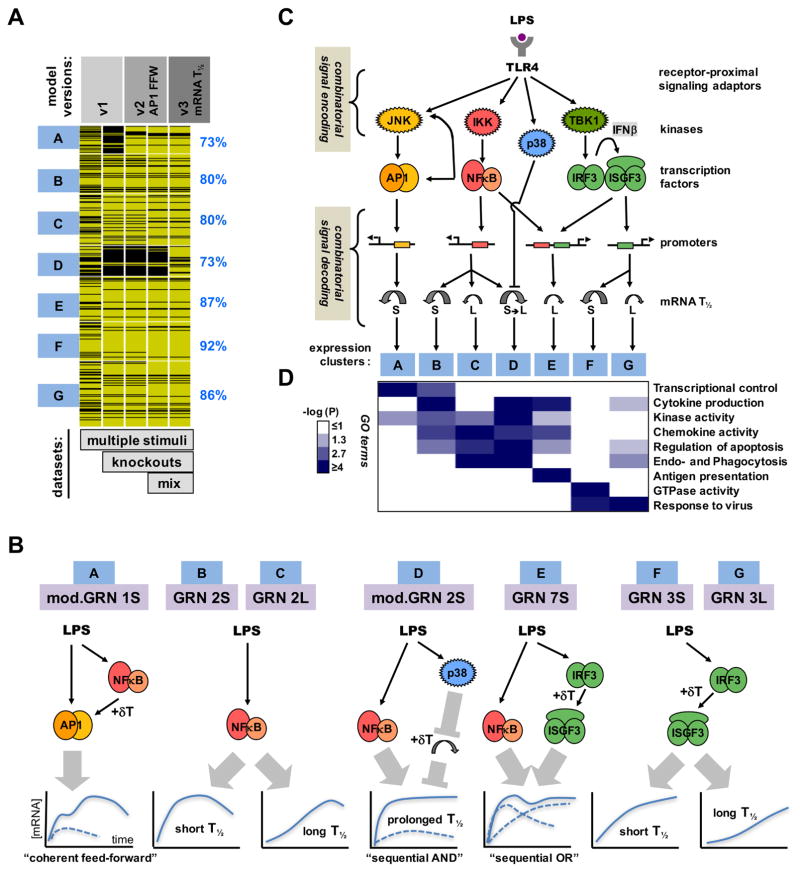
Combinatorial control of gene expression is presumed to be mediated by molecular interactions between coincident transcription factors (TFs). While information on the genome-wide locations of TFs is available, the genes they regulate and whether they function combinatorially often remain open questions. Here, we developed a mechanistic, rather than statistical, modeling approach to elucidate TF control logic from gene expression data. Applying this approach to hundreds of genes in 85 datasets measuring the transcriptional responses of murine fibroblasts and macrophages to cytokines and pathogens, we found that stimulus-responsive TFs generally function sequentially in logical OR gates or singly. Logical AND gates were found between NF-κB-responsive mRNA synthesis and MAPKp38-responsive control of mRNA half-life, but not between temporally coincident TFs. Our analyses identified the functional target genes of each of the pathogen-responsive TFs and prompt a revision of the conceptual underpinnings of combinatorial control of gene expression to include sequentially acting molecular mechanisms that govern mRNA synthesis and decay.

Keywords: combinatorial control; gene expression; gene regulatory logic; mathematical modeling; pathogen responses.


Figures

Figure 1
Figure 1. Dissecting the combinatorial control logic underlying the pathogen-responsive transcriptome
(A) Schematic of how combinatorial control of kinases (K) signal-dependent transcription factors (TFs) can mediate stimulus (S)-specific gene (G) expression programs. In this example the presence of AND and OR gates allows two TFs to mediate four distinct stimulus-responsive gene expression programs. (B) While ChIP-seq studies enable genome-wide location analysis of TFs, it remains challenging to determine whether these binding events are functional or incidental, which gene or transcription start site they may regulate, and whether they function in conjunction with other TFs nearby or at a distance, in potential AND or OR gates. (C) Schematic of key signal regulatory networks (SRNs) that control pathogen-responsive gene expression programs, exemplified by clusters of co-regulated genes (re-analysis of data by (Nau et al., 2002)). Prior studies of these SRNs have resulted in computational models of the molecular mechanisms (blue boxes) that recapitulate observed stimulus-responsive activation of the signal-dependent transcription factors (SDTFs) AP1, NFκB, and IRF. How these SDTF activities are interpreted to produce pathogen responsive gene expression programs is determined by the gene regulatory networks (GRNs), for which no mechanistic model has been developed (grey box). (D) Schematic of the workflow for iteratively refining a mathematical model that recapitulates pathogen-responsive inflammatory and immune gene expression programs. Model formulations of increasing complexity are constructed and refined based on prior knowledge of the signaling network, and assessed by comparison to experimental data. With each round of simulation and experimentation of additional conditions the model is iteratively refined.
Figure 2
Figure 2. Assigning combinatorial GRN models to endotoxin-responsive gene expression clusters
(A) Combinatorial control by three pathogen responsive SDTFs AP1, NFκB, and IRF described by Boolean logic gates. Considering AND and OR gates, 17 possible GRNs (indicated in purple) can be enumerated. (B) Knowledge of the pathogen-responsive SRNs indicates that subsets of pathogen-responsive SDTFs may be activated by cytokines (TNF, IFNβ) and growth factor (PDGF). (C) Heatmap of the gene expression patterns predicted by the Boolean GRN models of panel (A) responding to the SDTF-inducing stimuli schematized in panel (B). (D) Heatmap of experimental mRNA expression data of 714 genes inducible by endoxin in MEFs. MEFs were stimulated with PDGFβ (50 ng/ml), TNF (10 ng/ml), IFNβ (500 units/ml) and LPS (100 ng/ml) for the indicated times. Expression fold changes (log2) were analyzed by K-means clustering following row-normalization, yielding 7 clusters of co-regulated genes (A to G, indicated in blue). Data is representative of three experiments in which all conditions were performed in parallel. (E) Hierarchical clustering of experimental cluster average profiles (D) and predicted expression profiles of the Boolean GRN model (C). Many Boolean GRN models lead to indistinguishable expression profiles hindering the assignment of a GRN model to experimentally determined gene expression clusters. Further, the percentage (blue on right) of in vivo gene expression profiles that are accounted for by the assigned in silico GRN (Spearman rank correlation-based “good fit” criterion. See methods) is generally low. (F) Formulation of 17 kinetic in silico models of potential GRNs with two mRNA half-lives. Promoter activity f is a function of thermodynamic interactions of TFs with their cognate binding sites; combinations of these may form AND or OR gates (figure S1) (Bintu et al., 2005a). As TF abundances change over time (bottom), promoter activity and the resulting mRNA synthesis rate ksyn.f will change accordingly. Abundances of mature mRNAs may then be calculated with a differential equation accounting for mRNA synthesis and decay. (G) Heatmap of the predicted expression profiles of the kinetic GRN models (panel F) in response to the SDTF-inducing stimuli (panel B). Each GRN is represented twice with a short (S) or long (L) mRNA half-life (1 vs. 6 hrs). Simulations employed SDTF activity profiles measured biochemically (figure S2). (H) Hierarchical clustering of experimental average profiles (D) and predicted expression profiles of the GRN models (G). Best fit GRNs are highlighted in purple, and the percentage of in vivo gene expression profiles that are accounted for by the assigned in silico GRN (Spearman correlation-based “good fit” criteria. See methods) is indicated in blue on the right. GRNs shaded in purple best match the experimental data thus far.
Figure 3
Figure 3. Testing predicted physical and functional properties of GRNs
(A) Summary of GRN assignments. For each in vivo gene expression cluster the assigned in silico GRN is shown in terms of associated TF logic gate architecture and fast or slow mRNA turnover rate (short or long half-life, T1/2). (B) Results of experimental genome-wide mRNA half-life measurements using Actinomycin D, represented by percentage of genes in each cluster that have short (S) (< 6 hr) or long (L) (≥ 6 hr) mRNA half-lives on the indicated white-blue scale. (C) De novo motif analyses identified the most highly enriched motifs (with indicated p-values) within −1.0 kb to 0.3 kb of transcriptional start sites. Similarly, the occurrence frequency of known motifs was evaluated from promoter regions as well as enhancers identified by the presence of H3K4me1 and absence of H3K4me3 peaks (ENCODE data). (D) In silico gene expression profiles predicted by kinetic model v1 for the indicated stimuli and knockout conditions. (E) Results from experimental genome-wide mRNA expression measurements to test the conditions simulated in (D). This dataset was obtained with primary wild-type (“WT”), IRF-deficient (ifnar−/−), NFκB-deficient (rela−/−crel−/−, rela−/−relb−/−crel−/−), and compound deficient (rela−/−crel−/−irf3−/−) MEFs stimulated with PDGFβ, TNF, IFNβ and LPS for 0, 1, 3 and 8 hours, as indicated. Whether the kinetic model v1 recapitulated the expression profile of each gene was assessed with the Spearman goodness of fit criterion and indicated on the right with yellow indicating passing and black not passing. This analysis indicated that model v1 does not well account for the expression profiles of gene clusters A and D.
Figure 4
Figure 4. A GRN involving coherent feedforward TF control
(A) AP1 activity is NFκB- and IRF-dependent. Immunoblot of p-c-Jun using cell extracts prepared from WT and NFκB/IRF compound deficient (rela−/−crel−/−irf3−/−) MEFs stimulated with LPS (left) or PDGF (right) for the indicated times (representative of four experiments). (B) Expression of PDGF and AP1 constituents is NFκB- and IRF-dependent. Microarray measurements of Pdgfb mRNA expression in WT (blue), NFκB-deficient (red, rela−/−crel−/−), IRF-deficient (green, ifnar−/−), or NFκB/IRF compound deficient (black, rela−/−crel−/−irf3−/−) MEFs stimulated with LPS (0.1 μg/ml) for 1, 3 and 8 hours were plotted as expression fold changes (log2) relative to unstimulated cells. (C) Schematic of the modified GRN 1S, which depicts that cluster A is controlled by AP1, but that AP1 activity requires NFκB and IRF by controlling autocrine PDGF and AP1 constituents, forming coherent feedforward loop. (D) Inclusion of interdependent TF control into model v2 increases the number of genes in cluster A that pass (yellow) the Spearman goodness of fit criterion. (E) Testing the validity of GRN10L assigned to cluster D. Heatmap of predicted gene expression profiles of TNF and IFNβ co-stimulation, using model v2. The model predicts that the AND-gate containing GRN10L (thought to control cluster D) is responsive to the co-stimulation condition. (F) Heatmap of experimental transcriptome data from wild-type MEFs in response to TNF and IFNβ co-stimulation at indicated times. Genes that passed (yellow lines) or did not pass (black lines) the goodness of fit criterion for model v2 including the co-stimulation dataset (percent of genes shown on the right). This analysis indicates that GRN10L does not represent the true regulatory logic underlying the expression control of cluster D.
Figure 5
Figure 5. Testing GRN models in predicting the transcriptomes of macrophages responding to diverse stimuli and pathogens
(A) Gene expression clusters of endotoxin-induced transcriptome dissected by cytokine stimuli TNF and IFNβ. Bone marrow-derived macrophages (BMDMs) were stimulated with 100 ng/ml LPS, 10 ng/ml TNF, and 100 U/ml IFNβ; isolated mRNA was subjected to RNA-seq. Expression profiles from 782 genes, induced by LPS ≥3 fold at least one timepoint, were subjected to k-means clustering. (B) Clusters of co-regulated genes were assigned best-matched GRNs by co-clustering GRN model outputs (using SDTF activity profiles as inputs) and the means of clusters mA - mG identified in (A). Shown on right in blue in the percentage of the in vivo gene expression profiles that are accounted for by the assigned in silico GRN (see methods). (C) Summary of GRN assignments. For each in vivo gene expression cluster the assigned in silico GRN is shown in terms of TF logic gate architectures and mRNA half-life. De novo motif analyses identified the most highly enriched motifs (with indicated p-values) within −1.0 kb to 0.3 kb from transcriptional start sites. Similarly, the occurrence frequency of known motifs was evaluated from promoter regions as well as enhancers identified by the presence of H3K4me1 and absence of H3K4me3 peaks (ENCODE data). (D) Measured SDTF activities in cells exposed to indicated stimuli and pathogens. Experimental data (table S2) is normalized to maximum. (E) Computational simulations using the indicated GRN models and the TF activities depicted in (D) used as inputs. (F) Testing GRN model predictions with new experimental datasets. Heatmap depicts the fold induction based on RNA-seq analysis of each of the 782 genes in each of the indicated are conditions. Genes that passed (yellow lines) or did not pass (black lines) the goodness of fit criterion (figure S5B) are shown on the right. Note that more than 50% of genes pass the Spearman fit score criterion in all clusters but mD (35%), to which the AND gate GRN10L was assigned.
Figure 6
Figure 6. A GRN governed by an AND gate of stimulus-responsive mRNA synthesis and half-life control
(A) Mature and nascent mRNA expression fold changes in BMDMs stimulated with TNF (10 ng/ml) or LPS (100 ng/ml). The shown data are representative of three independent experiments. The same stimulation conditions are used in all subsequent experiments. (B) mRNA half-life measurements using the synthesis inhibitor actinomycin D in BMDMs stimulated with TNF (black) or LPS (red) for 30 minutes. The underlying qRT-PCR data was representative of three independent experiments. All mRNA half-lives were calculated within a 50% standard error by exponential regression analysis. (C) Phospho-p38 (Thr180/Tyr182) and phospho-ERK1/ERK2 (Thr202/Tyr204) revealed by immunoblot of whole cell lysates prepared from stimulated BMDMs. ERK1 and ERK2 immunoblots are shown as loading controls. This is representative of three independent experiments performed by different individuals. (D) and (E) Phospho-TTP (arrowhead), TTP and α-Tubulin (loading control) were analyzed by immunoblotting of whole cell lysates prepared from stimulated BMDMs with and without a p38 inhibitor (2.5 μM, SB202190). This is representative of three independent experiments performed by different individuals. (F) A schematic of the AND gate between NFκB-driven transcription and LPS-specific activation of a p38/ERK- and TTP-dependent mRNA stabilization pathway. This is referred to as mod.GRN 2S, and its inclusion results in model v3. (G) mRNA half-life measurements as in (B) in wild-type and erk2−/− BMDMs stimulated with LPS (red) for 30 minutes or in the presence of p38 inhibitor (green for wild-type and yellow for erk2−/−). The shown data are representative of three independent experiments. (H) Mature and nascent mRNA expression fold changes in wild-type or erk2−/− BMDMs stimulated with LPS, in the absence (red) or presence of p38 inhibitor (green for wild-type and yellow for erk2−/−). The shown data are representative of three independent experiments.
Figure 7
Figure 7. Iterative modeling of pathogen-responsive GRNs reveals combinatorial control mediated by sequentially acting regulatory mechanisms
(A) Tracking the performance of iterative models with increasing datasets. Genes associated with expression clusters A to G passed (yellow lines) or did not pass (black lines) the Spearman goodness of fit criterion in successive GRN model versions and an increasing number of experimental “-omic” datasets generated in indicated perturbation studies, such as “multiple stimuli” (Figure 2), “knockouts” (Figure 3), and “mixed” stimuli (Figure 4). The fraction of genes that pass the goodness of fit Spearman correlation criterion for model v3 (including mod.GRN1S and mod.GRN2S) is shown on the right. (B) Schematics of the GRNs that govern expression of genes in clusters A to G in MEFs and macrophages. (Schematic expression profiles are indicated as a solid blue line for wild-type cells, or as dashed lines in cells lacking one of the modifying pathway.) Cluster A expression is driven by AP1 which is controlled by a “coherent feed-forward” gate involving NFκB-driven autocrine PDGF which introduces a delay relative to the direct activation pathway. Clusters B, C and D are NFκB-driven, but specificity is generated by distinct mRNA half-life control. LPS-responsive p38-mediated inhibition of mRNA decay combines with LPS-responsive NFκB-mediated mRNA synthesis to form a “sequential AND” gate in the GRN for cluster D. Cluster E is driven by NFκB and IRF, forming a “sequential OR” gate between a rapidly activated immediate-early TF (NFκB) and a delayed, protein-synthesis-dependent TF (ISGF3). Cluster F and G are ISGF3-driven, but specificity is generated by distinct mRNA decay rates. (C) A summary schematic of signal encoding and decoding via SRNs and GRNs, respectively. Combinatorially encoded signals are decoded not only by the promoter architecture of TF binding sites, but also by signal-responsive mRNA half-life control. (D) Gene expression clusters are associated with distinct physiological functions. Highly enriched gene ontology (GO) terms were evaluated based on -log10 p-values as indicated on the white-blue scale.

Similar articles

Cited by

References

    1. Almaden JV, Liu YC, Yang E, Otero DC, Birnbaum H, Davis-Turak J, Asagiri M, David M, Goldrath AW, Hoffmann A. B-cell survival and development controlled by the coordination of NF-kappaB family members RelB and cRel. Blood. 2016;127:1276–1286. - PMC - PubMed
    1. Alves BN, Tsui R, Almaden J, Shokhirev MN, Davis-Turak J, Fujimoto J, Birnbaum H, Ponomarenko J, Hoffmann A. IkappaBepsilon is a key regulator of B cell expansion by providing negative feedback on cRel and RelA in a stimulus-specific manner. J Immunol. 2014;192:3121–3132. - PMC - PubMed
    1. Amit I, Garber M, Chevrier N, Leite AP, Donner Y, Eisenhaure T, Guttman M, Grenier JK, Li W, Zuk O, et al. Unbiased reconstruction of a mammalian transcriptional network mediating pathogen responses. Science. 2009;326:257–263. - PMC - PubMed
    1. Arkin A, Ross J. Computational functions in biochemical reaction networks. Biophys J. 1994;67:560–578. - PMC - PubMed
    1. Basak S, Behar M, Hoffmann A. Lessons from mathematically modeling the NF-kappaB pathway. Immunol Rev. 2012;246:221–238. - PMC - PubMed

Publication types

MeSH terms

Substances