. 2017 Mar 22;4(3):344-356.e7.
doi: 10.1016/j.cels.2017.01.013. Epub 2017 Feb 22.

Permanganate/S1 Nuclease Footprinting Reveals Non-B DNA Structures with Regulatory Potential across a Mammalian Genome

Affiliations

Permanganate/S1 Nuclease Footprinting Reveals Non-B DNA Structures with Regulatory Potential across a Mammalian Genome

Fedor Kouzine et al. Cell Syst. .

Abstract

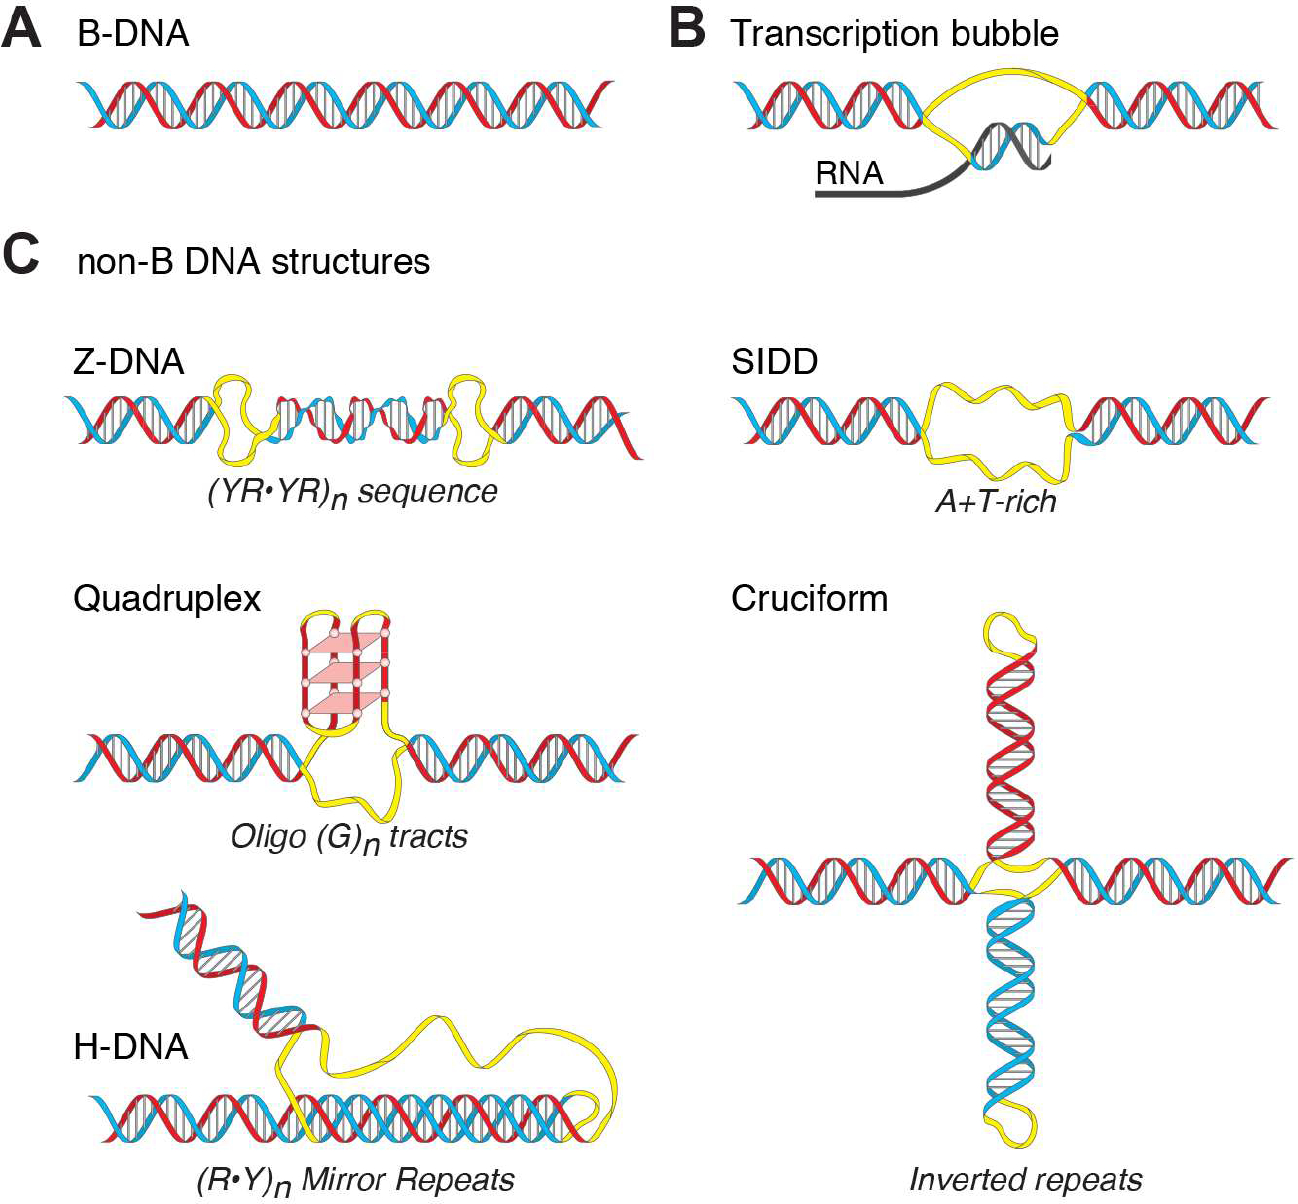
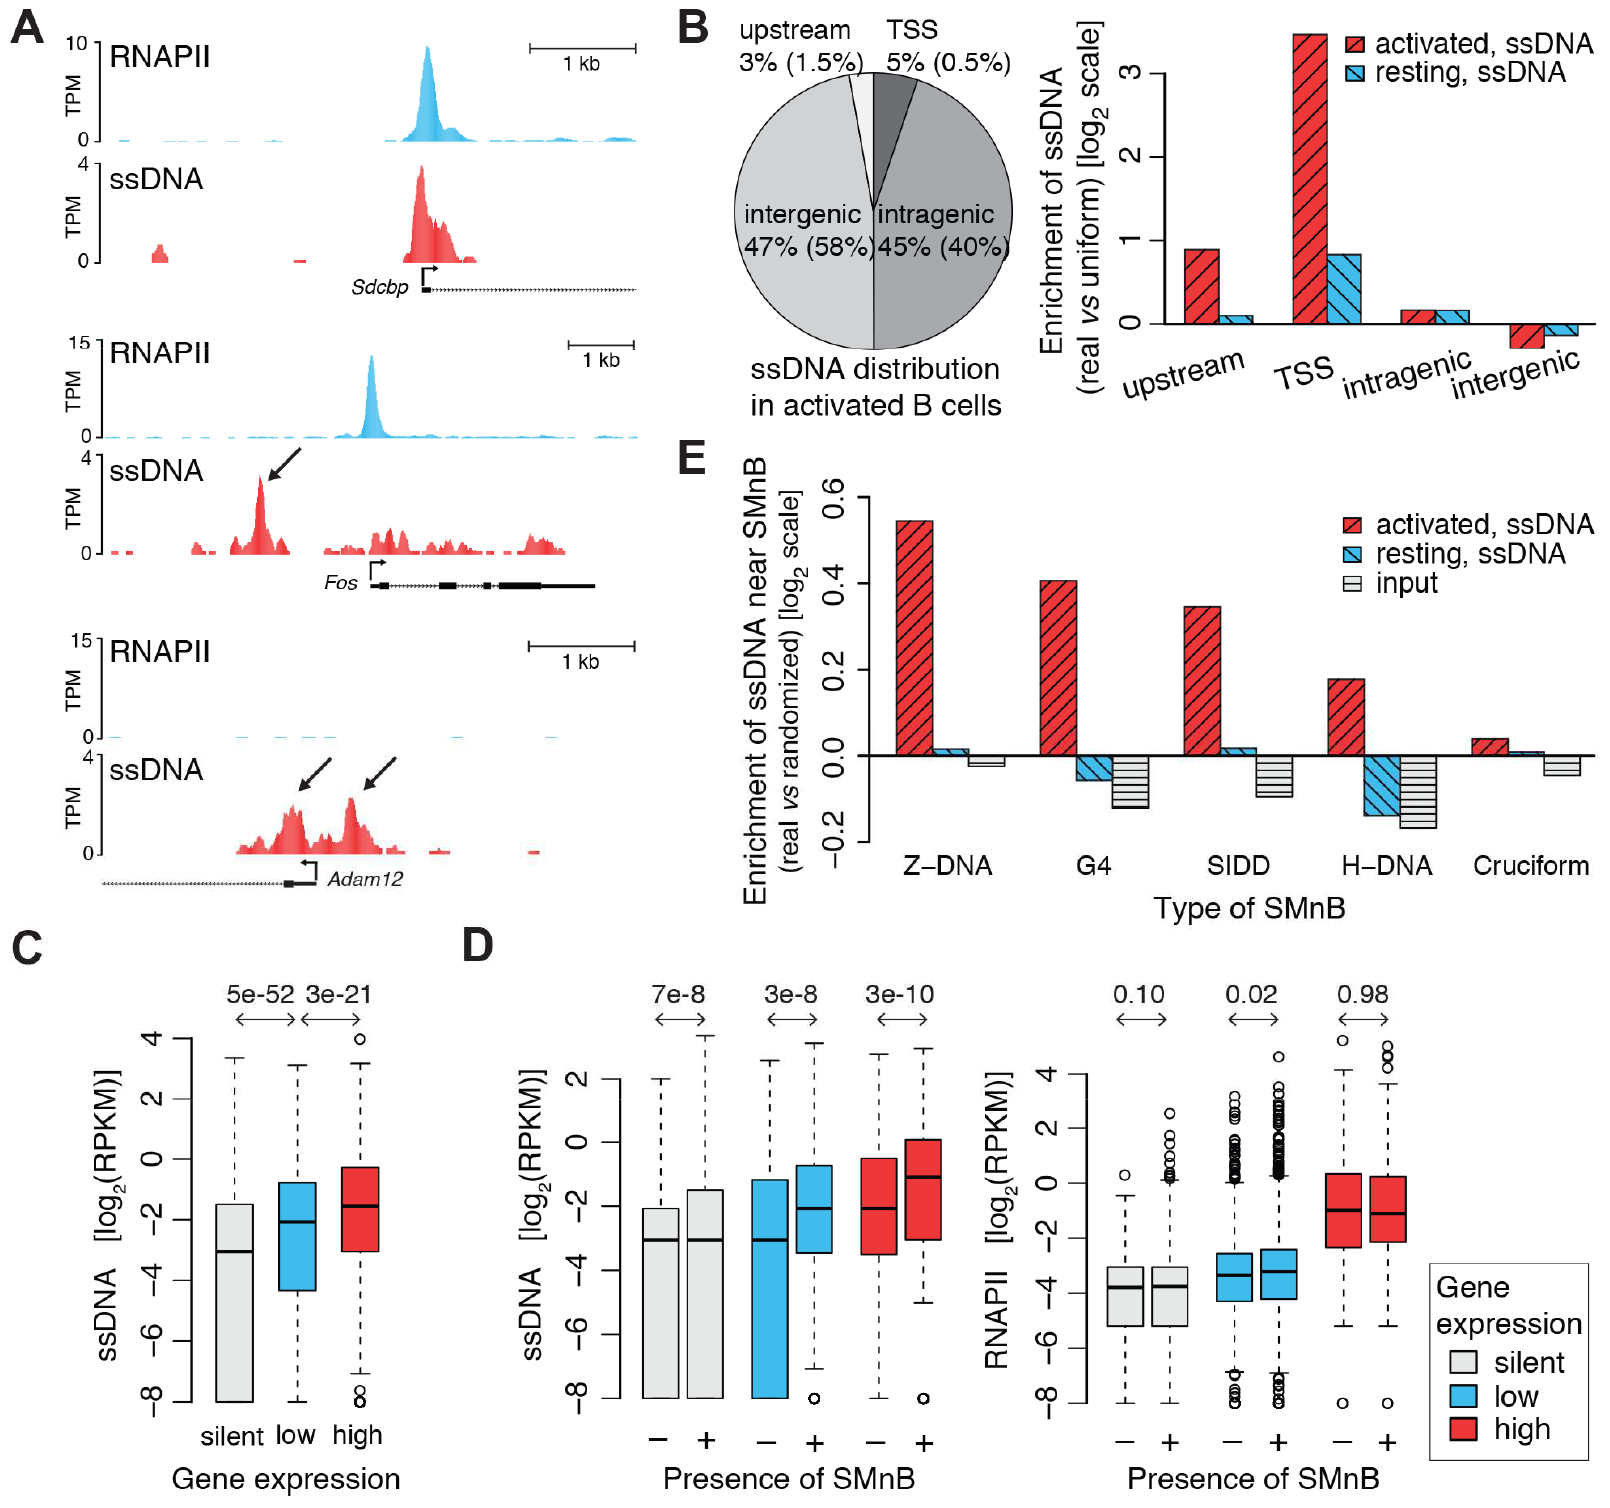
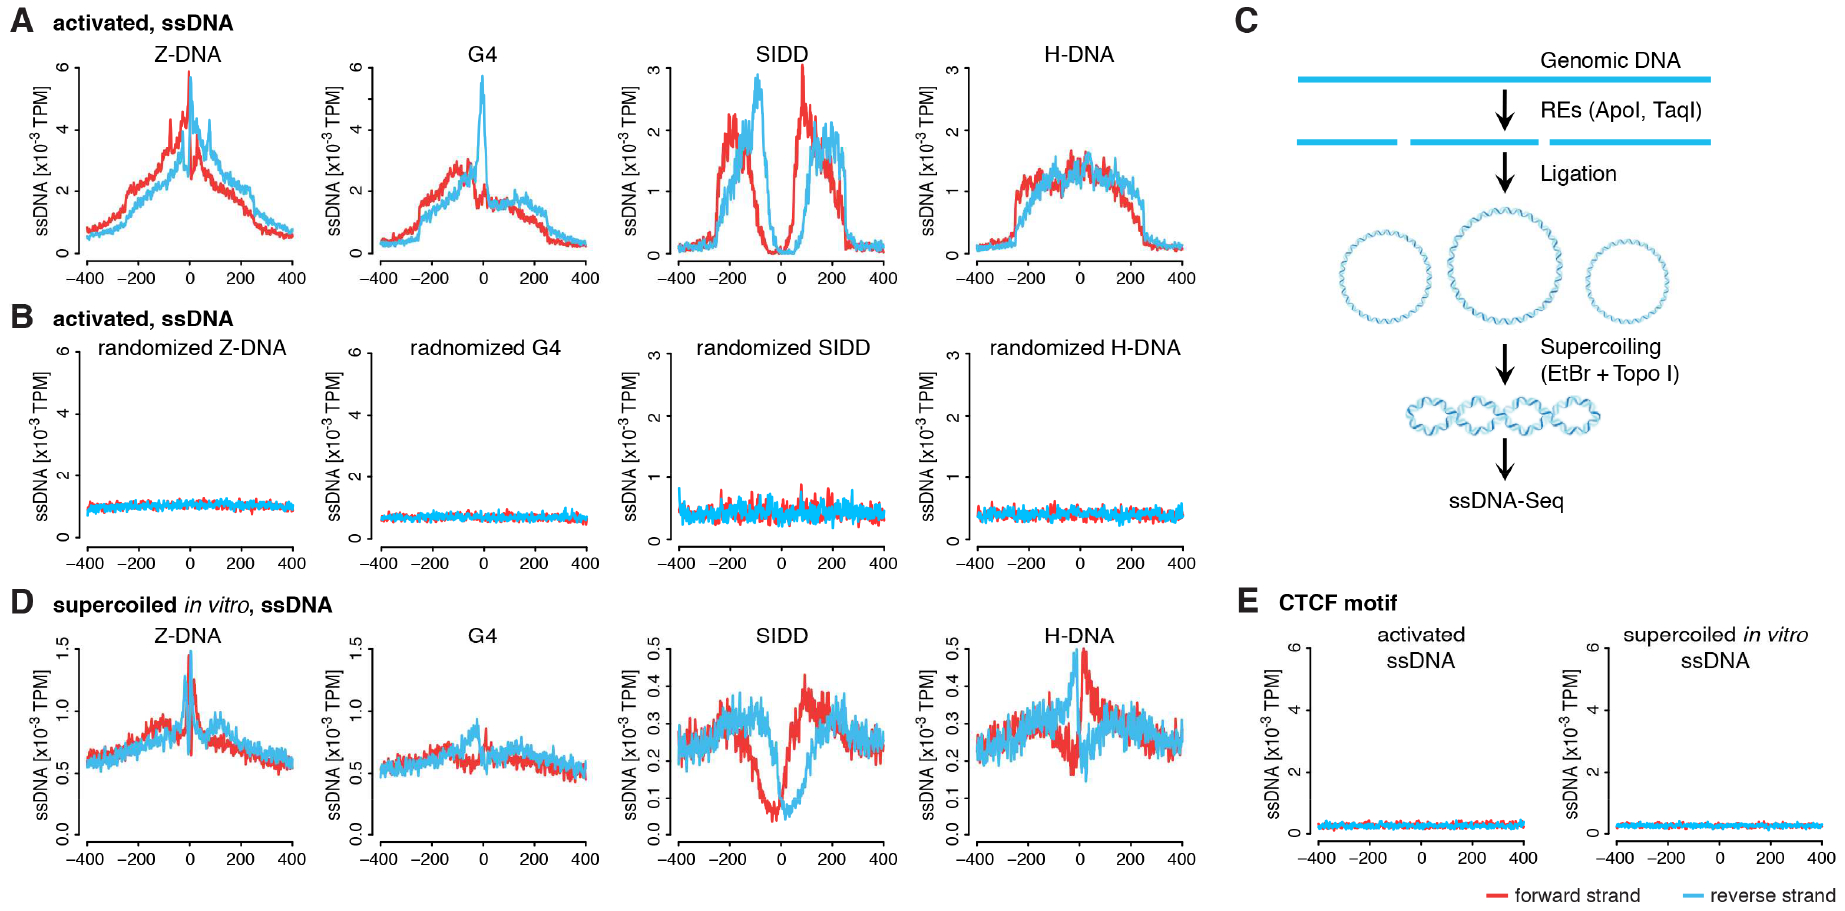
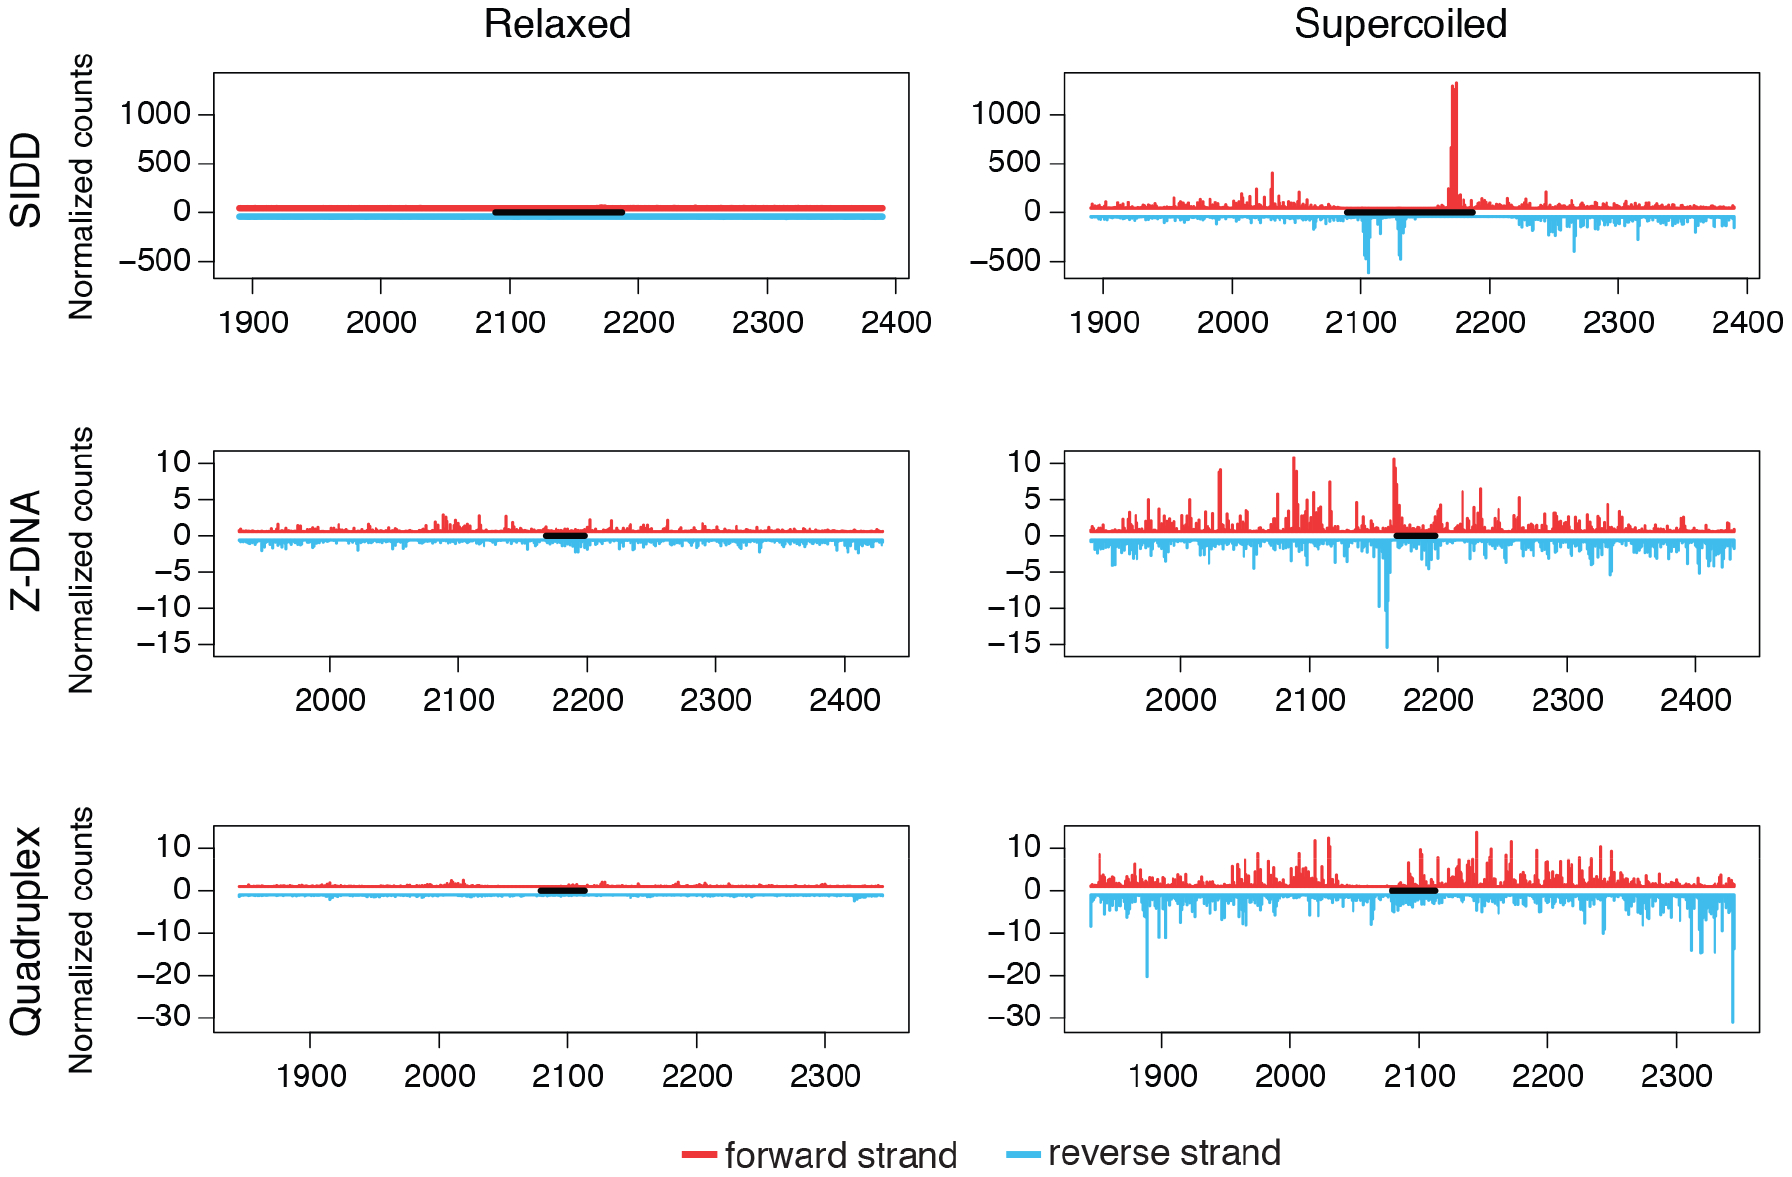
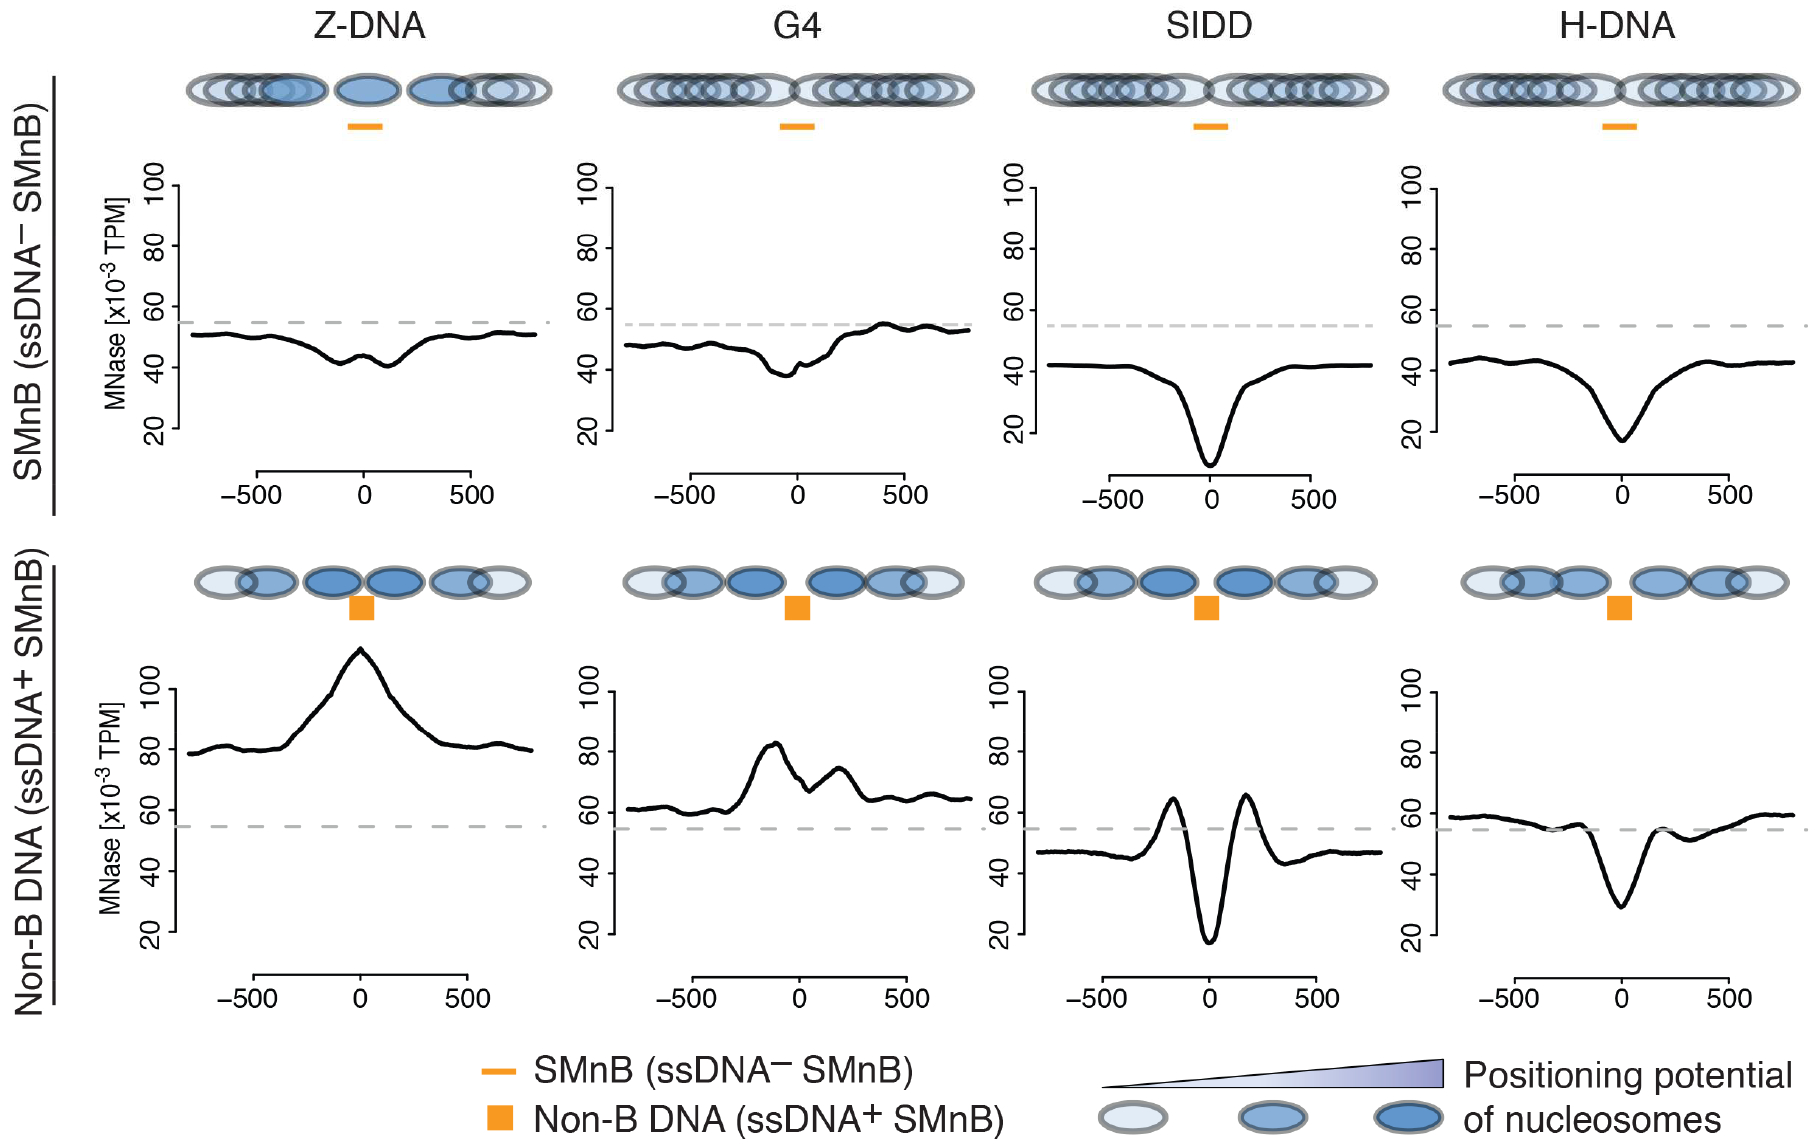
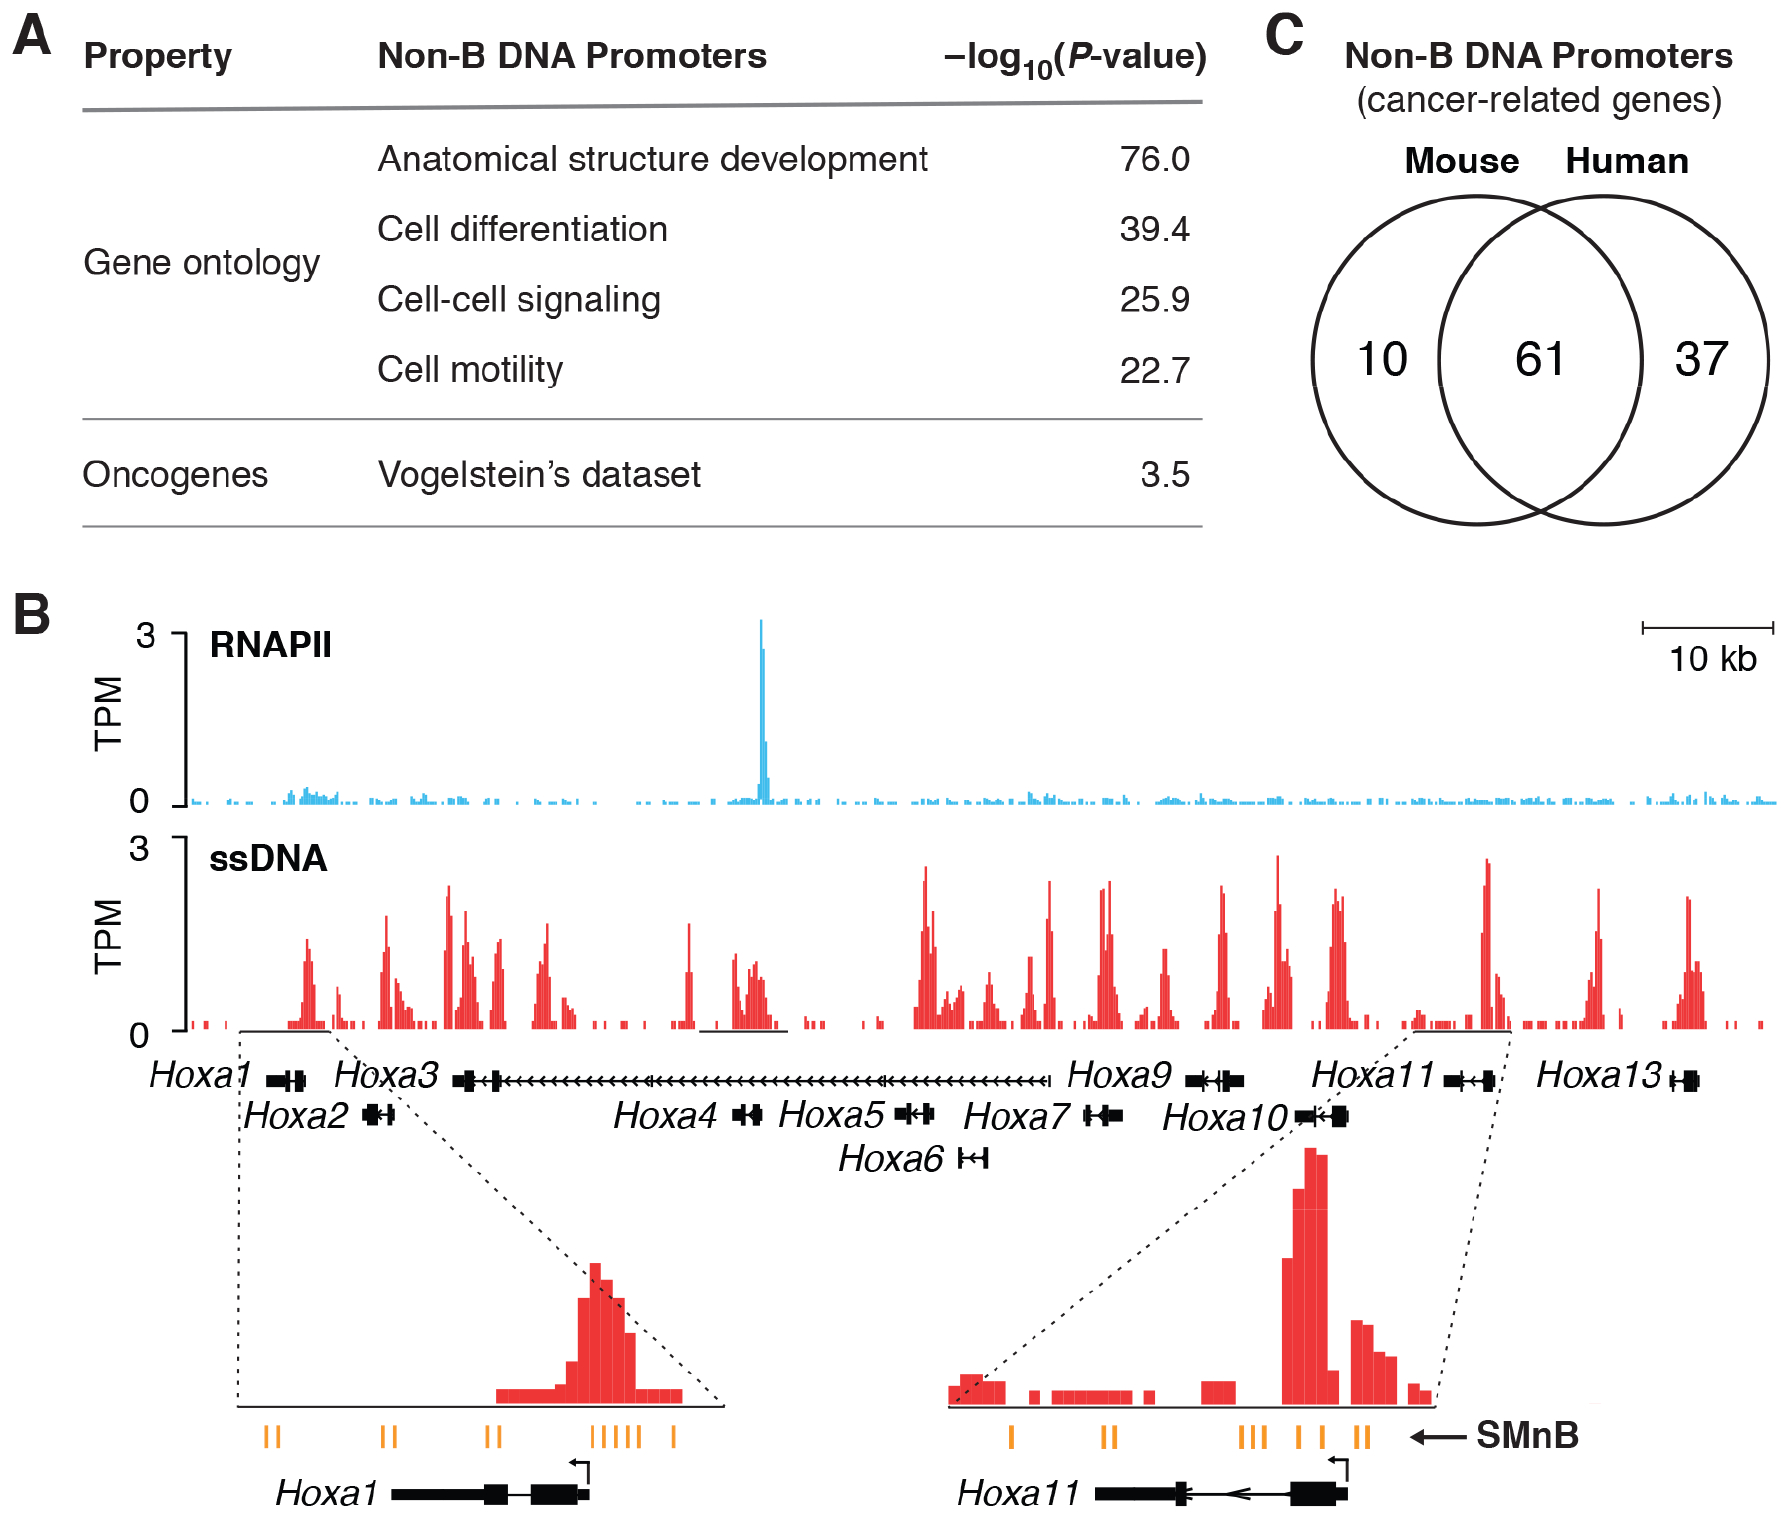
DNA in cells is predominantly B-form double helix. Though certain DNA sequences in vitro may fold into other structures, such as triplex, left-handed Z form, or quadruplex DNA, the stability and prevalence of these structures in vivo are not known. Here, using computational analysis of sequence motifs, RNA polymerase II binding data, and genome-wide potassium permanganate-dependent nuclease footprinting data, we map thousands of putative non-B DNA sites at high resolution in mouse B cells. Computational analysis associates these non-B DNAs with particular structures and indicates that they form at locations compatible with an involvement in gene regulation. Further analyses support the notion that non-B DNA structure formation influences the occupancy and positioning of nucleosomes in chromatin. These results suggest that non-B DNAs contribute to the control of a variety of critical cellular and organismal processes.

Keywords: DNA topology; H-DNA; SIDD; Z-DNA; chromatin; cruciform; non-B DNA; quadruplex; supercoiling; transcription.


Figures

Figure 1.
Figure 1.. Non-B DNA structures and Sequence Motifs with propensity to adopt non-B DNA conformation.
Though mainly right-handed B-form double helix (A), DNA strands separate during transcription to form a non-B DNA transcriptional bubble (B) enabling RNA polymerase to read the template strand. DNA forms other non-B DNA structures (C) from particular Sequence Motifs (SMnB): Z-DNA, left-handed double helix at alternating purine–pyrimidine sequences; Stress-Induced Duplex Destabilized site (SIDD) at locally A/T-rich regions; Quadruplex (G4), four-stranded DNA that stacks planar sets of four mutually Hoogsteen H-bonded Gs; Cruciform, an inverted sequence-repeat extruded from the central helical axis; and H-DNA, a triple-stranded DNA that melts one-half of mirror symmetric homopurine or homopyrimidine repeats, and then folds back and threads one of the melted strands into the major groove of the unmelted half Hoogsteen H-bonded triplex. Each non-B DNA conformation has a specific distribution of unpaired bases (indicated by yellow ribbon).
Figure 2.
Figure 2.. ssDNA-Seq detects unusual DNA structures genome-wide.
A) ChIP-Seq binding profiles for RNAPII vs. ssDNA-Seq signals at Sdcbp, Fos and Adam12 genes; normalized data as sequenced tags per million (TPM) are displayed on the UCSC genome browser. B) ssDNA signal across different genomic regions in mouse activated B-cells (left) and differential enrichment of ssDNA signal vs. uniform signal distribution (right) for activated and resting B-cells. Parenthesis include the percentages in a random background model. The upstream promoter region is defined as −2 Kb and to −0.2 Kb relative to the transcriptional start site (TSS). The TSS is a 400 bp window centered on the transcription start site. C) ssDNA-Seq tag density from −2.0 Kb to −1.0 Kb upstream of TSSs is related to expression intensity; silent, low and high expression genes ranked by RNA-Seq measurement. Density of ssDNA-Seq tags normalized as reads per kilobase per million (RPKM). See also Figure S1A. D) ssDNA-Seq tag densities from −2.0 Kb to −1.0 Kb upstream of TSS of active genes are closely related to the presence of SMnB (left), whereas RNAPII binding measured by ChIP-Seq is not (right). In (C) and (D) p-values from one-sided Wilcoxon rank sum test are shown; absolute Cohen’s d effect size of all ssDNA-Seq tests for active genes is above 0.2 while RNAPII test is negligible. There are 3799 silent, 3121 low, and 2955 high expression genes, of which 2680, 2328, and 2265, respectively, have SMnB in their upstream regions (−2.0 Kb to −1.0 Kb from TSS). E) Different sorts of SMnB are enriched for ssDNA-Seq tags in activated, but not resting murine B-cells or randomly distributed motifs. Tag enrichment obtained for the sonicated genomic DNA (input) from activated B-cells is shown. The top 5% of regions with SMnB were used for each experimental or randomized sample. The Cohen’s d effect size for all types of SMnB in activated B-cells is at least 0.4, except cruciform which is negligible. See also Figure S1.
Figure 3.
Figure 3.. Characteristic ssDNA-Seq profiles in vivo and in vitro for different sorts of SMnB evince non-B DNA structure formation.
A) Composite profiles of ssDNA-Seq tags at SMnB enriched for ssDNA-Seq tags. The y-axis shows the normalized density of TPM along the x-axis numbered from the center of the aligned SMnB. Forward and reverse strand of ssDNA-Seq tags are shown in red and blue, respectively. SMnB near RNAPII binding sites were not included in this analysis. B) Composite profiles of ssDNA-Seq tags at random genomic locations near SMnB sites analyzed in (A). See also Figure S2A, S2B and S2C. C) Schema of whole genome supercoiling and subsequent ssDNA-Seq assay. D) ssDNA-Seq tag density profile from genome supercoiled in vitro at same SMnB as in (A). E) ssDNA-Seq tag distribution at CTCF binding sites in mouse activated B-cells and genome supercoiled in vitro.
Figure 4.
Figure 4.. Detection of non-B DNA structures in supercoiled plasmids.
ssDNA-Seq of regions embracing sequences with non-B DNA potential (black bars) from relaxed or supercoiled pFLIP plasmids. Forward and reverse strand ssDNA-Seq tag counts in red and blue, respectively. See also Figure S3.
Figure 5.
Figure 5.. Non-B DNA structures position flanking nucleosomes.
Nucleosome occupancy near the different SMnB lacking ssDNA-Seq signal (top) or near non-B DNA structures (bottom). Nucleosomes are represented by filled ovals colored in blue according to the level of positioning. Dashed line indicates the average genome nucleosome density. SMnB near RNAPII binding sites were not included in the analysis. See also Figure S4.
Figure 6.
Figure 6.. Non-B DNA at promoters and transcriptome characteristics.
A) Non-B DNA structures in promoter regions is characteristic of developmental and cancer-related genes. Non-B DNA structures throughout promoters (−2 Kb to +0.2 Kb) were identified using the computational algorithm that enables analysis despite overlapping RNAPII binding (STAR Methods). Log of the p-value (probability that enrichment is fortuitous) is shown. See also Table S3. B) RNAPII ChIP-Seq profile overlaid with ssDNA-Seq signal at the HOXA cluster in the mouse activated B-cells genome. Transcriptionally silent HOXA genes show extensive ssDNA signal at SMnB that form different non-B DNA structures. C) Conservation of non-B DNA structures in mouse and human cancer-related genes. See also Figures S5 and S6, and Table S1.

References

    1. Bacolla A, Tainer JA, Vasquez KM, and Cooper DN (2016). Translocation and deletion breakpoints in cancer genomes are associated with potential non-B DNA-forming sequences. Nucleic acids research 44, 5673–5688. - PMC - PubMed
    1. Bacolla A, and Wells RD (2004). Non-B DNA conformations, genomic rearrangements, and human disease. The Journal of biological chemistry 279, 47411–47414. - PubMed
    1. Baranello L, Levens D, Gupta A, and Kouzine F (2012). The importance of being supercoiled: how DNA mechanics regulate dynamic processes. Biochimica et biophysica acta 1819, 632–638. - PMC - PubMed
    1. Baranello L, Wojtowicz D, Cui K, Devaiah BN, Chung HJ, Chan-Salis KY, Guha R, Wilson K, Zhang X, Zhang H, et al. (2016). RNA Polymerase II Regulates Topoisomerase 1 Activity to Favor Efficient Transcription. Cell 165, 357–371. - PMC - PubMed
    1. Belotserkovskii BP, De Silva E, Tornaletti S, Wang G, Vasquez KM, and Hanawalt PC (2007). A triplex-forming sequence from the human c-MYC promoter interferes with DNA transcription. The Journal of biological chemistry 282, 32433–32441. - PubMed

Publication types