. 2017 Apr 1;10(4):399-407.
doi: 10.1242/dmm.028118. Epub 2017 Feb 24.

A Drosophila model of myeloproliferative neoplasm reveals a feed-forward loop in the JAK pathway mediated by p38 MAPK signalling

Affiliations

A Drosophila model of myeloproliferative neoplasm reveals a feed-forward loop in the JAK pathway mediated by p38 MAPK signalling

Ana Terriente-Félix et al. Dis Model Mech. .

Abstract

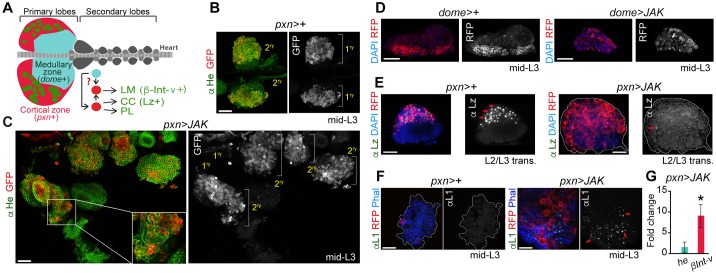
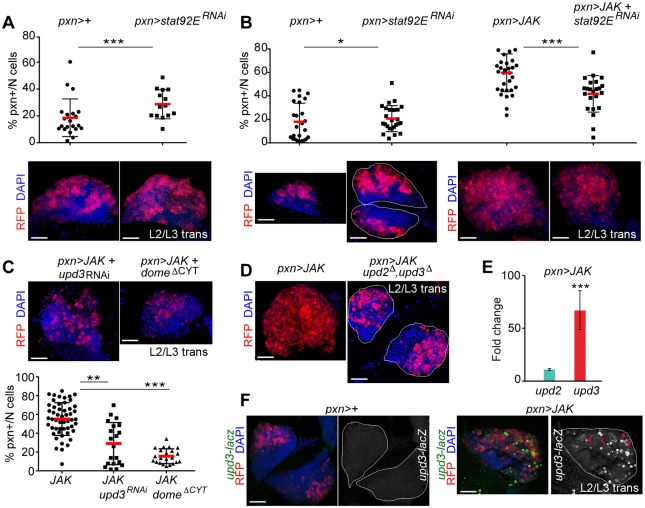
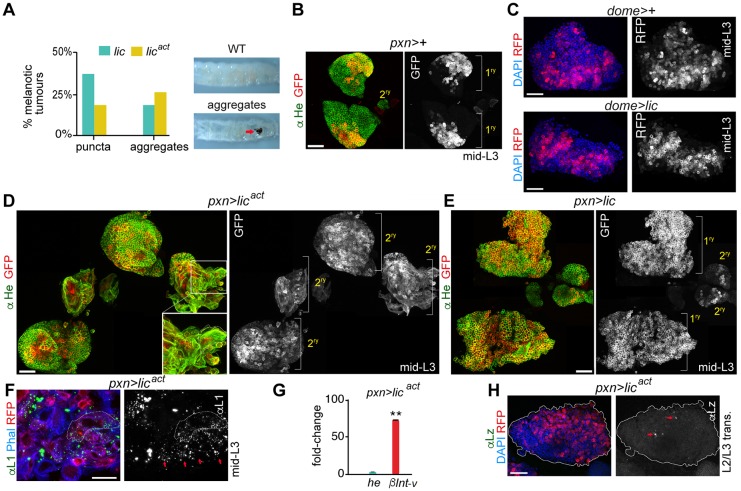
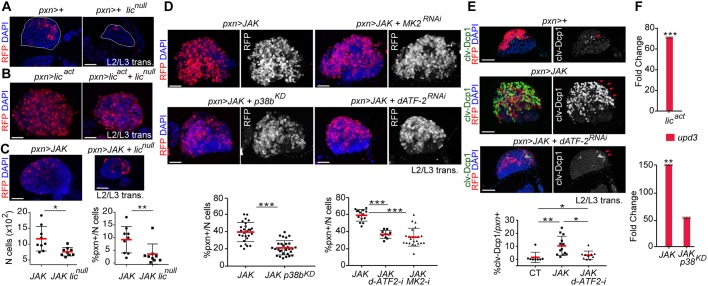
Myeloproliferative neoplasms (MPNs) of the Philadelphia-negative class comprise polycythaemia vera, essential thrombocythaemia and primary myelofibrosis (PMF). They are associated with aberrant numbers of myeloid lineage cells in the blood, and in the case of overt PMF, with development of myelofibrosis in the bone marrow and failure to produce normal blood cells. These diseases are usually caused by gain-of-function mutations in the kinase JAK2. Here, we use Drosophila to investigate the consequences of activation of the JAK2 orthologue in haematopoiesis. We have identified maturing haemocytes in the lymph gland, the major haematopoietic organ in the fly, as the cell population susceptible to induce hypertrophy upon targeted overexpression of JAK. We show that JAK activates a feed-forward loop, including the cytokine-like ligand Upd3 and its receptor, Domeless, which are required to induce lymph gland hypertrophy. Moreover, we present evidence that p38 MAPK signalling plays a key role in this process by inducing expression of the ligand Upd3. Interestingly, we also show that forced activation of the p38 MAPK pathway in maturing haemocytes suffices to generate hypertrophic organs and the appearance of melanotic tumours. Our results illustrate a novel pro-tumourigenic crosstalk between the p38 MAPK pathway and JAK signalling in a Drosophila model of MPNs. Based on the shared molecular mechanisms underlying MPNs in flies and humans, the interplay between Drosophila JAK and p38 signalling pathways unravelled in this work might have translational relevance for human MPNs.

Keywords: Drosophila; Haemocyte; Hypertrophy; JAK; Myeloproliferative neoplasm; p38 MAPK.


Conflict of interest statement

Competing interests

The authors declare no competing or financial interests.

Figures

Fig. 1.
Fig. 1.
Hypertrophic lymph glands induced by JAK overexpression in the cortical zone. (A) Schematic of the primary and secondary lobes indicating the medullary zone (MZ, dome+) and cortical zone (CZ, pxn+), and the three different cell types: crystal cells (CC, Lz+), plasmatocytes (PL) and lamellocytes (LM, βInt-ν+). (B-F) Larval lymph glands of the indicated genotypes were labelled to visualise Hemese (He, green, B,C), RFP (red or white, B-F), DAPI (D,E), Lozenge (Lz, green or white, E) and Atilla/L1 (L1, green or white, F). CZ (pxn-gal4) or MZ (dome-gal4) drivers were used to express RFP and/or a wild-type form of JAK in the lymph gland of mid third-instar larvae (mid-L3; 91-94 h AEL, B,C,F) or larvae at the L2-L3 transition (E). Note in C that the secondary lobes grow in JAK-overexpressing lymph glands and the primary lobes have released their content. Inset in C shows a higher magnification of an overgrown secondary lobe consisting of large and elongate-shaped lamellocytes. Single images of a larger area have been assembled in C to show an overgrown lymph gland induced by JAK overexpression. Red arrows in E indicate Lz-positive cells. Red arrows in F highlight the presence of the lamellocyte marker L1. (G) mRNA levels of βInt-ν and hemese (he) measured as the mean±s.e.m. increase in JAK-overexpressing lymph glands compared with wild-type lymph glands. Expression of the βInt-ν lamellocyte-specific gene increases (fold change=9.1, P=0.039), whereas the expression of the haemocyte-specific gene he does not change significantly (fold change=1.55, P=0.31). Wild-type controls were given the value of 1 and are not displayed in the figure. *P<0.05. Scale bars: 40 µm (B-E), 20 µm (F).
Fig. 2.
Fig. 2.
JAK-induced hypertrophy requires Stat92E, Dome and Upd3. (A-C) Scatterplots and immunofluorescence images showing the proportion of pxn+ cells per primary lobe (% pxn+/N cells) and lymph glands expressing the indicated transgenes under the control of the pxn-Gal4 driver. Lymph glands were extracted from mid-L3 larvae (A) or larvae aged at the L2-L3 transition (B,C) and labelled to visualise RFP (red), and DAPI (blue). (A) Expansion of the stat92ERNAi-expressing cell population compared with the control pxn>+ cell population (P=0.0087; pxn>+, n=21; pxn>stat92ERNAi, n=14). (B) Knockdown of stat92E partially rescues the JAK-induced expansion of the pxn+ population (P=0.0004; pxn>JAK, n=33; pxn>JAK+stat92ERNAi, n=23) whereas stat92ERNAi produces a subtle increase in the proportion of pxn+ cells compared with the control pxn>+ cell population (P=0.03; pxn>+, n=25; pxn>stat92ERNAi, n=21). (C) Knockdown of upd3 or expression of DomeΔCYT reduces the JAK-induced expansion of the pxn+ population (pxn>JAK+domeΔCYT: P=1.961e−10, n=22; pxn>JAK+upd3RNAi: P=0.00234, n=20; pxn>JAK, n=44). (D) Lymph glands expressing JAK under the control of the pxn-Gal4 driver were extracted and labelled as in B,C. Note the reduction in the expansion of the pxn+ cell population in upd2Δ, upd3Δ mutant lymph glands. (E) Increases in mRNA levels of upd3 and upd2 in lymph glands expressing JAK under the control of the pxn-gal4 driver when compared with controls, which were given the value of 1. Note a significant increase in the expression level of upd3 (fold-change=72.45, P=0.00013) but not in the expression level of upd2 (fold-change=8.32, P=0.15). (F) Lymph glands expressing the indicated transgenes under the control of the pxn-Gal4 driver were extracted from larvae aged at the L2-L3 transition and labelled to visualise upd3-lacZ expression (antibody against βGal, green or white), RFP (red), and DAPI (blue). Note induction of upd3-lacZ expression in JAK-overexpressing lymph glands. *P<0.05; **P<0.01; ***P<0.001. Every dot represents a single primary lobe. Red horizontal bar represents the mean, and whiskers represent 5% and 95% percentiles. The contour of the lymph glands is marked in B,D and F. Scale bars: 40 µm (A-D,F).
Fig. 3.
Fig. 3.
Hypertrophic lymph glands induced by expression of an activated form of Licorne in the cortical zone. (A) Histogram showing the percentage of larvae bearing small (puncta) or big (aggregates) melanotic tumours upon expression of wild-type (lic, green) or an activated form (licact, yellow) of Licorne under the control of the pxn-gal4 driver. Representative examples of a wild-type larva and of a larva bearing a big melanotic tumour are shown. Lic, n=93 larvae; licact, n=109 larvae. (B,D,E) Lymph glands expressing the indicated transgenes under the control of the pxn-Gal4 driver were extracted from mid third-instar larvae (mid-L3) and labelled to visualise RFP (red or white) and Hemese (He, green). Note that the secondary lobes grow in Licact-expressing lymph glands (D), but their associated primary lobes have released their content. Inset in D shows a higher magnification of large, elongated lamellocytes. Also note that the primary lobes in Lic-overexpressing lymph glands (E) are larger than wild-type controls (B). (C) Lymph glands overexpressing Lic under the control of the dome-Gal4 driver extracted from mid third-instar larvae (mid-L3) and labelled to visualise RFP (red) and DAPI (blue). (F) Expression of Licact in pxn+ cells induces differentiation of lamellocytes in mid-L3. Lamellocytes are distinguished by the expression of L1/Atilla (L1, green or white) and their large and elongated shape outlined by Phalloidin (Phal, blue); RFP visualises pxn+ cells (red). Note an increase of L1+ cells (red arrows). (G) Increased mRNA levels of βInt-ν and hemese (he) in lymph glands expressing Licact when compared with controls (fold-change increase of βInt-ν=76.50, P=0.03; fold-change of he=3.38, P=0.0052). Controls were given the value of 1 and are not displayed in the figure. **P<0.01. (H) Lymph gland expressing Licact under the control of the pxn-Gal4 driver extracted from a larva at the L2-L3 transition and labelled to visualise RFP (red), Lozenge (Lz, green or white) and DAPI (blue). Note a reduced number of Lozenge-expressing cells (red arrows). The contour of the lymph gland is marked in H. Single images of a larger area have been assembled in D and E to show overgrown lymph glands induced by overexpression of Licact or Lic, respectively. Scale bars: 40 µm (B-E,H), 20 µm (F).
Fig. 4.
Fig. 4.
A role for p38 MAPK signalling in JAK-induced hypertrophy. (A) Expression of pxn-Gal4 marked by the expression of RFP (red) in wild-type and in licnull hemizygous lymph glands (outlined). (B,C) Expression of Licact (B) or JAK (C) under the control of the pxn-Gal4 driver in control and in licnull hemizygous lymph glands. Scatterplot in C shows the proportion of pxn+ cells per primary lobe (% pxn+/N cells), and the total cell number per primary lobe (N cells). Note that loss of lic induced a reduction in the number of pxn+ cells per primary lobe caused by JAK overexpression (P=0.006) and a reduction in the number of cells per lymph gland (P=0.034; pxn>JAK, n=9; pxn>JAK+licnull, n=9). (D) Genetic interactions between p38b, dATF-2 and MK2 and JAK in the pxn+ cells. Scatterplots show the proportion of pxn+ cells per primary lobe (% pxn+/N cells) and immunofluorescence images show lymph glands expressing the indicated transgenes under the control of the pxn-Gal4 driver. Note that expression of p38bKD, MK2RNAi or dATF-2RNAi reduced the number of pxn+ cells per primary lobe caused by JAK overexpression (pxn>JAK vs pxn>JAK+p38bKD, P=6.318e−06; pxn>JAK vs pxn>JAK+dATF-2RNAi, P=1.02e−06; pxn>JAK vs pxn>JAK+MK2RNAi, P=3.848e−06; pxn>JAK, left plot, n=27 and right plot, n=14; pxn>JAK+p38bKD, n=29; pxn>JAK+dATF-2RNAi, n=10; pxn>JAK+MK2RNAi, n=23). (E) Expression of the cleaved form of the effector caspase Dcp1 (clv-Dcp1, marked in green and white) increases upon JAK overexpression in pxn+ cells (pxn>JAK vs pxn>+, P=0.038; pxn>+, n=8; pxn>JAK, n=13) and was rescued by the expression of dATF-2RNAi (pxn>JAK vs pxn>JAK+dATF-2RNAi, P=0.001; pxn>JAK+dATF-2RNAi, n=12), although not to the levels observed in the wild type (pxn>JAK+d-ATF2RNAi vs pxn>+, P=0.035). (F) Increased mRNA levels of upd3 in lymph glands expressing Licact (fold-change=71.1, P=0.0006), JAK (fold-change=158.43, P=0.0099) or JAK and p38bKD (fold-change=54.79, P=0.063) under the control of the pxn-Gal4 driver when compared with controls (pxn>+), which were given the value of 1. In A-E, lymph glands of the different genotypes were extracted from larvae at the L2-L3 transition and labelled to visualise RFP (red or white) and DAPI (blue). *P<0.05; **P<0.01; ***P<0.001. In the scatterplots, every dot represents a single primary lobe; red horizontal bars represent the mean, and whiskers represent 5% and 95% percentiles. Scale bars: 40 µm.

Similar articles

Cited by

References

    1. Adachi-Yamada T., Nakamura M., Irie K., Tomoyasu Y., Sano Y., Mori E., Goto S., Ueno N., Nishida Y. and Matsumoto K. (1999). p38 mitogen-activated protein kinase can be involved in transforming growth factor β superfamily signal transduction in drosophila wing morphogenesis. Mol. Cell. Biol. 19, 2322-2329. 10.1128/MCB.19.3.2322 - DOI - PMC - PubMed
    1. Agaisse H., Petersen U.-M., Boutros M., Mathey-Prevot B. and Perrimon N. (2003). Signaling role of hemocytes in Drosophila JAK/STAT-dependent response to septic injury. Dev. Cell 5, 441-450. 10.1016/S1534-5807(03)00244-2 - DOI - PubMed
    1. Anderl I., Vesala L., Ihalainen T. O., Vanha-Aho L.-M., Andó I., Rämet M. and Hultmark D. (2016). Transdifferentiation and proliferation in two distinct hemocyte lineages in Drosophila melanogaster larvae after wasp infection. PLoS Pathog. 12, e1005746 10.1371/journal.ppat.1005746 - DOI - PMC - PubMed
    1. Bausek N. and Zeidler M. P. (2014). Gα73B is a downstream effector of JAK/STAT signalling and a regulator of Rho1 in Drosophila haematopoiesis. J. Cell Sci. 127, 101-110. 10.1242/jcs.132852 - DOI - PubMed
    1. Baxter E. J., Scott L. M., Campbell P. J., East C., Fourouclas N., Swanton S., Vassiliou G. S., Bench A. J., Boyd E. M., Curtin N. et al. (2005). Acquired mutation of the tyrosine kinase JAK2 in human myeloproliferative disorders. Lancet 365, 1054-1061. 10.1016/S0140-6736(05)74230-6 - DOI - PubMed

MeSH terms