. 2017 May;143(5):821-834.
doi: 10.1007/s00432-017-2364-z. Epub 2017 Feb 25.

Hepatic inflammation-fibrosis-cancer axis in the rat hepatocellular carcinoma induced by diethylnitrosamine

Affiliations

Hepatic inflammation-fibrosis-cancer axis in the rat hepatocellular carcinoma induced by diethylnitrosamine

Yong-Fang Ding et al. J Cancer Res Clin Oncol. 2017 May.

Abstract

Purpose: Hepatocellular carcinoma (HCC) cases are closely associated with chronic inflammation and fibrosis which is known as hepatic inflammation-fibrosis-cancer (IFC) axis. The aim of this study is to elucidate the development characteristics of the rat HCC model based on IFC axis.

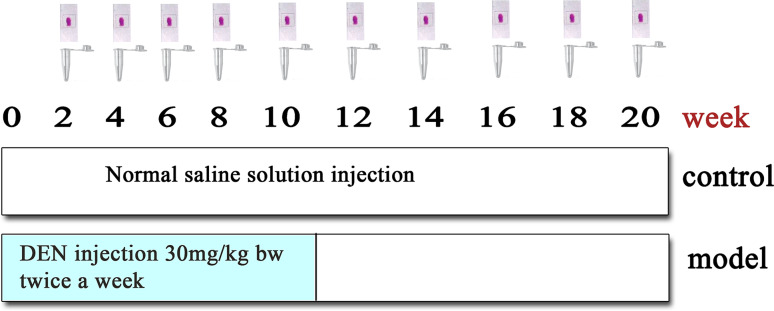
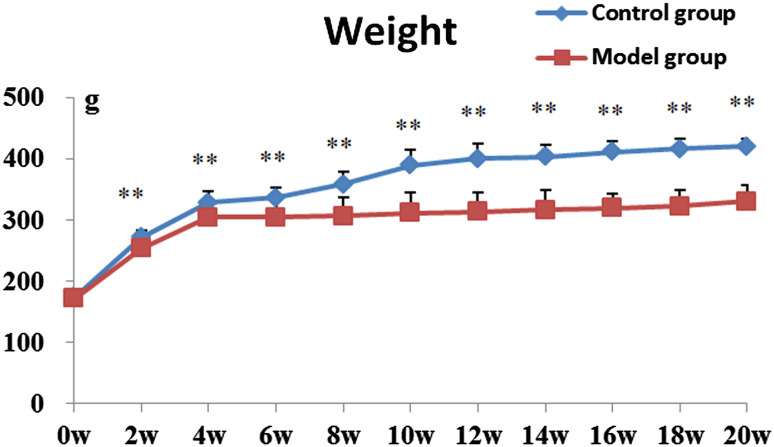
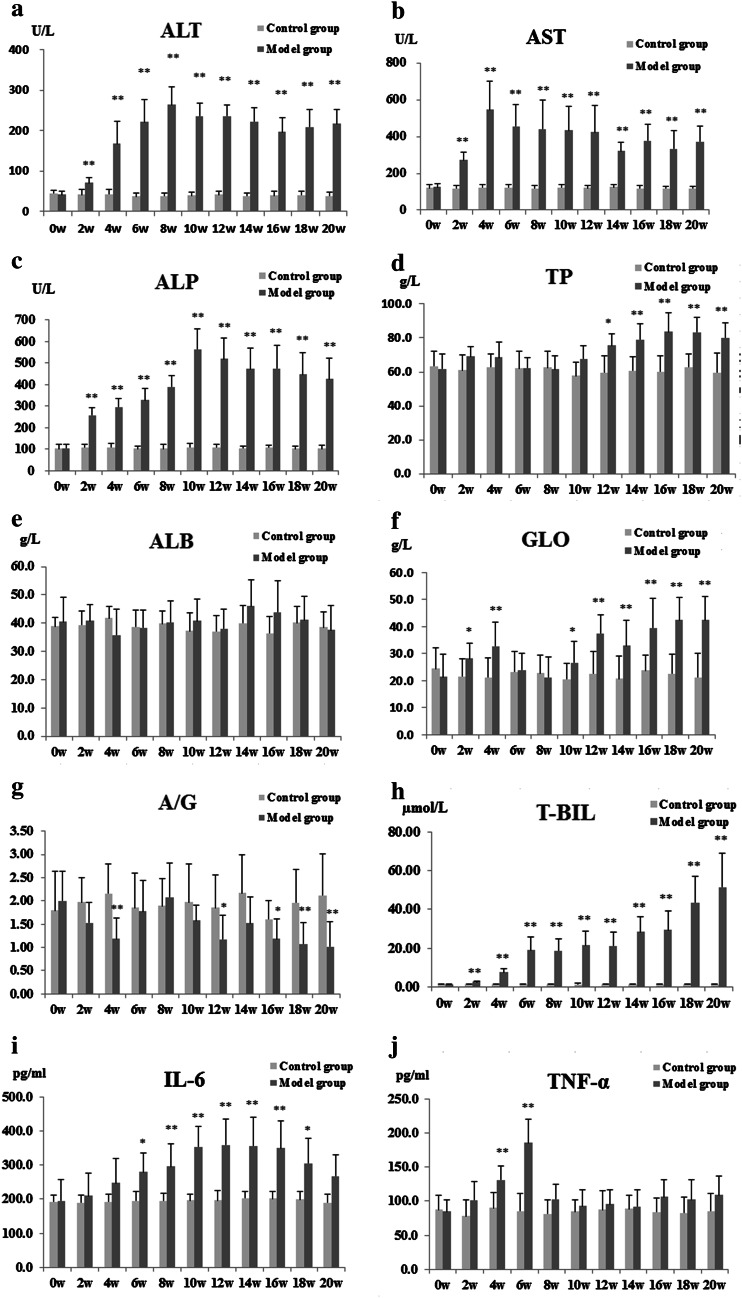
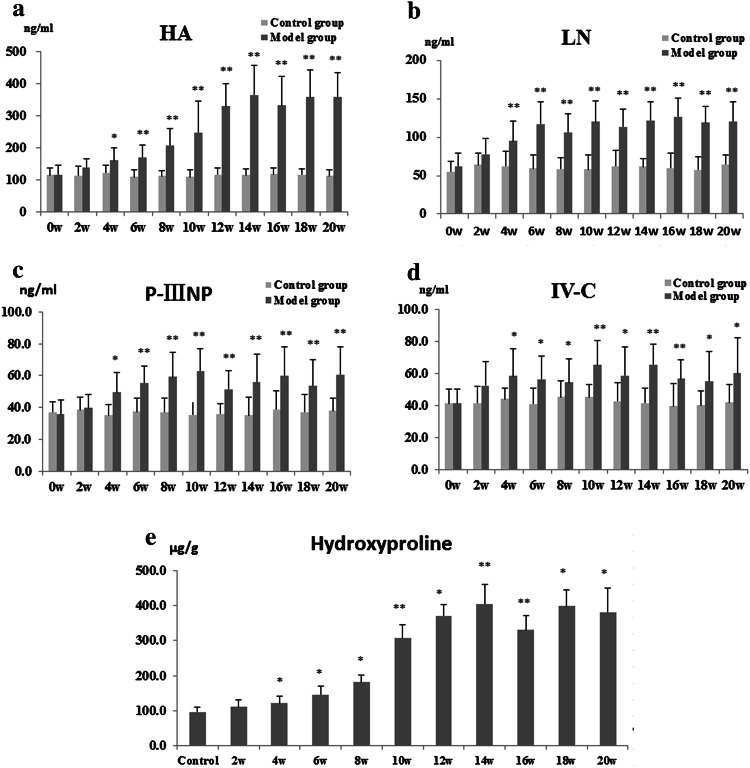
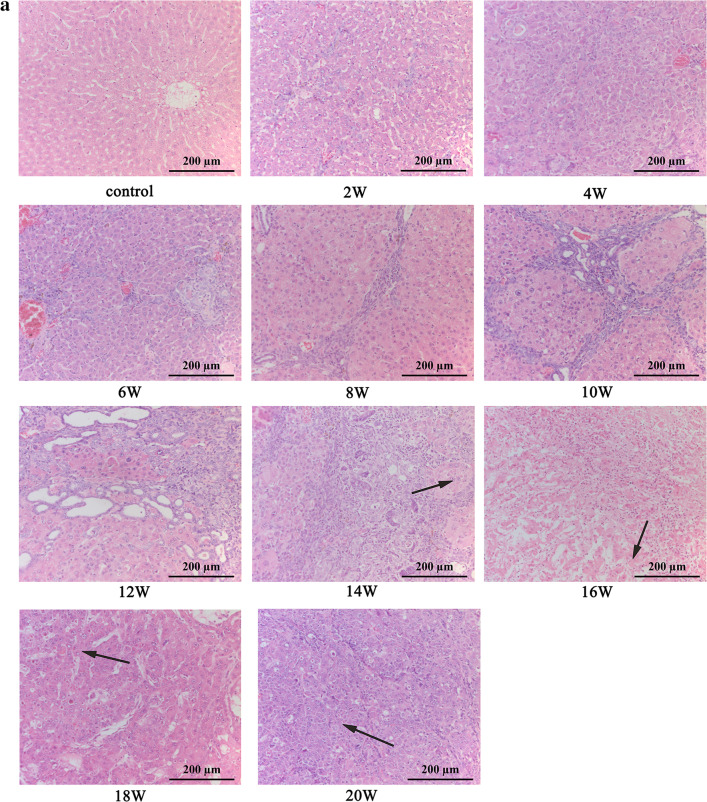
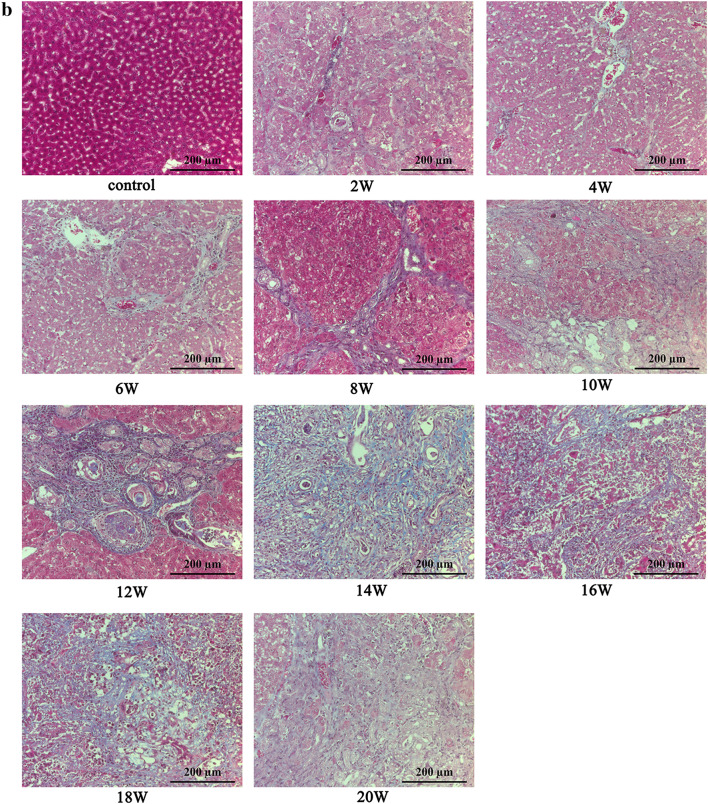
Methods: The diethylnitrosamine (DEN)-induced rat HCC, which presents a stepwise histopathological progression that is similar to human HCC, was used to analyze the features of the different stages (inflammation, fibrosis, cancer). Rats were injected DEN at a dose of 30 mg/kg body weight twice a week for 11 weeks and the animals were observed until week 20. Time series sera and organ samples from the DEN animal model were collected to evaluate the dynamic changes.

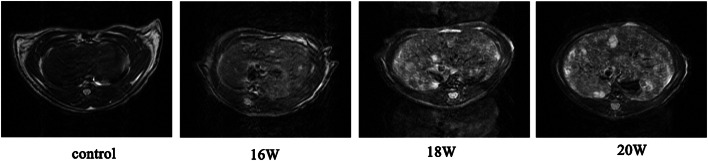
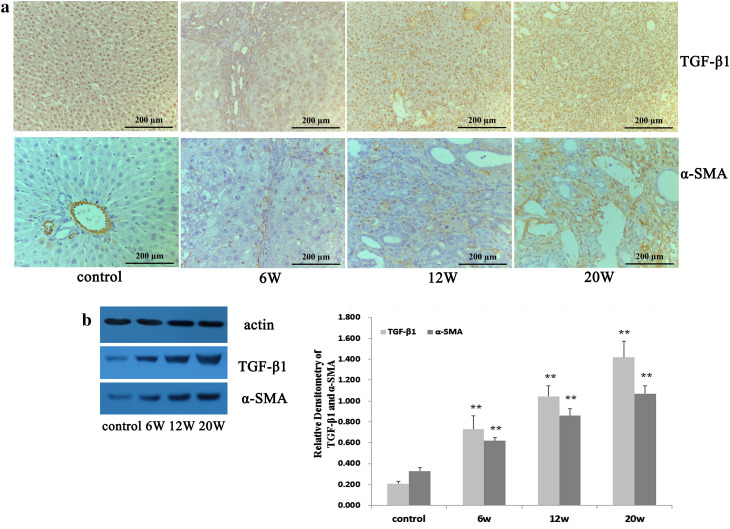
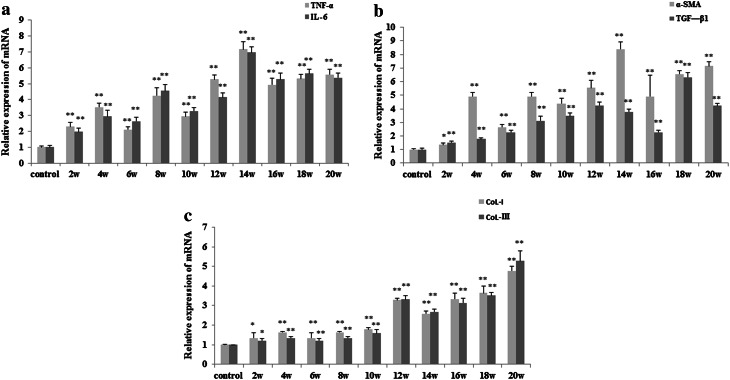
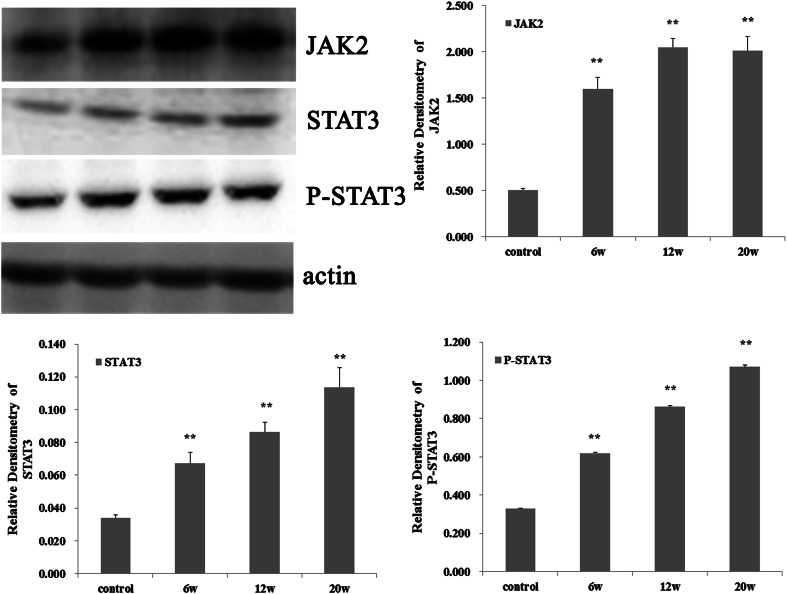
Results: It was found that serum biochemical indicators (AST, ALT, ALP, TP, T-BIL, IL-6, TNF-α) from DEN-treated group were higher than that from control group. Fibrosis-related index in serum and live tissue were increased, respectively, from week 4 after DEN treatment. The expression of TGF-β1 and α-SMA in DEN-treated group was higher than that in control group. JAK2/STAT3 signaling was significantly up-regulated in DEN-treated group compared to that in control group. The histological examination confirmed that the hepatocarcinogenesis model was successfully established, and 100% of the animals in the DEN-exposed group developed liver tumors at 20 weeks. According to the pathological changes, the model characterized resulted in three stages: the inflammation stage (week 2-6), the fibrosis stage (week 8-12), and the HCC stage (week 14-20).

Conclusions: The results suggested that the HCC development was associated with IFC axis. The serial progression of hepatocarcinogenesis was according to the sequence of hepatic inflammation, fibrosis and then hepatic tumor.

Keywords: Hepatocellular carcinoma; Inflammation-fibrosis-cancer (IFC) axis; Liver fibrosis; Liver inflammation.


Conflict of interest statement

The author(s) declare(s) that they have no conflicts of interest to disclose.

Figures

Fig. 1
Fig. 1
Experimental schedule
Fig. 2
Fig. 2
Growth curve of rats treated with diethylnitrosamine. Results are expressed as mean ± SD (n = 10–11). **P < 0.01 vs control group
Fig. 3
Fig. 3
Effect of DEN on serum biochemical indicators. Serum levels of a ALT, b AST, c ALP, d TP, e ALB, f GLO, g A/G, h T-BIL, i IL-6, j TNF-α. Results are expressed as mean ± SD (n = 10–11). *P < 0.05, **P < 0.01 vs control group
Fig. 4
Fig. 4
Effect of DEN on serum biochemical indicators. Serum levels of a HA, b LN, c P-IIINP, d IV-C, and tissue level of e hydroxyproline. Results are expressed as mean ± SD. (n = 10–11). *P < 0.05, **P < 0.01 vs control group
Fig. 5
Fig. 5
Representative results of liver nodules on T2-weighted image. MRI was performed at week 16, week 18 and week 20. Multiple nodules appeared
Fig. 6
Fig. 6
Examination of liver histology after DEN induced on hepatic inflammation-fibrosis-cancer axis. Representative photomicrographs of HE (a) and Masson staining (b) at 2–20 weeks (×200); Arrows indicate the representative tumors
Fig. 6
Fig. 6
Examination of liver histology after DEN induced on hepatic inflammation-fibrosis-cancer axis. Representative photomicrographs of HE (a) and Masson staining (b) at 2–20 weeks (×200); Arrows indicate the representative tumors
Fig. 7
Fig. 7
Expression of TGF-β1 andα-SMA in the livers of model rats. Expression levels were evaluated by immunohistochemical (a) and western blot analyses (b). a Representative liver tissues immustained (×200) with anti-TGF-β1 and α-SMA antibody in control, diethylnitrosamine treated for 6, 12 and 20 weeks. b Hepatic expression of TGF-β1 and α-SMA by western boltting
Fig. 8
Fig. 8
Expression of IL-6, TNF-α, α-SMA, TGF-β1, collagen I and collagen III in the livers of DEN-treated rats. Real-time PCR analyses of IL-6 and TNF-α (a), α-SMA and TGF-β1 (b), collagen I and collagen III (c). Results are expressed as mean ± SD (n = 3). *P < 0.05, **P < 0.01 vs control group
Fig. 9
Fig. 9
Up-regulation of JAK2/STAT3 signaling in the liver of DEN-treated livers. Western blotting analyses of JAK2/STAT3 signaling

Similar articles

Cited by

References

    1. Aravalli RN, Cressman EN, Steer CJ (2013) Cellular and molecular mechanisms of hepatocellular carcinoma: an update. Arch Toxicol 87:227–247. doi:10.1007/s00204-012-0931-2 - PubMed
    1. Bissell DM (2001) Chronic liver injury, TGF-β and cancer. Exp Mol Med 33:179–190 - PubMed
    1. Borbath I, Stärkel P (2011) Chemoprevention of hepatocellular carcinoma. Proof of concept in animal models. Acta Gastroenterol Belg 74:34–44 - PubMed
    1. Calès P, Boursier J, Chaigneau J et al (2010) Diagnosis of different liver fibrosis characteristics by blood tests in non-alcoholic fatty liver disease. Liver Int 30:1346–1354 - PubMed
    1. Costentin CE, Roudot-Thraval F, Zafrani ES et al (2011) Association of caffeine intake and histological features of chronic hepatitis C. J Hepatol 54:1123–1129 - PubMed

MeSH terms

Substances

LinkOut - more resources