

Native T1 mapping: inter-study, inter-observer and inter-center reproducibility in hemodialysis patients
- PMID: 28238284
- PMCID: PMC5327541
- DOI: 10.1186/s12968-017-0337-7
Native T1 mapping: inter-study, inter-observer and inter-center reproducibility in hemodialysis patients
Abstract
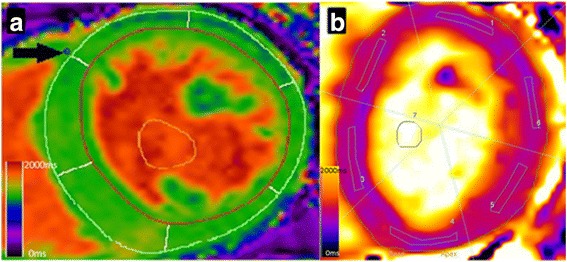
Background: Native T1 mapping is a cardiovascular magnetic resonance (CMR) technique that associates with markers of fibrosis and strain in hemodialysis patients. The reproducibility of T1 mapping in hemodialysis patients, prone to changes in fluid status, is unknown. Accurate quantification of myocardial fibrosis in this population has prognostic potential.
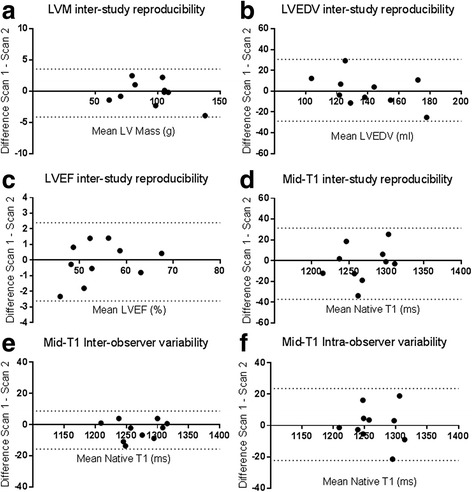
Methods: Using 3 Tesla CMR, we report the results of 1) the inter-study, inter-observer and intra-observer reproducibility of native T1 mapping in 10 hemodialysis patients; 2) inter-study reproducibility of left ventricular (LV) structure and function in 10 hemodialysis patients; 3) the agreement of native T1 map and native T1 phantom analyses between two centres in 20 hemodialysis patients; 4) the effect of changes in markers of fluid status on native T1 values in 10 hemodialysis patients.
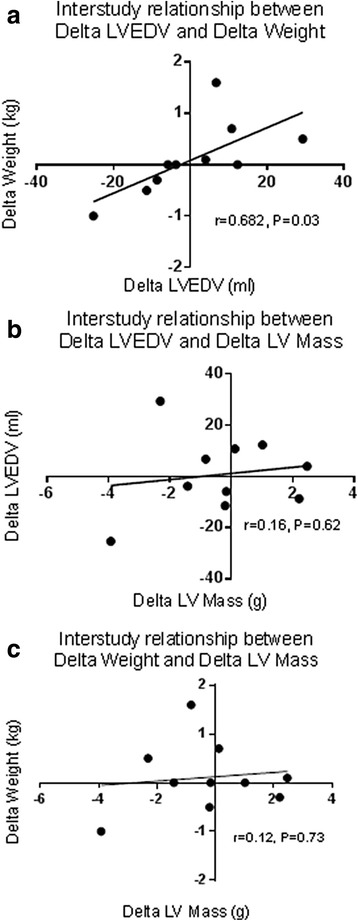
Results: Inter-study, inter-observer and intra-observer variability of native T1 mapping were excellent with co-efficients of variation (CoV) of 0.7, 0.3 and 0.4% respectively. Inter-study CoV for LV structure and function were: LV mass = 1%; ejection fraction = 1.1%; LV end-diastolic volume = 5.2%; LV end-systolic volume = 5.6%. Inter-centre variability of analysis techniques were excellent with CoV for basal and mid-native T1 slices between 0.8-1.2%. Phantom analyses showed comparable native T1 times between centres, despite different scanners and acquisition sequences (centre 1: 1192.7 ± 7.5 ms, centre 2: 1205.5 ± 5 ms). For the 10 patients who underwent inter-study testing, change in body weight (Δweight) between scans correlated with change in LV end-diastolic volume (ΔLVEDV) (r = 0.682;P = 0.03) representing altered fluid status between scans. There were no correlations between change in native T1 between scans (ΔT1) and ΔLVEDV or Δweight (P > 0.6). Linear regression confirmed ΔT1 was unaffected by ΔLVEDV or Δweight (P > 0.59).
Conclusions: Myocardial native T1 is reproducible in HD patients and unaffected by changes in fluid status at the levels we observed. Native T1 mapping is a potential imaging biomarker for myocardial fibrosis in patients with end-stage renal disease.
Keywords: Cardiovascular magnetic resonance; Hemodialysis; Myocardial fibrosis; Native T1; Reproducibility.
Figures

References
-
- U.S. Renal Data System . USRDS 2006 Annual Data Report: Atlas of End-Stage Renal Disease in the United States. 2006.
-
- Mancini GB, Dahlof B, Diez J. Surrogate markers for cardiovascular disease: structural markers. Circulation. 2004;109(25 Suppl 1):IV22–IV30. - PubMed
-
- Badve SV, Palmer SC, Strippoli GF, Roberts MA, Teixeira-Pinto A, Boudville N, et al. The Validity of Left Ventricular Mass as a Surrogate End Point for All-Cause and Cardiovascular Mortality Outcomes in People With CKD: A Systematic Review and Meta-analysis. Am J Kidney Dis. 2016;68(4):554-63. - PubMed
Publication types
MeSH terms
Grants and funding
LinkOut - more resources
Full Text Sources
Other Literature Sources
Medical
