. 2017 Jul:65:40-51.
doi: 10.1016/j.ceca.2017.02.006. Epub 2017 Feb 15.

Calcium signalling in Drosophila photoreceptors measured with GCaMP6f

Affiliations

Calcium signalling in Drosophila photoreceptors measured with GCaMP6f

Sabrina Asteriti et al. Cell Calcium. 2017 Jul.

Abstract

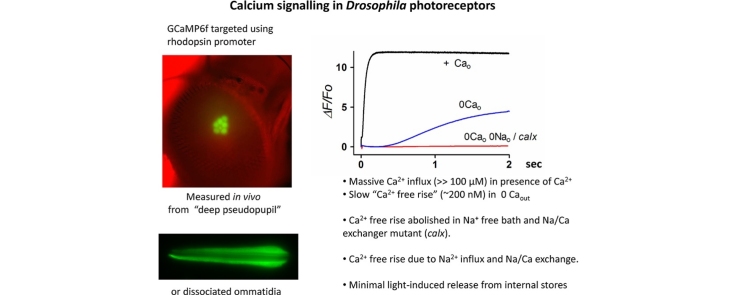
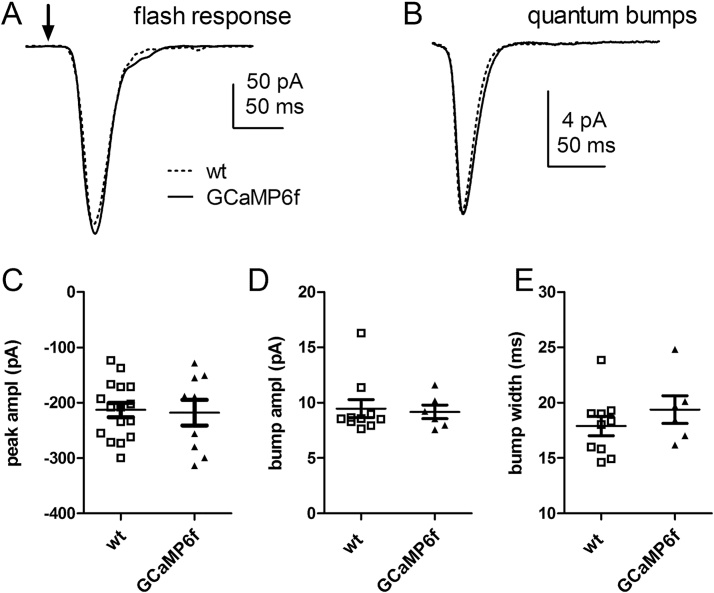
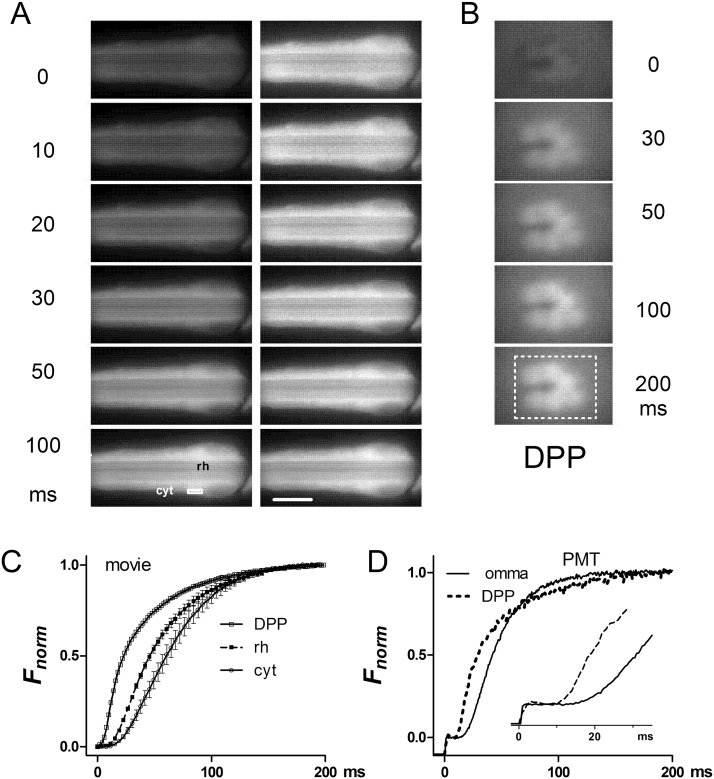
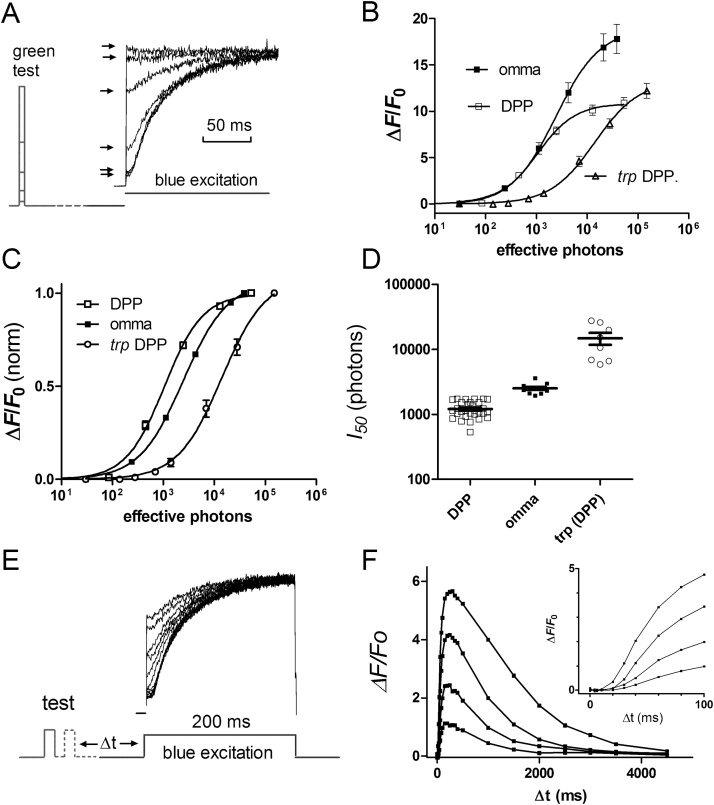
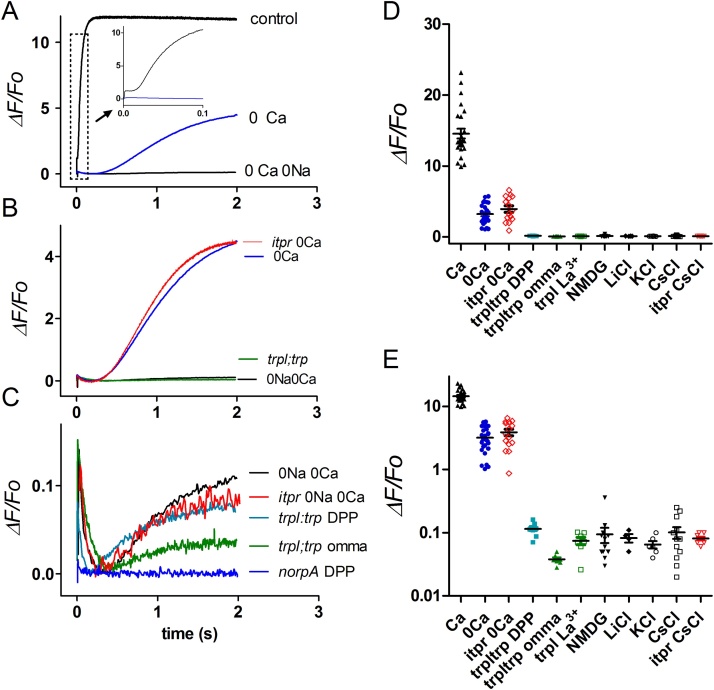
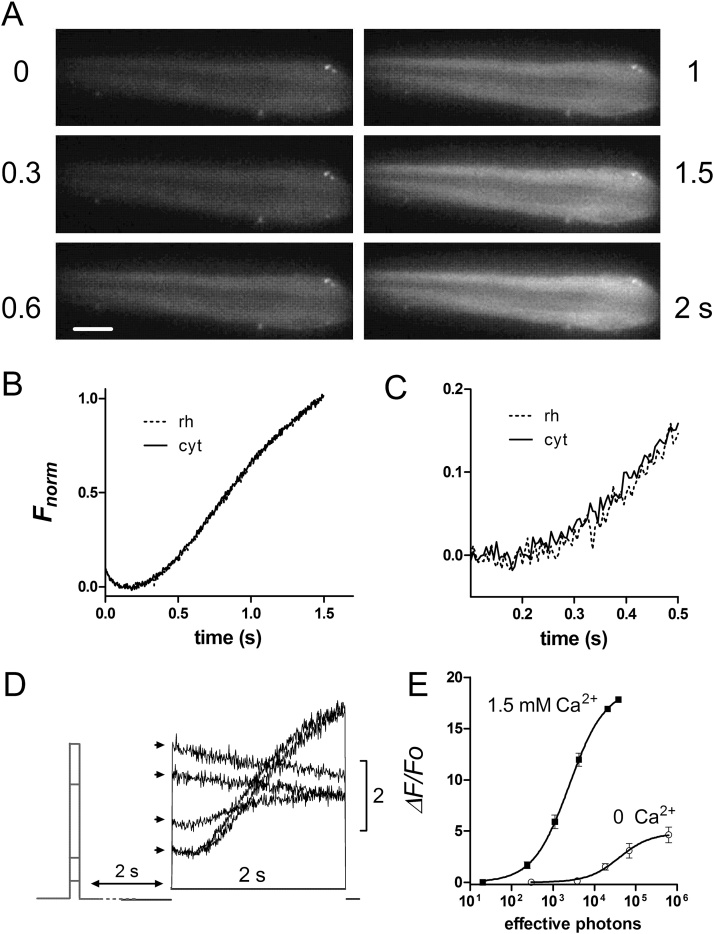
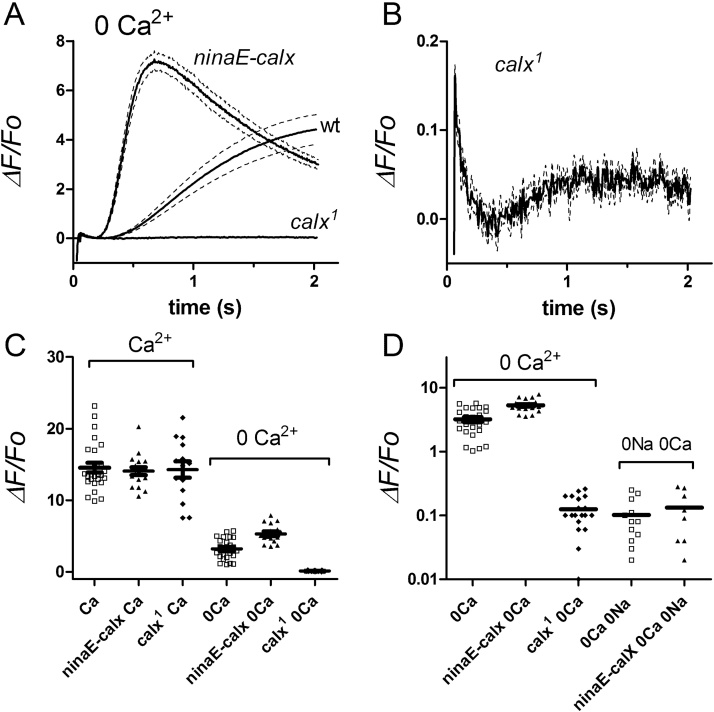
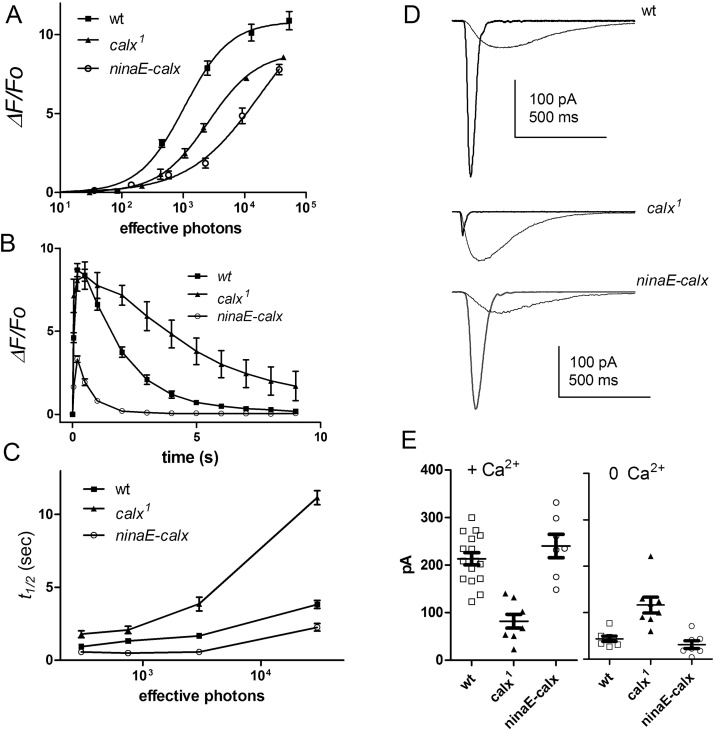
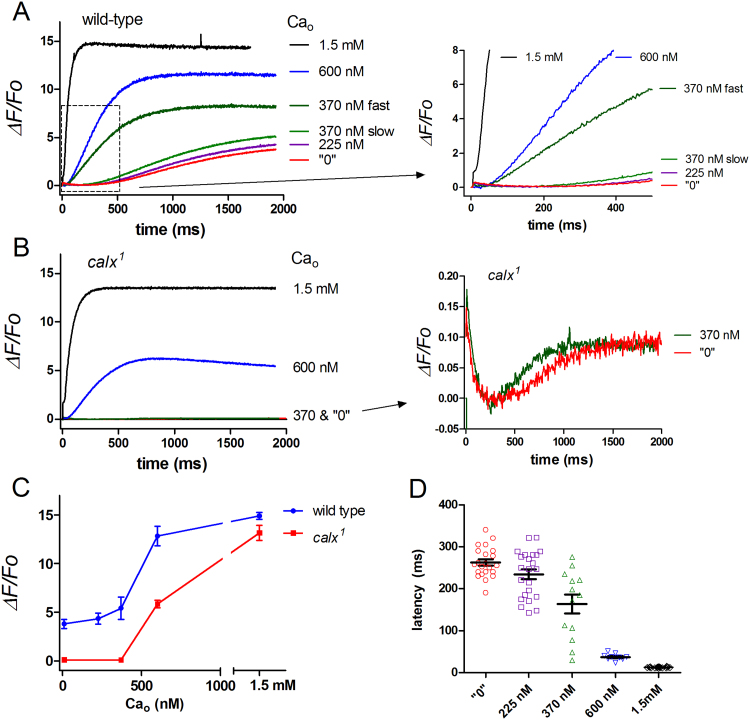
Drosophila phototransduction is mediated by phospholipase C leading to activation of cation channels (TRP and TRPL) in the 30000 microvilli forming the light-absorbing rhabdomere. The channels mediate massive Ca2+ influx in response to light, but whether Ca2+ is released from internal stores remains controversial. We generated flies expressing GCaMP6f in their photoreceptors and measured Ca2+ signals from dissociated cells, as well as in vivo by imaging rhabdomeres in intact flies. In response to brief flashes, GCaMP6f signals had latencies of 10-25ms, reached 50% Fmax with ∼1200 effectively absorbed photons and saturated (ΔF/F0∼10-20) with 10000-30000 photons. In Ca2+ free bath, smaller (ΔF/F0 ∼4), long latency (∼200ms) light-induced Ca2+ rises were still detectable. These were unaffected in InsP3 receptor mutants, but virtually eliminated when Na+ was also omitted from the bath, or in trpl;trp mutants lacking light-sensitive channels. Ca2+ free rises were also eliminated in Na+/Ca2+ exchanger mutants, but greatly accelerated in flies over-expressing the exchanger. These results show that Ca2+ free rises are strictly dependent on Na+ influx and activity of the exchanger, suggesting they reflect re-equilibration of Na+/Ca2+ exchange across plasma or intracellular membranes following massive Na+ influx. Any tiny Ca2+ free rise remaining without exchanger activity was equivalent to <10nM (ΔF/F0 ∼0.1), and unlikely to play any role in phototransduction.

Keywords: Calcium imaging; Genetically encoded calcium indicators; InsP(3); Na/Ca exchanger; Phospholipase C; Phototransduction; TRP channels.


Figures

None
Graphical abstract
Fig. 1
Fig. 1
Light-induced currents from photoreceptors expressing GCaMP6f. (A) Whole-cell recordings of light-induced current responses to brief (1 ms) flashes (arrow), containing ∼100 effectively absorbed photons in a wild-type photoreceptor and a photoreceptor from ninaE-GCamP6f fly (each an average of 3 responses, voltage-clamped at −70 mV). (B) Averaged quantum bumps (after aligning rising phases) from wild-type (n = 10 cells, ∼40-60 bumps per cell) and GCaMP6f expressing photoreceptors (n = 6 cells). (C) Peak amplitudes to test flashes in wild-type (n = 16) and GCaMP6f expressing photoreceptors (n = 9) were indistinguishable (P = 0.846, 2-tailed t-test). (D & E) bump amplitudes and half-widths in wild-type (n = 10) and GCaMP6f expressing photoreceptors (n = 6) also showed no significant differences (P = 0.78 and 0.32 respectively).
Fig. 2
Fig. 2
Live imaging of GCaMP6f. (A) GCaMP6f fluorescence in a dissociated ommatidium (distal end) from ninaE-GCaMP6f fly: 6 frames from 250 Hz movie (4 ms exposures; see Movie 1) at t = 0 to 100 ms after turning on blue excitation. Images on left are raw images with brightness and contrast adjusted with respect to the same (brightest) frame; images on right are the same but with brightness and contrast individually auto-adjusted. Scale bar 10 μm (×40 oil immersion objective). (B) Frames from a similar movie of GCaMP6f in rhabdomeres imaged in the deep pseudopupil (DPP) of an intact living ninaE-GCaMP6f fly (x 20 air objective). (C) Time-courses from movies (as in A & B). In dissociated ommatidia, regions of interest from rhabdomeres (rh) and cytosol (cyt) towards edge of the ommatidium (white box in A) were selected. For DPP a rectangle encompassing all 6 rhabdomeres was selected. Mean ± S.E.M. n = 5-6 ommatidia. Traces normalised to facilitate comparison of time course: maximum ΔF/F0 values were in range 11–18 (see Fig. 3). (D) Normalised raw photomultiplier tube traces (PMT) sampled at 1 kHz, filtered at 0.5 kHz from ninaE-GCaMP6f flies. Representative single traces in response to supersaturating blue excitation are shown recorded from a dissociated ommatidium in normal bath (omma) and in vivo from the deep pseudopupil (DPP). Rising phases of the same traces shown in inset.
Fig. 3
Fig. 3
Intensity and time dependence of GCaMP6f signals using 2-pulse protocols. (A) 2 ms green flashes of different intensities were delivered 300 ms prior to blue excitation to measure GCaMP6f fluorescence from the DPP in completely intact ninaE-GCaMP6f flies. The pedestals (arrows) reflect the Ca2+ level in response to the green test flash (first response dark-adapted, i.e. without pre-flash). (B) resulting intensity dependence (F/log I function) after background correction, with respect to F0 during dark adapted “pedestal”. Data from trp (DPP) also included, along with results from dissociated wild-type ommatidia. (C) Same data normalised. (D) Summary of sensitivity data: expressed in terms of number of effectively absorbed photons required to generate 50% Fmax. (E) 2-pulse protocol using brief (2 ms) flashes of the same intensity delivered with variable delay in order to measure the time course of GCaMP6f responses (in vivo from DPP). (F) Family of resulting impulse responses to flashes of increasing intensity (∼150,450,1250,5000 effective photons): inset shows the first 100 ms on a faster time base. In all experiments, after each blue excitation flash, M was reconverted to R by an intense, photo-equilibrating 4 s orange stimulus and the fly left in the dark for 1 min before the next test flash. Longer dark adaptation times result in slightly larger responses, but 1 min was chosen as a compromise to allow sufficient data collection (e.g. each time course trace in panel F required 24 repeated cycles- or ∼25 min – to record).
Fig. 4
Fig. 4
Dependence of GCaMP6f signals on Ca2+ and Na+ influx. (A–C): Fluorescence signals (PMT) measured from dissociated ommatidia expressing GCaMP6f. Traces are averages of 4–10 traces plotted as ΔF/Fo (using F0 values measured in Ca2+ free bath from same ommatidia). In control bath (1.5 mM CaCl2) values in excess of 10 were reached within 0.1 s (see inset of boxed area on expanded scale). In Ca2+ free (0 Ca2+, 1 mM Na2EGTA) bath there was a slow rise to ∼4, but with no detectable increase for at least 200 ms. In Ca2+ and Na+ free solutions (average of data recorded in 130 mM CsCl, LiCl, KCl or NMDG Cl, all with 1 mM K2EGTA 0 Ca2+ and 4 mM MgCl2), this slow response was almost eliminated leaving a slow rise to a ΔF/Fo of only ∼0.1. (B) and (C) show same traces on different scales, with data from trpl;trp flies recorded in control bath solution (omma) and in vivo using the DPP, as well. Neither 0Ca or 0Ca 0Na responses were affected in null IP3R mutants (itpr). Note the initial transient decrease (origin uncertain), which is as large as the subsequent slow increase. These residual signals were both effectively eliminated in null PLC mutants (norpA DPP, n = 6). (D) and (E) Maximum ΔF/Fo values (2 s after light onset) in dissociated ommatidia in different bath solutions, and trpl;trp measured in vivo using the DPP). Data from wild-type background unless otherwise indicated (trpl;trp trpl plus La3+, and itpr). Same data plotted on linear (D) and log10 scales (E).
Fig. 5
Fig. 5
Image analysis and intensity dependence of Ca2+ free rises in dissociated ommatidia. (A) Six frames (0–2s) from a 100 Hz (10 ms exposure) movie (see Movie 2) of wild-type ninaE-GCaMP6f ommatidium in Ca2+ free bath (0 Ca2+, 1 mM EGTA 120 mM Na+). Brightness and contrast in all frames auto-adjusted to the final (brightest) frame. Bright spots towards distal (right) end of the ommatidium are autofluorescent pigment granules. Scale bar 10 μm. (B) Average time-courses (n = 6 ommatidia) from regions of interest covering rhabdomeres (rh) and cytosol (cyt) show near perfect overlap. Traces normalised to facilitate comparison of time-course: maximum ΔF/F0 values were in range 2–5. (C) Rising phase on faster time base. (D) PMT fluorescence traces from a wild-type ninaE-GCaMP6f ommatidium, perfused with Ca2+ free bath (1 mM EGTA) for ∼30s. Brief (10 ms) green flashes of increasing intensity (0, 4000, 20000, 70000 and 600000 effective photons) were presented 2 s before the 2 s blue excitation. The instantaneous fluorescence “pedestals” (arrows) reflects the Ca2+ level reached in response to the green flashes. (D) Resulting F/log I function (mean ± S.E.M. n = 4) compared to data from ommatidia in normal bath (1.5 mM Ca2+ replotted from Fig. 3).
Fig. 6
Fig. 6
Effect of Na+/Ca2+ exchange on GCaMP6f signals in Ca2+ free solutions. (A) GCaMP6f fluorescence traces in response to blue excitation in 0 Ca2+ bath (1 mM EGTA) in dissociated ommatidia expressing GCaMP6f in wild-type, calx1 mutants lacking exchanger activity and in ninaE-calx flies over-expressing the exchanger. Traces are mean ± S.E.M. n = 6-8 ommatidia. (B) calx1 GCaMP6f trace (mean ± S.E.M. n = 6) replotted at high gain. (C) maximum ΔF/Fo values (after 2 s) from wild-type, calx1 and ninaE-calx backgrounds in both normal bath (Ca2+) and Ca2+ free bath (0 Ca2+) with normal Na+. (D) wild-type, calx1 and ninaE-calx Ca2+ free ΔF/F0 values replotted on log10 plot along with 0 Ca2+ 0 Na+ data (Cs+ substitution) from wild-type and ninaE-calx.
Fig. 7
Fig. 7
Effects of Na+/Ca2+ exchanger expression under physiological conditions. (A) GCaMP6f F/log I functions determined in vivo using 2-pulse DPP protocols (as in Fig. 3) in wild-type background (replotted from Fig. 3), calx1 mutants (n = 7) and ninaE-calx flies (n = 5) over-expressing the exchanger. (B) Time courses of responses to brief 2 ms flashes containing ∼3000 effective photons (DPP 2-pulse data: mean ± S.E.M. n = 5−6 flies) in wild-type, calx1 and ninaE-calx. (C) Time to 50% recovery (t½) of GCaMP6f signal as a function of intensity of flash (mean ± S.E.M. n = 4-9 flies) in wild-type, calx1 and ninaE-calx flies (from time courses as in B). (D) Whole-cell recordings of light-induced currents in response to 1 ms flashes containing ∼100 effective photons in normal bath (rapid responses) and in Ca2+ free (1 mM EGTA) bath in wild-type, calx1 and ninaE-calx photoreceptors (averages of 3 responses). (E) Summary of data: peak amplitudes in normal bath (left, + Ca2+) and Ca2+ free bath (right, 0 Ca2+). Ca2+ free responses were significantly (P < 0.001) larger in calx1 mutants, and slightly (though not significantly: P = 0.23) decreased in ninaE-calx; whilst calx1 responses were significantly (P < 0.001) smaller than wild-type in the presence of Ca2+.
None

References

    1. Montell C. Drosophila visual transduction. Trends Neurosci. 2012;35:356–363. - PMC - PubMed
    1. Hardie R.C., Juusola M. Phototransduction in Drosophila. Curr. Opin. Neurobiol. 2015;34C:37–45. - PubMed
    1. Katz B., Minke B. Drosophila photoreceptors and signaling mechanisms. Front. Cell. Neurosci. 2009;3:2. - PMC - PubMed
    1. Song Z., Postma M., Billings S.A., Coca D., Hardie R.C., Juusola M. Stochastic, adaptive sampling of information by microvilli in fly photoreceptors. Curr. Biol. 2012;22:1371–1380. - PMC - PubMed
    1. Henderson S.R., Reuss H., Hardie R.C. Single photon responses in Drosophila photoreceptors and their regulation by Ca2+ J. Physiol. Lond. 2000;524:179–194. - PMC - PubMed

Publication types

MeSH terms